Top 6 Log Analysis Software Including Solarwinds in 2026
When servers crash at 3 AM or applications start throwing errors, teams need to quickly understand what went wrong. Log analysis platforms help by collecting scattered log files from different systems and making them searchable in a single location. These tools parse raw logs into structured data so you can find the needle in the haystack, whether that’s a database timeout, a failed API call, or an unusual spike in traffic.
Here are the top 6 log analysis tools based on my testing and user reviews:
Log Analysis Platforms
These platforms collect logs from every corner of your infrastructure, web servers, databases, application containers, and network devices, and make them searchable. When your checkout page returns 500 errors, you can trace the exact sequence: which database query failed, how long it took, what the error message said, and which user triggered it. Teams use them to debug production issues, analyze performance problems, and understand what happened during an incident.
Market presence
See vendor selection criteria.
Insights (below) come from our experience with these solutions as well as other users’ experiences shared in Gartner 1 , G22 , and TrustRadius3
Log Analysis Feature Comparison
Top Log Analysis Platforms
Based on testing and user reviews, here are the leading log analysis platforms:
1. SolarWinds Log Analyzer
SolarWinds Log Analyzer integrates directly with the Orion Platform, giving you log data alongside network and server performance metrics in one console. Instead of switching between tools to correlate a server crash with its logs, you see performance graphs and log entries on the same timeline.
Main features:
- Color-coded tagging lets you visually mark critical logs. Tag all payment-related errors in red, database timeouts in orange, so you spot patterns instantly without reading through thousands of entries.
- A real-time log stream shows logs as they happen. Filter the stream for keywords like “payment failure” or “timeout” and watch problematic events appear live.
- Preconfigured rules work out of the box for common log patterns. Custom rules let you add conditions (fire when specific sources generate specific events) and actions (send alert, run script, create ServiceNow ticket).
- PerfStack correlation displays logs on a timeline with performance metrics. See that database queries started timing out exactly when disk I/O spiked, or that error rates jumped when network latency increased.
- Device-based licensing charges by number of devices generating logs, not log volume. A chatty server and a quiet server cost the same, removing the guesswork from capacity planning.
Works best for: Organizations already running SolarWinds NPM or SAM who want log analysis integrated into their existing monitoring infrastructure rather than managing a separate platform.
2. Elastic Stack
Three components work together in Elastic Stack: Elasticsearch stores and searches your logs, Logstash collects and processes them, and Kibana visualizes the results. You can search through petabytes of data in seconds, which matters when you’re trying to find a specific error in millions of log entries. The platform scales horizontally, so adding more servers increases capacity.
Main features:
- Searches massive log volumes quickly using inverted indices
- Collects logs in real-time from Beats agents, Logstash pipelines, or direct API calls
- Parses any log format using Grok patterns, you can extract fields from nginx logs, Java stack traces, or custom application formats
- Detects anomalies with machine learning, like sudden spikes in error rates or unusual request patterns
- Creates custom dashboards in Kibana showing log trends, error distributions, and system behavior
- Elastic Agent Builder provides an LLM-powered framework for building custom AI agents that interact with log dataThe
- Streams feature enables AI-driven log summarization for faster incident analysis
- Enhanced ES/QL functionality with smart lookup joins for more powerful query capabilities
Works best for: Teams that need powerful search across huge log volumes and have the technical expertise to configure and maintain it. The learning curve is steeper than some alternatives, but the flexibility is unmatched.
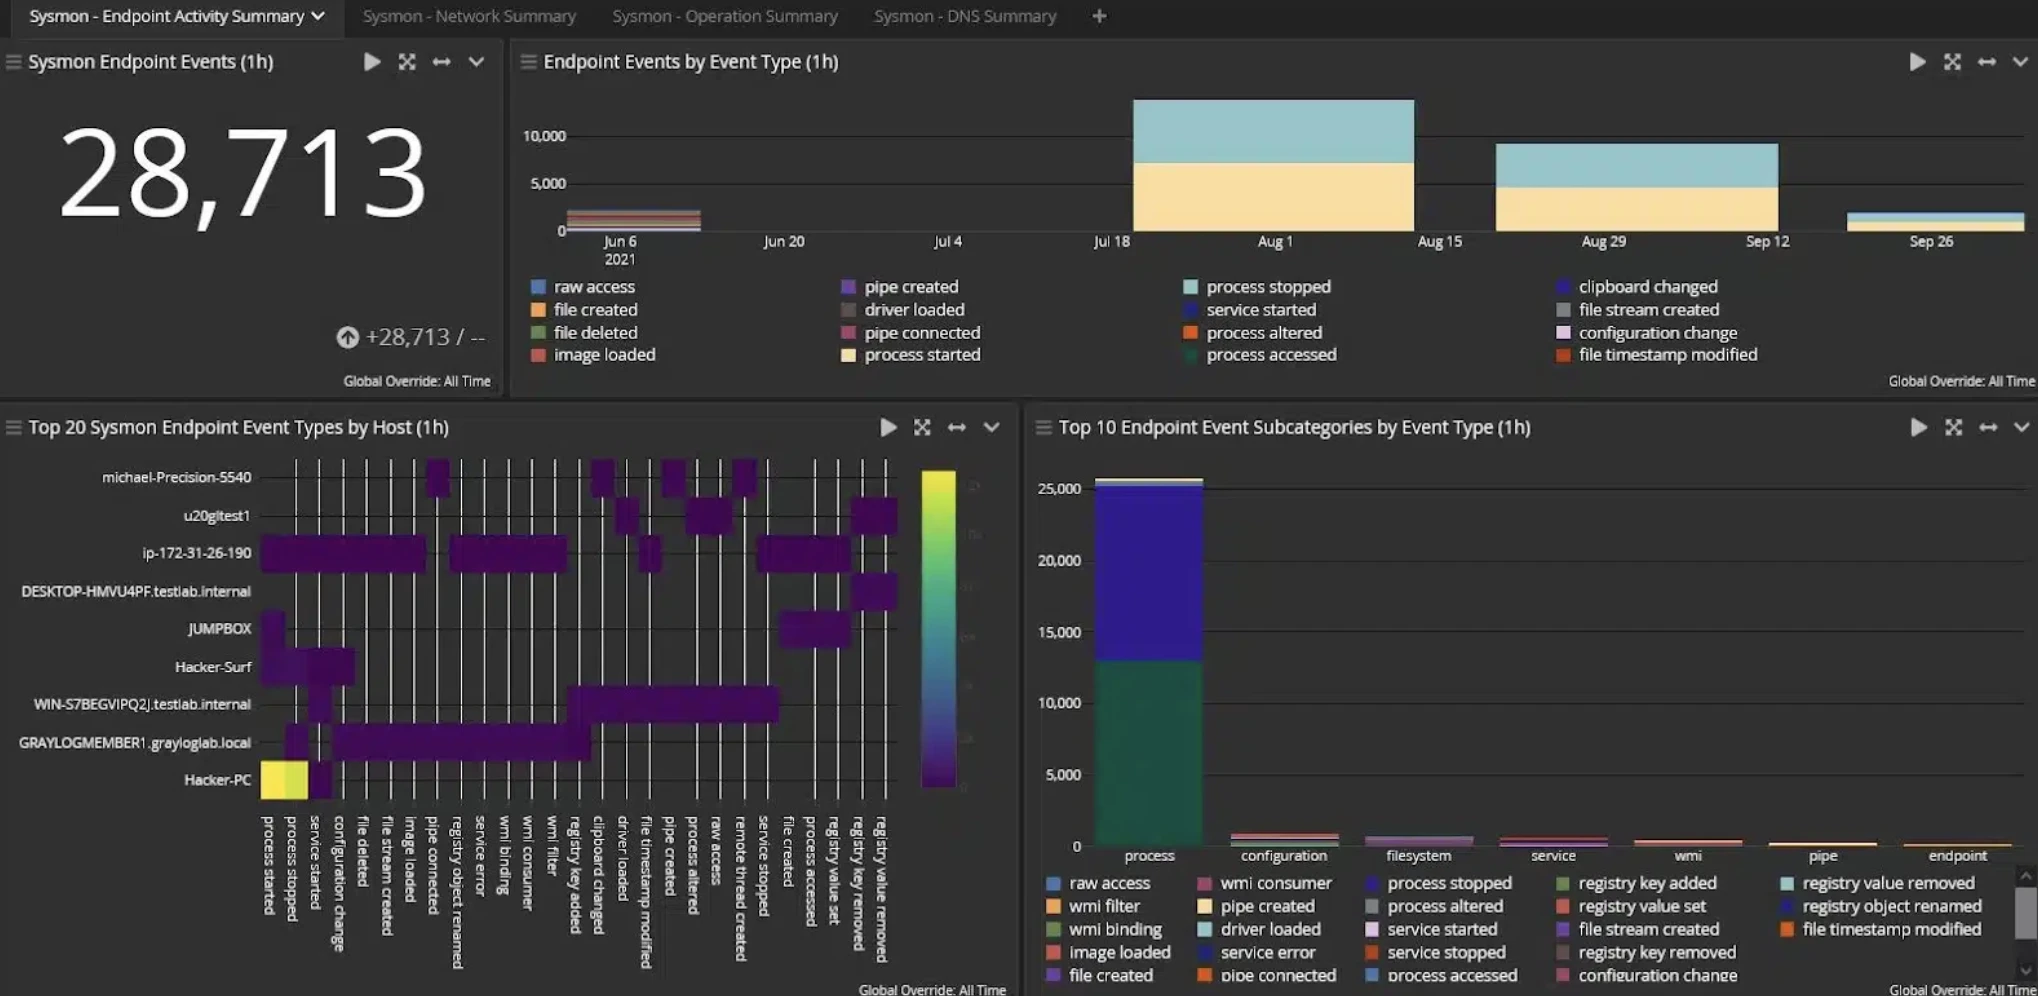
3. Graylog
Graylog takes a different approach than Elastic Stack; it prioritizes ease of use over maximum flexibility. The web interface guides you through setup, and many common log formats are parsed automatically without writing custom rules. Logs arrive via Syslog, GELF, or HTTP inputs, then get structured and stored for searching.
Main features:
- Automatic parsing for standard log formats saves hours of configuration
- Archives older logs to cheaper storage while keeping recent logs readily searchable
- Pipeline rules enrich logs with additional context, like adding geographic location based on IP address
Source: Graylog Enterprise4
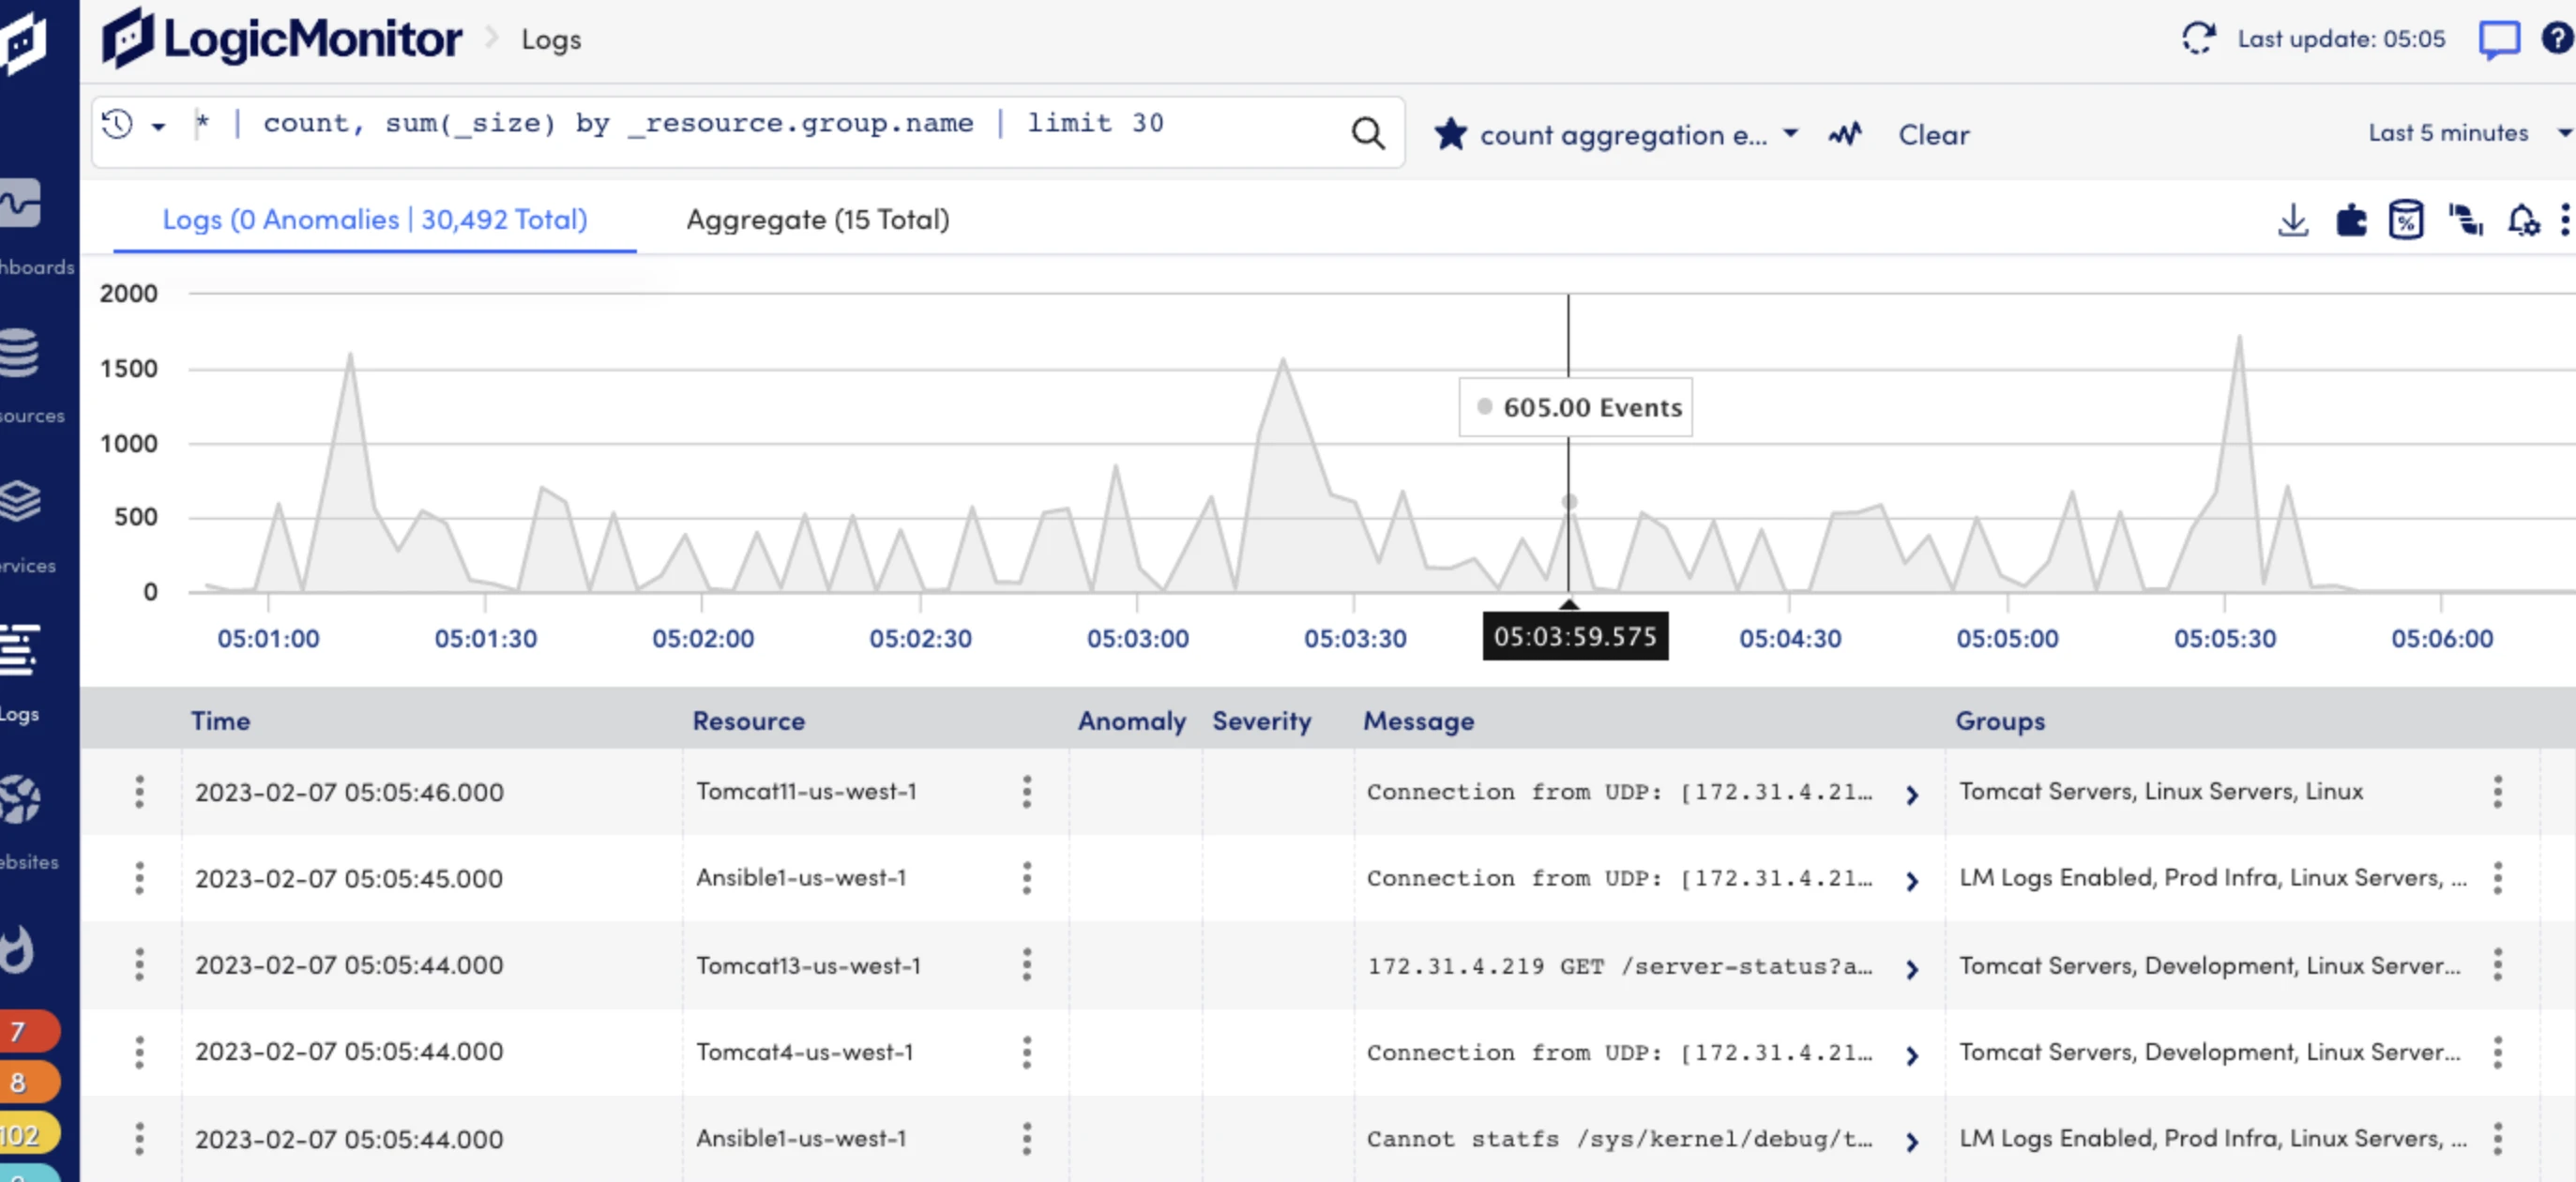
4. LogicMonitor LM Logs
Companies with offices, data centers, or infrastructure spread across multiple locations face a particular challenge: logs scattered across multiple locations. LogicMonitor’s LM Logs specializes in this scenario. The platform automatically discovers log sources across your network routers in Seattle, servers in Singapore, SaaS applications in the cloud, and centralizes them without manual configuration.
Main features:
- Discovers and connects to log sources automatically across your network
- Receives Syslog from network devices like firewalls, routers, and switches using standard TCP protocols
- Collects logs from Kubernetes clusters and containers wherever they run
- Transforms raw logs into structured data during ingestion, so they’re immediately searchable
- Flags anomalies by comparing log volume and patterns against historical baselines
Works best for: Organizations with geographically distributed infrastructure that need unified visibility. The auto-discovery reduces the operational burden of adding new log sources.
Source: LogicMonitor5
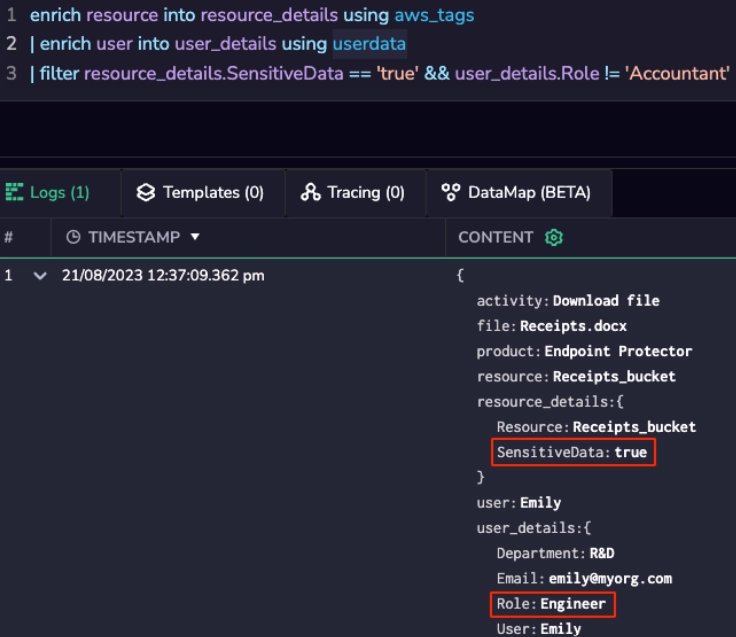
5. Coralogix
Coralogix addresses two problems that plague log analysis: cryptic error codes and alert fatigue. The platform uses lookup tables to translate error codes into readable explanations, so instead of seeing “ERR_1047”, you see “Database connection timeout after 30 seconds”. It also applies pattern recognition to reduce noise, learning which alerts actually matter and which are false alarms.
Main features:
- Connects to 300+ source,s including Logstash, Prometheus, Kubernetes, and AWS CloudWatch
- Lookup tables convert cryptic codes into human-readable messages automatically
- Enriches log entries with metadata like AWS resource tags or user session data
- Machine learning identifies which alerts are real issues versus noise, reducing 700,000 alerts to 700 actionable ones
Works best for: DevOps teams drowning in alerts who need to correlate application performance with log data. The SaaS model means no infrastructure to maintain.
Source: Coralogix6
6. Splunk Platform
Splunk built its reputation on one capability: you can throw any data at it and search through it. The platform collects logs from anywhere, legacy systems from the 1990s, modern containers, cloud services, IoT devices, and indexes everything. Teams queries this data using SPL, which resembles SQL but handles unstructured text. The latest version introduces SPL2, with enhanced query capabilities and SQL syntax support to facilitate adoption.
Main features:
- Universal forwarders collect data from any machine-generated source without custom configuration
- SPL2 offers enhanced query capabilities with SQL-like syntax for an easier learning curve
- Extracts fields from unstructured text automatically, then lets you refine the extraction
- Dashboards update in real-time, showing exactly the metrics and trends you define
- Log Observer Connect integrates cloud observability data directly into your Splunk searches

Source: Moore, Kevin7
How Log Analysis Actually Works
Log analysis platforms employ several techniques to turn raw text files into actionable insights:
- Log Normalization
Your web server logs look like “192.168.1.1 – – [15/Jan/2026:14:23:45] GET /api/users”. Your application logs look like “{timestamp: 2026-01-15T14:23:45, level: ERROR, message: Database timeout}”. Your database logs use yet another format. Normalization extracts the common elements, timestamp, severity, and source into a consistent structure. Now you can trace a single request from the load balancer through the application to the database, even though each system logs differently.
2. Pattern Recognition
Your system typically sees 1,000 login attempts per hour, mostly successful. Yesterday at 3 AM, there were 50,000 attempts in 10 minutes, 99% failures, all targeting admin accounts. Pattern recognition catches this deviation immediately. Or consider database queries: normally, they complete in 50-100ms, but suddenly 10% take over 5 seconds. The platform detects this shift before your users start complaining about slow page loads.
3. Real-Time Monitoring and Alerting
Monitoring watches your log stream continuously. When your payment API starts returning 500 errors, you get a Slack notification within seconds. But good monitoring reduces noise by alerting only when the error rate exceeds 1% of requests for at least 5 minutes. This prevents false alarms caused by transient issues while still catching real problems quickly.
4. Performance Analysis
Application logs reveal which endpoints consume the most resources. One endpoint might account for 60% of your database queries, despite handling only 10% of traffic, which is a target for optimization. Network logs show that your Tokyo office experiences packet loss every morning at 9 AM when everyone starts video calls. Container logs indicate which microservices scale most frequently, highlighting where to focus performance tuning efforts.
Choosing the Right Platform
Deployment preference now heavily favors cloud-based solutions. As of 2026, 68% of organizations have shifted to cloud-based log management, representing a fundamental market transformation from traditional on-premises deployments. Cloud platforms handle infrastructure maintenance, scaling, and updates automatically, which explains their dominance. However, self-hosted deployments remain necessary for organizations with strict data residency requirements, air-gapped environments, or specific compliance constraints that prohibit external data transmission. The choice depends on your compliance requirements, available staff, and data governance policies.
Real-World Scenarios
Finding Why Payments Fail
A customer reports failed payments. Your log analysis platform shows that at 14:23:45, user ID 12847’s payment request was received by your API. The application logs show the request was valid. Then at 14:23:47, the database query to verify the account timed out after 2 seconds. The payment gateway waited until 14:23:50, then returned a timeout error. Cross-referencing timestamps shows that these timeouts occur only during your daily 2 PM database backup. You reschedule backups to 3 AM when traffic is minimal.
Tracking Down Memory Leaks
Your API gradually slows until it crashes; after a restart, it works fine. Container logs show memory climbing from 512 MB to 4 GB over 6 hours before the crash. Application logs reveal that a specific endpoint allocates objects but never releases them. By filtering logs to this endpoint, you identify that requests processing large datasets (>10,000 records) trigger the leak. The logs show the exact function and timestamp for each problematic request, giving your developers a precise starting point for debugging.
Detecting Credential Stuffing
Authentication logs show 10,000 login attempts in one hour across 500 different usernames. Each IP address makes exactly 19 requests just below your rate limit of 20. The user-agent strings rotate between 30 different browsers. Pattern recognition flags this as coordinated rather than organic traffic. You implement stricter rate limiting based on behavioral patterns rather than IP addresses, blocking the attack without affecting legitimate users.
What Log Analysis Platforms Don’t Do
Log analysis platforms find patterns and help troubleshoot problems. They don’t hunt for attackers. SIEM platforms maintain threat intelligence databases; they know what a SQL injection attempt looks like, what behaviors indicate a compromised account, and which IP ranges belong to known bad actors. Log analysis platforms can show you suspicious patterns, but they won’t tell you “this matches attack signature CVE-2024-1234”.
Compliance reporting is another gap. SIEM systems include templates for PCI-DSS, HIPAA, and SOC 2. They know which logs to retain, what constitutes a security event, and how to format audit reports. Log analysis gives you raw access to your logs, but building compliance reports requires custom queries and manual interpretation.
Incident response workflows matter during security events. When SIEM detects a breach, it integrates with ticketing systems, assigns severity levels, suggests response playbooks, and tracks remediation. Log analysis shows you what happened you figure out what to do about it.
Pick log analysis for operational troubleshooting: why did the deployment fail, which service is causing latency, and what changed before the error started? Pick SIEM for security monitoring: is someone attacking us, which accounts are compromised, what data was accessed. Many organizations need both SIEM for security operations, log analysis for DevOps, and IT operations.
Vendor selection criteria
- Number of reviews: 100+ total reviews
- Average rating: Above 4.0/5
- Number of employees: 100+
FAQs
Log analysis examines and records log files to understand a system’s behavior, performance, and security. Teams use log correlation, forensic analysis, and threat intelligence to detect malicious activity.
Log analysis software needs to:
Collect logs from servers, applications, and databases
Centralize log management through mapping, categorization, and tagging
Enable search and queries so users can filter logs by criteria
The problem: Analyzing system logs protects critical data and detects abnormal activities. But ingesting terabytes of log data without the right tools to parse, collect, and detect anomalies is futile.
How log analysis helps: Log analysis shows you when and where to act, enabling planned remediation strategies. While monitoring every IoT device on your network may be impractical, you can focus on the most vulnerable areas.
For instance, monitoring high-risk zones lets you gather threat intelligence to limit gateway restrictions and prevent data loss. You can identify lateral movement within your network by analyzing unusual login attempts, minimizing the impact of a breach.
Companies use log analysis to find errors, trends, patterns, and anomalies that reveal how systems work.
Various sources create logs: operating systems, applications, databases, servers, and network devices. Each source has a unique format. Web server logs contain information about requests made to the server, including:
IP addresses
Session IDs
Timestamps (when specific events occurred)
–Access logs: Every request made to a server is recorded in an access log, which includes information such as IP addresses and timestamps.
These logs are critical for analyzing user activity, monitoring traffic trends, and detecting possible security issues. For example, a rapid rise in requests from a single IP address may signal a DDoS threat.
–Error logs: Error logs record incidents in which something went wrong with a system or application. This might involve lost files or crashing apps. Companies may examine such logs to identify errors and fix them before they escalate.
–Event logs: Event logs record major system events such as user logins, initialization, and configuration changes. Event logs can help you monitor access requests.
Further reading
Cite this research
Pick the format that matches where you're publishing. Pasting the link version into your CMS preserves the backlink.
@misc{dilmegani2026,
  author = {Dilmegani, Cem and Sezer, Sena},
  title  = {{Top 6 Log Analysis Software Including Solarwinds in 2026}},
  year   = {2026},
  month  = may,
  howpublished    = {\url{https://aimultiple.com/log-analysis-software}},
  note   = {AIMultiple. Retrieved May 27, 2026}
}
Reference Links
Cem's work has been cited by leading global publications including Business Insider, Forbes, Washington Post, global firms like Deloitte, HPE and NGOs like World Economic Forum and supranational organizations like European Commission. You can see more reputable companies and resources that referenced AIMultiple.
Throughout his career, Cem served as a tech consultant, tech buyer and tech entrepreneur. He advised enterprises on their technology decisions at McKinsey & Company and Altman Solon for more than a decade. He also published a McKinsey report on digitalization.
He led technology strategy and procurement of a telco while reporting to the CEO. He has also led commercial growth of deep tech company Hypatos that reached a 7 digit annual recurring revenue and a 9 digit valuation from 0 within 2 years. Cem's work in Hypatos was covered by leading technology publications like TechCrunch and Business Insider.
Cem regularly speaks at international technology conferences. He graduated from Bogazici University as a computer engineer and holds an MBA from Columbia Business School.

Be the first to comment
Your email address will not be published. All fields are required. Comments are left in their original language.