Agentic AI for Cybersecurity: 10 Use Cases & Examples
Agentic AI refers to AI systems that combine models like large language models (LLMs) with automated workflows, tool integration, and decision support. These systems assist security teams in SecOps and AppSec by analyzing alerts, automating routine tasks, and supporting investigative work.
Explore structured, real-world use cases of agentic AI in cybersecurity, as well as what these agents do, how they work, and their practical limitations:
Examples of AI agents in cybersecurity
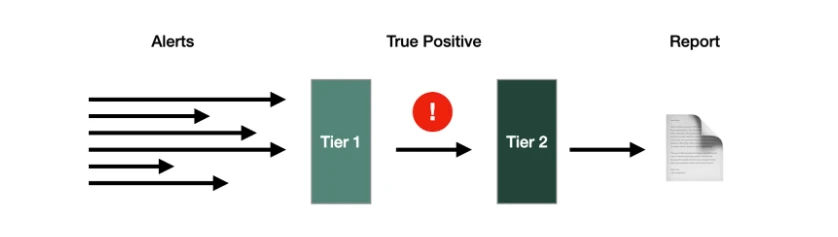
- Tier 1 agents
- Assist with initial detection and triage of alerts.
- Perform alert classification, deduplication, and enrichment.
- Provide context for analysts to prioritize threats.
- Tier 2 agents
- Execute predefined actions under human supervision.
- Example tasks: isolating affected systems, initiating playbook-driven containment.
- Tier 3 agents
- Support advanced threat analysis.
- Example capabilities: correlating telemetry across systems, assisting threat hunting, vulnerability scanning.
Tier 3 agents do not replace human analysts but augment their workflow.
Agentic AI for cybersecurity workflows
Unlike simple rule‑based automation found in traditional security systems, agentic AI can orchestrate multiple tools, integrate contextual information from diverse sources, and support decision‑making by processing unstructured data. However, these systems operate with human oversight or preconfigured policies rather than fully autonomous learning and control in production environments.
Agentic AI leverages its ability to learn dynamically from its environment.1 It enhances cybersecurity activities by:
- Continuously monitoring and addressing threats in real-time
- Automating repetitive SOC tasks with minimal human intervention
- Offering contextual decision support
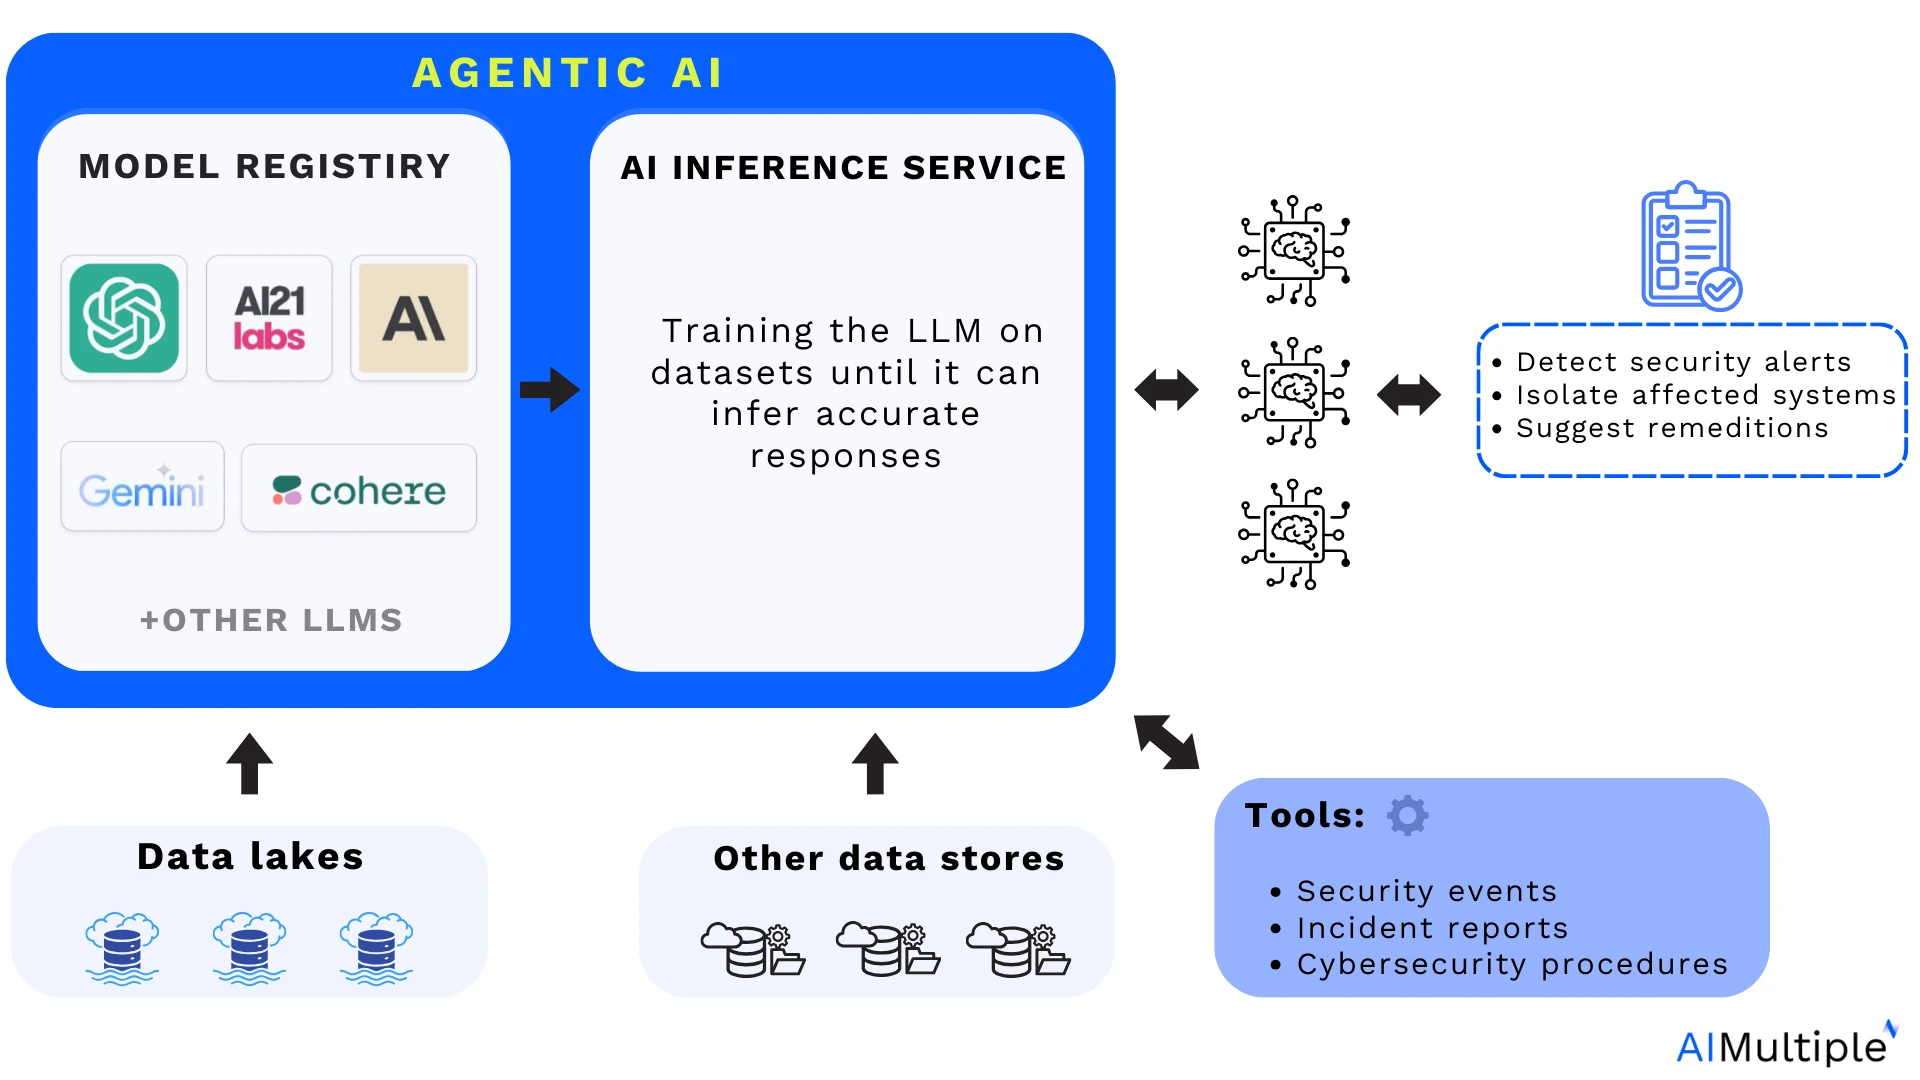
Architecture of AI Agents integrated with AI Inference, for their interaction with LLMs and enterprise data for SOC automation:
Adapted from: Cloudera2
Core capabilities of Agentic AI cybersecurity tools
The main capabilities of cybersecurity agentic AI tools include:
- Intelligent alert triage and enrichment: Agentic systems can classify and prioritize alerts, reducing noise and helping SOC analysts focus on meaningful threats.
- Automated investigation assistance: These systems can gather contextual information (e.g., threat intelligence, log correlations) and summarize findings for human analysts.
- Containment and playbook execution: Agentic AI can execute containment actions such as quarantining a host or enforcing access restrictions defined in automated playbooks, subject to governance and human supervision.
- Threat hunting support: They assist analysts by correlating indicators of compromise (IOCs) across data sources and suggesting investigative hypotheses, though substantial human interpretation remains required.
- Vulnerability analysis and prioritization: AI systems help analyze and score vulnerabilities at scale to support resource prioritization.
Example workflow: AI agent for vulnerability detection (Tier 1)
In cybersecurity proofs-of-concept, AI agents have been implemented to support vulnerability scanning and triage workflows, interfacing with APIs that provide vulnerability data and orchestrating tasks such as ticket creation or report generation.
In addition to enterprise systems like Dropzone AI, there are also hand-built implementations where Tier 1 agents handle the initial detection and triage of potential security threats.
Here is a demo for building an automated vulnerability detection agent in the DevNet sandbox environment:
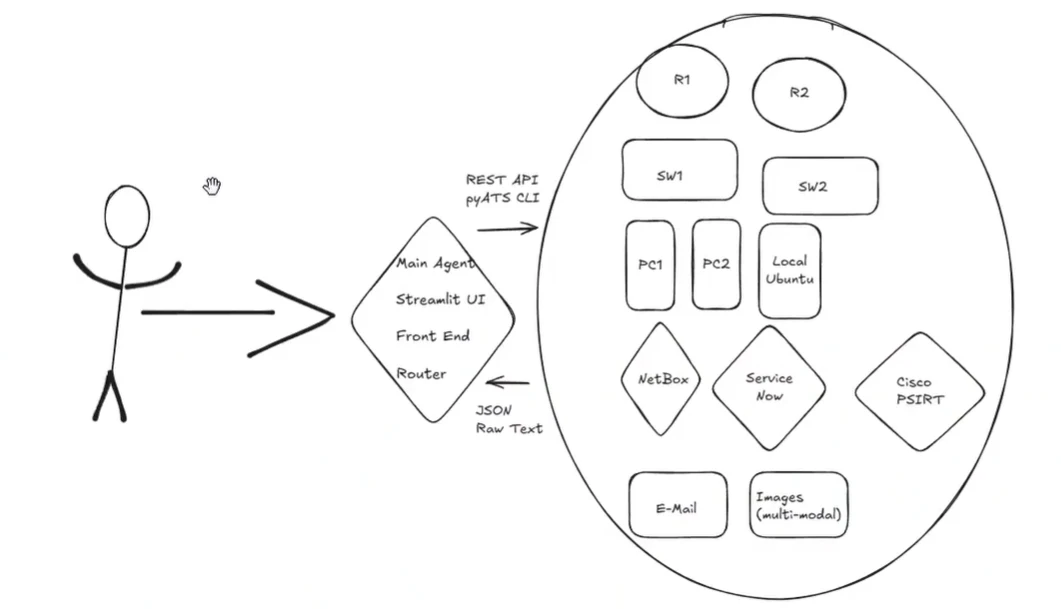
Agentic architecture used in the demo: The agent interfaces with a front-end interface (such as Streamlit UI) and a router agent (ACCS), sending REST APIs and commands in one direction and receiving responses, either in JSON or raw text, in the other direction.
Workflow and agent interactions
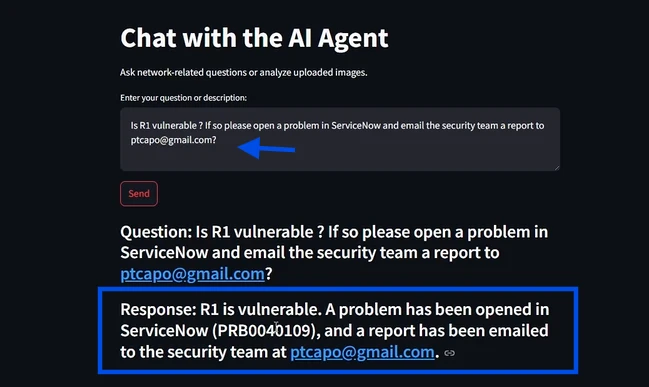
1. Prompting: The user enters a prompt, such as “Is R1 vulnerable? If so, please open a problem in ServiceNow and email the security team a report to xyz@gmail.com.”
2. Initial processing: The agent receives the prompt and analyzes the request. It identifies that the task is to check the vulnerability of Router 1 (R1), open a problem ticket in ServiceNow, and email a report to the specified address.
3. Query execution: The front-end agent (Streamlit UI) and router agent (ACCS) communicate with each other. The router agent queries the system for Router 1’s status, checking for vulnerabilities. It dynamically determines the necessary commands and runs them (e.g., using the show version command to retrieve version details).
4. Data collection: The router agent collects the necessary data, such as the version of Router 1, and sends this data to the PSIRT API to check for any known vulnerabilities associated with that version.
5. Vulnerability detection: The system queries the PSIRT API, receives the results (either JSON or raw text), and processes the information. It identifies if there are any high-risk vulnerabilities related to Router 1.
6. Action execution: If vulnerabilities are detected:
- A problem ticket is automatically opened in ServiceNow
- The agent emails a vulnerability report to the security team.
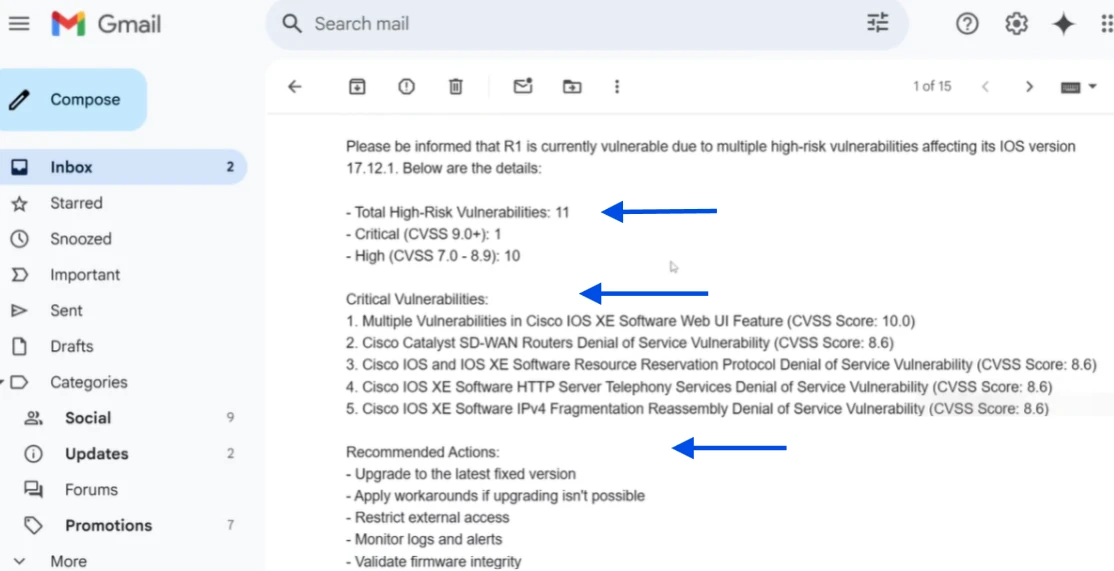
See the vulnerability email report generated by the AI agent:
Real-life use cases: Agentic AI in SecOps
1. Triage and investigation
- Agents group alerts, remove duplicates, and enrich alerts with threat context.
- Example enrichment: IOC checks, endpoint and account information.
- Human analysts still review findings to avoid false positives.
Real-life example: AI agents leveraging triage and investigation
Challenges: A digital insurance company’s early security configuration required manual alert management, which was resource-intensive.
- High volume of security alerts
- Time-consuming processes
- Need for continuous 24/7 monitoring
Solutions: The company deployed cybersecurity AI agents and integrated these agents with existing systems like AWS, Google Workspace, and Okta.
Consequences:
- Reducing the manual burden allowed SOC analysts to prioritize higher-value tasks.
- Detailed investigation reports provided a granular level of analysis, increasing the visibility into IOC (indicator of compromise).
- Reduction in false positives improved accuracy in threat detection.4
2. Threat hunting support
Agentic AI can be used in cybersecurity systems to detect and respond to threats in real-time.
For example, these agents can identify unusual network behavior and isolate impacted devices autonomously to prevent a compromise without human intervention.
- Agents help analysts detect unusual network behavior.
- They categorize alerts by atomic, computed, and behavioral indicators.
- They correlate indicators across historical and real-time data.
- Analysts interpret suggested investigative steps; AI does not replace expert judgment.
Real-life case study: AI agents leveraging threat hunting
Challenges: The University of Kansas Health System had difficulties in coordinating incident response, some of the key challenges include:
- Lack of visibility
- Limited incident response
- Employee resource constraints
Solutions: The University implemented a security platform with agentic AI capabilities to improve visibility and automate incident response threat-hunting.
Consequences:
- Visibility across systems increased by over 98%
- Detection coverage has improved by 110% within six months.
- Automated incident response processes filtered and resolved 74,826 out of 75,000 alerts, escalating 174 for manual review.
- True positives among escalated alerts totaled 38, reducing noise and enabling focused responses.5
3. Response actions
Agents can generate infrastructure-as-code templates (e.g., OpenTofu, Pulumi). They can perform endpoint actions or update security controls under human oversight.
Real-life example: AI agents leveraging response actions
Challenges: APi Group, a distribution organization, faced the following cybersecurity challenges:
- Diverse technology stacks
- Visibility across the ecosystem
Solutions: To address the above challenges, APi Group implemented ReliaQuest’s agentic AI platform to enhance threat detection for its Microsoft environments.
Consequences:
- Reduced response times by 52% through automation and integrated playbooks.
- Achieved a 47% increase in visibility across Microsoft 365, Cisco, and Palo Alto stacks.
- Expanded MITRE ATT&CK coverage by 275%.6
4. Agentic AI as an attacker tool
Most coverage of agentic AI in security focuses on defense, but the same capabilities are now documented in offensive operations.
Real-life example: GTG-1002
In November 2025, Anthropic’s threat intelligence team reported disrupting what it described as the first largely autonomous AI-orchestrated cyber espionage campaign, attributed to a suspected Chinese state-sponsored group it tracked as GTG-1002.7 The campaign involved near-simultaneous intrusion attempts against roughly 30 targets, including technology firms, financial institutions, chemical manufacturers, and government agencies, with several confirmed compromises before the activity was halted.
What distinguishes this from earlier AI-assisted attacks is the degree of autonomy. According to the report, the threat actor used an agentic coding tool to execute an estimated 80–90% of tactical operations independently, at request rates not achievable by human operators. The AI handled work across the intrusion lifecycle:
- Reconnaissance: enumerating internal services within targeted networks without step-by-step human direction.
- Vulnerability discovery and exploitation: identifying weaknesses in human-selected targets and exploiting them in live operations.
- Post-exploitation: lateral movement, credential harvesting, data analysis, and exfiltration.
The report also noted limits. The AI occasionally hallucinated credentials or claimed access to information that was public, which the authors cited as a remaining obstacle to fully autonomous attacks.
Agentic AI and security operations (SecOps) explained
Security operations (SecOps) is a collaborative approach between IT security and IT operations teams focused on proactively identifying, detecting, and responding to cyber threats.
The problem:
SecOps face serious fatigue since teams deal with vast data from diverse systems and rapidly evolving threats while navigating complex organizational structures and compliance requirements.
How agentic AI helps:
AI is especially effective at “reasoning tasks” such as analyzing alerts, conducting predictive research, and synthesizing data from tools.
Thus, AI agents in SecOps can help automate tasks that require real-time analysis and decision-making, such as phishing, malware, credential breaches, lateral movement, and incident response.
For example, these tools can be trained on MITRE ATT&CK knowledge bases to mimic the expertise of human analysts or use incident response playbooks to:
- enrich alerts
- detect impacted systems
- isolate/triage infected systems
- create incident reports
Agentic AI cybersecurity tools, such as Trase, can automate large parts of compliance work for standards like SOC 2 and HIPAA.8
Source: SCALE9
Real-life use cases: Agentic AI in AppSec
5. Risk identification
Agentic AI continuously analyzes the environment to surface vulnerabilities in applications and codebases through external and internal discovery. AI agents can execute external and internal discovery to identify threats:
External discovery:
- storing and classifying data about your apps and APIs.
- scanning for exposed web servers.
- discovering open ports on internet-facing IP addresses.
Internal discovery:
- Evaluating runtime configurations, identifying issues, and prioritizing.
- API accessibility & functionality visualization
- App-API visualization and usage
- Agentless AWS & Azure API workload monitoring
- App traffic volume & pattern analysis
6. Application test creation and adaptation
AI agents generate tests automatically depending on user interactions with the application. As testers or developers use the tool to capture test cases, the AI monitors and creates test scripts.
If the application’s UI changes (for example, an element’s ID changes or the layout changes), the AI agent may identify these changes and customize the test scripts to avoid failure.
7. Dynamic application test execution
Agentic AI continuously executes tests in varied contexts (e.g., across multiple browsers and devices) without human interaction. The AI agents can schedule tests and analyze application behavior autonomously to ensure complete testing coverage.
They can also dynamically customize test parameters, such as copying different user data inputs or changing network conditions, to allow for a more thorough application analysis.
8. Autonomous reporting and predictive suggestions
AI Agents can examine application testing data autonomously, finding failure patterns and determining core causes.
For example, if numerous tests fail due to the same problem, the AI Agent will combine the findings and highlight the underlying issue to the development team.
Based on previous test data, the AI agents can predict potential future failures and recommend application testing methodologies to address these issues.
9. Autonomous remediation
Agentic AI automates the remediation process, for example, if the AI agent detects that certain tests are redundant or do not adequately cover specific risks, it can optimize the test suite by deleting unrelated tests and prioritizing those that focus on more relevant areas.
The AI agent can also detect when a test fails due to minor errors (such as a minor UI change) and “remediate” the test script to comply with the revised application, eliminating false positives and requiring less manual involvement.
10. Automated pentesting
Agentic AI automates the penetration testing process, including the identification of vulnerabilities, generation of attack plans, and execution. Some key practices of AI agents in pentesting initiatives include:
Real-time adversary simulation:
- Conducting simulations like network, application, and social engineering attacks.
- Executing penetration tests such as DAST (dynamic application security testing).
Reconnaissance:
- Scanning the internet, including the deep, dark, and surface web, to detect exposed IT assets (e.g., open ports, misconfigured cloud buckets).
- Integrating OSINT (open-source intelligence) and threat intelligence to map attack surfaces.
Agentic AI and application security (AppSec) explained
Application security entails protecting apps throughout their lifecycle, from design and development through deployment and continuous maintenance.
The problem:
As hosted apps became increasingly important as key revenue drivers for public-scale enterprises, so did their security. This created recent trends such as:
- Wide usage of Cloud, SaaS applications has moved security earlier in the SDLC to minimize risks before they reach production.
- With the increase in cloud-native programming, more migration to third-party platforms such as AWS has occurred, thus the attack surface for apps becomes more exposed to vulnerabilities.
As a result of increasing attack surface and potential, attackers developed new and inventive methods of compromising apps.
How agentic AI helps:
Agentic AI can help enhance AppSec by integrating and automating various stages of the application lifecycle to enhance security, including monitoring your CI/CD pipelines or automating pent testing.
Challenges of agentic AI in cybersecurity
1. Lack of transparency and interpretability
- Opaque decision-making: AI-driven security operations and systems can be difficult to interpret, especially when they modify security policies or decisions on their own. Test engineers and developers may struggle to comprehend why certain actions were made or to confirm the AI’s decisions.
- Trust and reliability: Without explicit explanations, it might be difficult for teams to trust the AI’s recommendations or revisions, leading to resistance to implementing agentic AI solutions.
2. Data quality concerns
- Data reliance: AI agents need diverse data to learn how to perform actions effectively. Insufficient or biased data can result in false actions or incorrect forecasts.
- Edge cases in system configurations: If an organization’s IT infrastructure includes bespoke configurations or rare software combinations, an AI agent may misinterpret normal behaviors as anomalies or fail to detect genuine threats.
3. Maintaining reliability
- False positives and negatives: Agentic AI can incorrectly classify data related to SecOps or AppSec, resulting in false positives (reporting bugs when none exist) or false negatives (failing to detect actual issues). These errors may compromise trust in the system and require manual intervention to validate results.
- Adaptability problems: Although agentic AI is designed to adapt to changes, certain complex or unexpected changes in the application (for example, major UI redesigns or backend architecture changes) may still cause security operations to fail, necessitating human intervention to update the AI’s models.
4. Complexity of implementation
- Difficulty in securing API integration: AI agents frequently interface with external systems; therefore, protecting APIs is critical. API tokenization and validation are all measures that help to ensure a reliable interaction.
- Training and deployment: Agentic AI models should be trained on large datasets and diverse scenarios to be effective, which can be resource-intensive and time-consuming.
5. Human oversight requirements
- Continuous monitoring: While agentic AI aims to reduce human involvement, it still requires monitoring and maintenance to ensure that it functions properly. Security teams need to verify the AI’s results, adjust models as needed, and get involved when the AI encounters complex or unexpected scenarios.
- Highly skilled personnel requirements: Managing agentic AI necessitates expertise in AI, machine learning, or application security. Organizations may have difficulty finding or training staff with the required skills.
Final thoughts on agentic AI for cybersecurity
Agentic AI has the potential to enhance cybersecurity operations by improving response times and alleviating the burden on security teams.
However, challenges such as a lack of transparency, data quality concerns, and false positives/negatives can increase the overall difficulty of deploying agentic AI solutions effectively.
Successful implementation of agentic AI in operations requires skilled personnel, ongoing monitoring and updates, effective false-positive validation processes, and attention to other key challenges.
Further readings
- AI Agent Sprawl Signs & Checklist to Manage Sprawl
- AI Agent Vulnerability
- Top 30+ Industrial AI Agents Landscape to Watch
- AI Agent Traps: 20 Real-Life Incidents
Cite this research
Pick the format that matches where you're publishing. Pasting the link version into your CMS preserves the backlink.
@misc{dilmegani2026,
  author = {Dilmegani, Cem},
  title  = {{Agentic AI for Cybersecurity: 10 Use Cases & Examples}},
  year   = {2026},
  month  = may,
  howpublished    = {\url{https://aimultiple.com/agentic-ai-cybersecurity}},
  note   = {AIMultiple. Retrieved May 20, 2026}
}
Reference Links
Cem's work has been cited by leading global publications including Business Insider, Forbes, Washington Post, global firms like Deloitte, HPE and NGOs like World Economic Forum and supranational organizations like European Commission. You can see more reputable companies and resources that referenced AIMultiple.
Throughout his career, Cem served as a tech consultant, tech buyer and tech entrepreneur. He advised enterprises on their technology decisions at McKinsey & Company and Altman Solon for more than a decade. He also published a McKinsey report on digitalization.
He led technology strategy and procurement of a telco while reporting to the CEO. He has also led commercial growth of deep tech company Hypatos that reached a 7 digit annual recurring revenue and a 9 digit valuation from 0 within 2 years. Cem's work in Hypatos was covered by leading technology publications like TechCrunch and Business Insider.
Cem regularly speaks at international technology conferences. He graduated from Bogazici University as a computer engineer and holds an MBA from Columbia Business School.


Comments 1
Share Your Thoughts
Your email address will not be published. All fields are required. Comments are left in their original language.
Very insightful overview of how agentic AI is moving cybersecurity from reactive alerting to autonomous, intelligence-driven operations. The real-world SecOps and AppSec examples clearly show the value of AI agents in reducing noise, accelerating response, and scaling security—while also realistically highlighting the challenges around trust, data quality, and human oversight.