Top 6 Open-Source Log Analysis Tools: Wazuh, Graylog & More
As a CISO in a highly regulated industry with ~2 decades of cybersecurity expertise, I have worked with multiple SIEM-like log analysis platforms. From those, I picked the top 6 open-source log analysis tools. In evaluating these tools, I focused on key factors such as log collection flexibility, real-time event detection, scalability, and support for various log formats.
Log management and detection features
Integrity & nonrepudiation features
Pricing of log analysis tools
Disclaimer: Insights (below) come from user experiences shared in Reddit1 , and G22 .
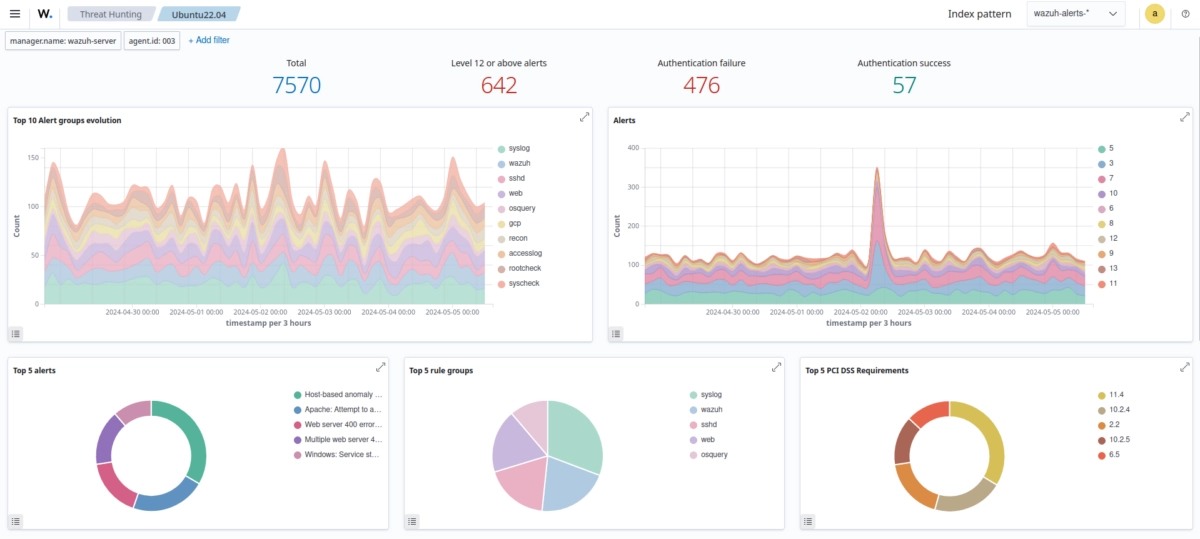
Wazuh
Wazuh is an open-source SIEM that goes further than most tools in this category. It combines log monitoring, endpoint security, file integrity monitoring, vulnerability detection, and real-time security event detection into a single agent-based platform.
How log management works in Wazuh
An endpoint agent deployed on each monitored system collects logs locally and forwards them to the Wazuh management server for processing and analysis. The agent handles log collection, integrity monitoring, and active response locally; it is not just a shipper. Wazuh integrates natively with the Elastic Stack, using Elasticsearch for log storage and search, and Kibana (via the Wazuh plugin) for dashboards and investigation.
The rule engine runs on the manager and evaluates incoming log events against a ruleset that includes default rules, CIS benchmarks, MITRE ATT&CK mappings, and any custom rules you write. When a rule fires, Wazuh generates an alert and if you have active response configured, can take automated action on the endpoint: block an IP, kill a process, quarantine a file. That feedback loop from detection to response, without leaving the platform, is what separates Wazuh from pure log collectors like Fluentd or Syslog-ng.
Hosting options:
- Self-hosted: The platform is free to download and use. Optional annual support is priced based on the number of monitored endpoints (servers, workstations, and network devices). The organization is responsible for maintaining hardware and resources in this model.
- Cloud-hosted: The hosting provider manages the Wazuh Server and Elastic Stack; you only need to deploy agents. Pricing depends on indexed data (previously called hot storage) and the chosen retention period.[3]
Standout features:
- Flexible log collection: Wazuh ingests logs from Windows Event Viewer, Linux system messages, JSON-formatted application logs, and a wide range of source types without additional plugins. Out-of-the-box coverage is broader than Graylog or Logstash, which require more configuration to reach the same breadth.
- MITRE ATT&CK mapping: Rules map to MITRE ATT&CK techniques by default, so alerts tell you not just what happened but where it fits in an attack chain. This matters for triage; you can tell the difference between a noisy authentication failure and a credential stuffing attempt without writing custom correlation.
- Third-party integrations: Native integrations with Office 365, AWS, GCP, Azure, and Rapid7. A built-in Python library supports custom integrations without the plugin configuration that Syslog-ng or Fluentd require.
- API and active response: A RESTful API covers log queries, rule and decoder management, alert queries, and agent interactions. The active response feature executes scripts on the monitored endpoint on alert-blocking IP addresses, killing processes, isolating hosts. This is not available in the Elastic Stack without additional tooling.
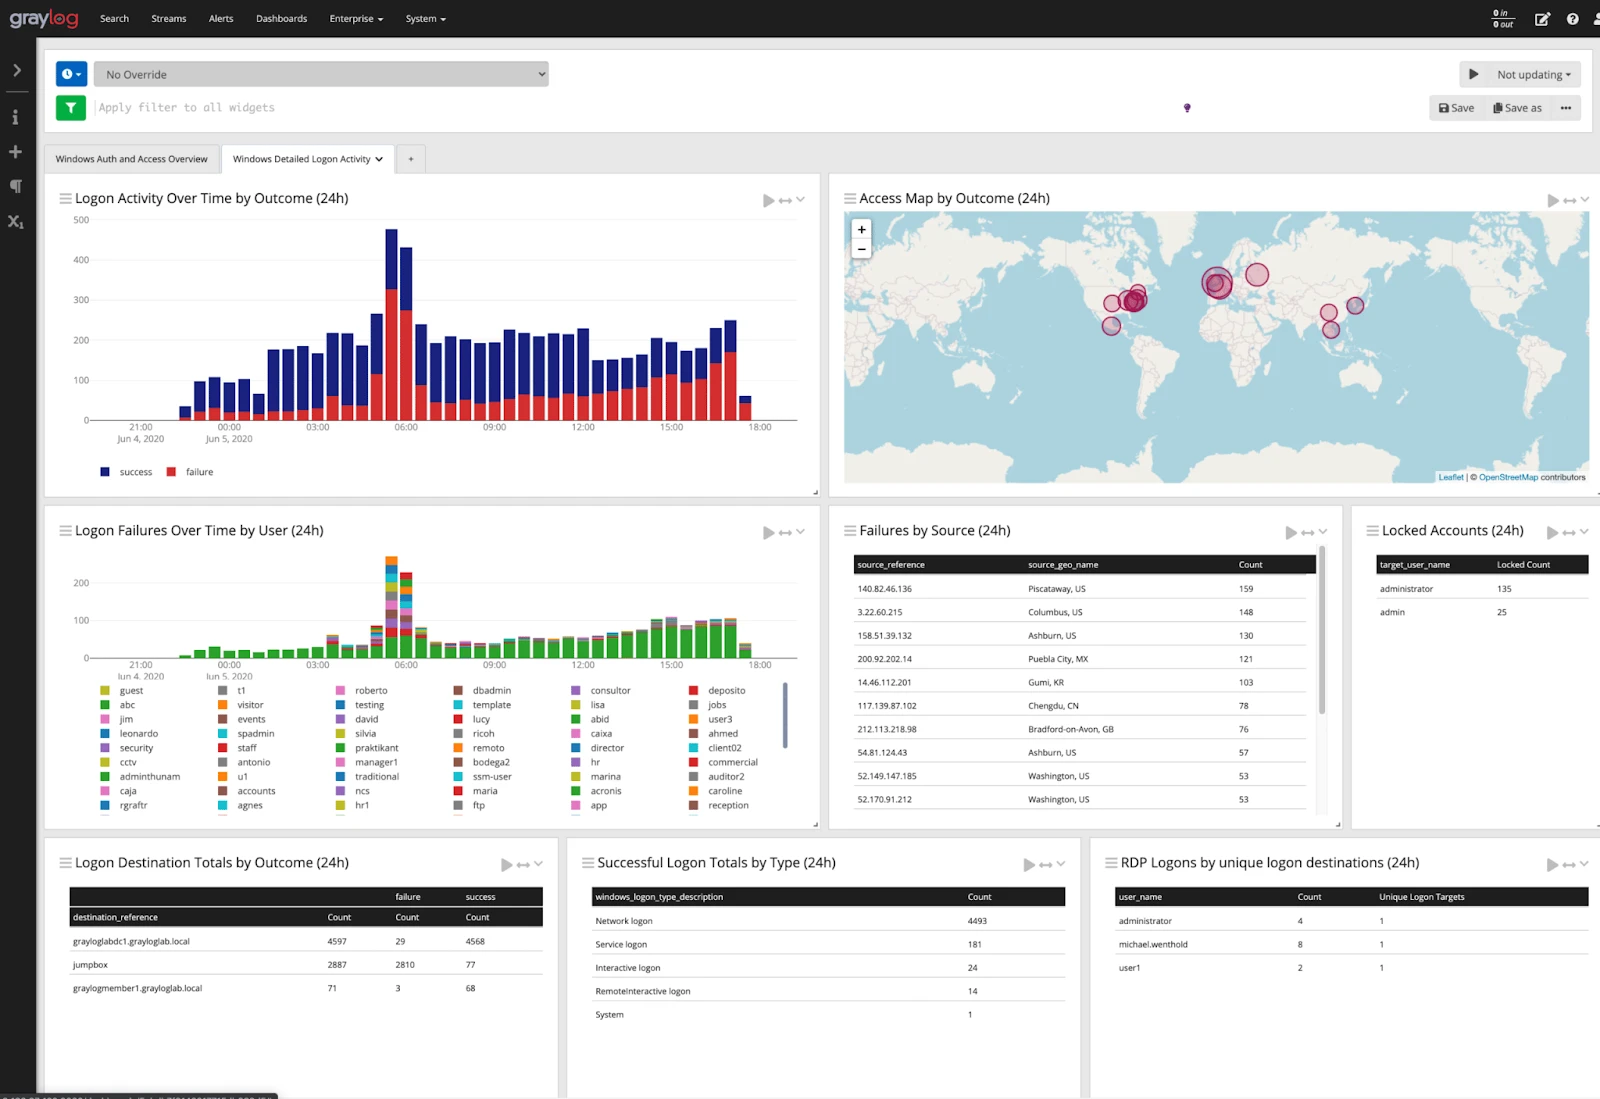
Graylog
Graylog is a log management platform with a source-available core (Graylog Open) and paid editions that extend into security operations. That distinction matters more than most vendor descriptions let on: Graylog Open gives you log collection, search, processing pipelines, dashboards, and stream-based alerting, which is enough for operational use cases. Sigma rules, MITRE ATT&CK alignment, UEBA, anomaly detection, and case management are paid Graylog Security and Enterprise features. If your primary use case is security operations rather than infrastructure monitoring, factor that into the cost calculation.
How Graylog works
Graylog receives log data over GELF (Graylog Extended Log Format), syslog, Beats, or HTTP inputs, stores it in Elasticsearch or OpenSearch (via the Graylog Data Node), and makes it searchable through a web interface. The stream system is central to how Graylog operates: incoming messages are routed to streams based on rules, and alerting, pipelines, and access controls all attach to streams rather than to the storage layer. This means you can have one stream for application errors routed to one team and a separate stream for authentication events routed to security, with different retention policies and permissions on each.
Processing pipelines let you parse, enrich, drop, or rewrite messages before storage. If your application logs arrive as unstructured text, you write a pipeline rule to extract fields into structured data. Graylog Illuminate (included with paid editions, available for Open with limitations) provides pre-built parsers and dashboards for common sources: Windows Event Logs, Cisco, Palo Alto, AWS CloudTrail, and others.
- Kafka broker minimum is 2.1. Any Kafka input connected to an older broker will fail after the upgrade.
- API tokens now expire after 30 days by default. Any automation, monitoring integration, or script that uses a long-lived API token will stop working unless you have a token rotation policy in place. This one tends to surface as a late-night incident when something stops reporting rather than during the upgrade itself.
Standout features:
- Stream-based routing and processing: The stream model lets you segment log data by source, application, or sensitivity level at ingestion time, then apply different pipelines, retention policies, and access controls per stream. This is more operationally flexible than Elasticsearch index-per-source patterns.
- Log extraction and parsing: Extractors pull specific fields from log messages at ingest. Processing pipelines handle more complex transformations, conditional logic, lookups, field renaming, and message dropping. Together they give you fine-grained control over what ends up in storage. Graylog Illuminate also shipped parser fixes in 7.0.3, including a correction to Apache HTTPD timestamp parsing that was producing incorrect time values.
- Search and investigation: Graylog’s search syntax is simpler than Lucene/KQL for basic queries, which matters when you need an on-call engineer to search logs at midnight without reference documentation. Saved searches, relative time ranges, and histogram overlays are all available without paid add-ons.
- User management with AD/LDAP integration: Active Directory and LDAP authentication are supported in Graylog Open. Role-based access controls let you restrict which streams and dashboards each team can see.
Where Graylog struggles
Graylog’s free tier has meaningful gaps if security operations is your use case: Sigma rule support, anomaly detection, and case management are all paid. The Elasticsearch/OpenSearch dependency adds operational complexity similar to the ELK Stack. At large scale, pipeline processing can create performance bottlenecks that require careful tuning of pipeline stage ordering and worker thread allocation.
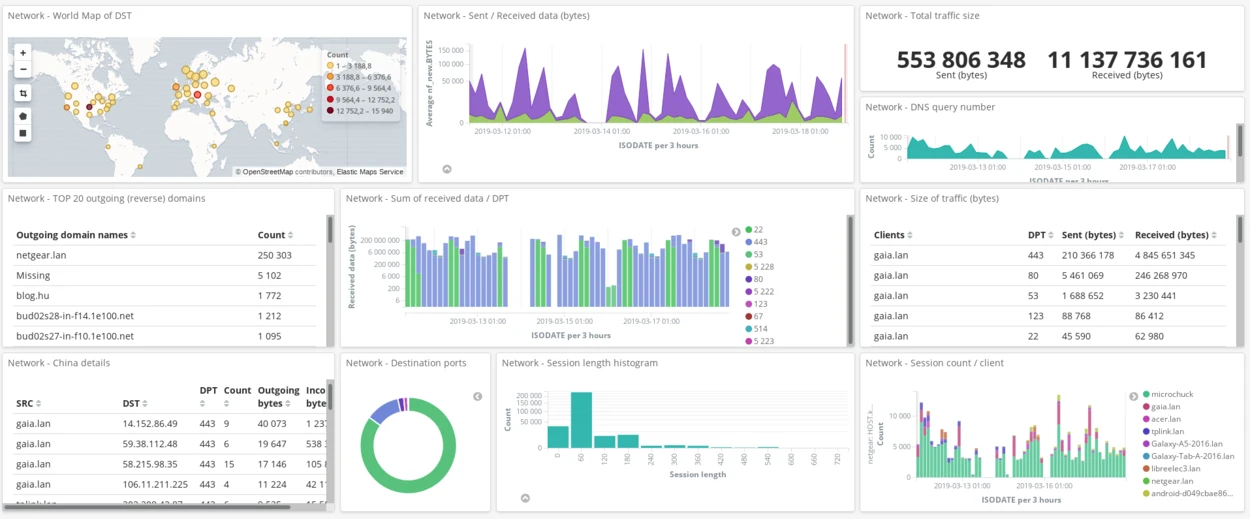
Elastic Stack (ELK Stack) – Logstash
Elastic Stack is a set of open-source products; its core components are Elasticsearch, Kibana, and Logstash.
How ELK log analysis works
Logstash is a server-side data processing pipeline. It receives log data from inputs (files, Beats, syslog, Kafka, HTTP, and dozens of others), applies filter plugins to parse and enrich the data, and routes the output to one or more destinations. Most deployments send output to Elasticsearch, but Logstash can simultaneously write to S3, a SIEM, a message queue, or another Elasticsearch cluster.
Elasticsearch stores the processed log data and makes it searchable using an inverted index. It is the reason ELK scales to petabytes while still returning sub-second search results on targeted queries but that performance comes from the index structure, which means write-heavy workloads require careful index lifecycle management. Kibana sits on top of Elasticsearch and provides the visual layer: dashboards, the Discover view for ad-hoc log search, Canvas for custom reports, and Lens for drag-and-drop visualizations.
- Full-text search at scale: Elasticsearch’s inverted index architecture supports sub-second search across billions of log entries. KQL (Kibana Query Language) and ES|QL (the newer pipe-based query language in 9.x) give analysts two different query interfaces depending on how they prefer to work. For complex log investigations across large datasets, nothing in the open-source space matches ELK’s search depth.
- Multi-source ingestion and filtering: Logstash has around 200 input plugins and 200 filter plugins. The grok filter handles unstructured text using named capture patterns; the json filter handles structured JSON logs; the csv filter handles tabular data. Multiple filter stages run in sequence, so you can parse a raw syslog line, extract fields, look up an IP against a GeoIP database, and drop debug-level messages before the event reaches Elasticsearch all in a single pipeline.
- Machine learning anomaly detection: Kibana’s ML features (paid) identify unusual patterns in log data without requiring you to define thresholds. Useful for detecting slow-burn attacks or gradual performance degradation that fixed-threshold alerts miss.
- Kibana dashboards: Kibana’s visualization options are extensive: time series, maps, heat maps, data tables, gauges, and more. Saved searches and index patterns mean analysts can share investigation contexts across teams.
- Extensible output routing: A single Logstash pipeline can write to Elasticsearch, an S3 bucket, a second Elasticsearch cluster for disaster recovery, and a Kafka topic for downstream processing simultaneously.
Where ELK struggles
The operational overhead is real. Elasticsearch clusters require memory planning (the JVM heap needs careful sizing), shard management (too many small shards or too few large ones both hurt performance), and index lifecycle policy configuration to control retention costs.
Most teams that run ELK at scale end up with a dedicated platform engineer whose primary responsibility is Elasticsearch. The license situation is also worth understanding: the Elastic Stack components are under the Elastic License 2.0, not OSI-approved open source. Self-hosted use is free, but offering Elasticsearch as a managed service to third parties is not permitted under the free tier.
Fluentd
Fluentd is an open-source data collector under the Apache License 2.0, designed to unify log ingestion and routing across heterogeneous infrastructure. The core job is straightforward: accept log events from sources, apply optional processing, and route them to destinations. Fluentd does not store or analyze logs itself; it is a collector and router, not a log analysis platform3
That distinction matters when evaluating it against Wazuh or Graylog. Fluentd is typically the first layer in a larger pipeline. A common architecture: Fluentd agents on each server collect application logs, system logs, and container logs, buffer them locally (so nothing is lost if the downstream destination is temporarily unavailable), apply parsing and filtering, and forward the result to Elasticsearch, Splunk, a cloud SIEM, or another storage backend. The analysis happens in whatever receives the data.
Fluentd vs. Fluent Bit
Teams evaluating Fluentd for Kubernetes environments often end up choosing Fluent Bit instead, and it is worth understanding why. Fluent Bit is a lightweight forwarder in the same CNCF ecosystem, roughly a 4 MB binary versus Fluentd’s Ruby-based process that runs notably heavier. For Kubernetes deployments where you want a log collector running as a DaemonSet on every node, the resource footprint difference is significant at scale. Fluent Bit also supports multiline log parsing, dynamic metadata injection from Kubernetes pod labels and annotations, and built-in backpressure handling to prevent data loss when downstream destinations slow down.
Fluentd is the better fit when you need the full 500+ plugin ecosystem or complex routing logic that Fluent Bit’s smaller plugin library cannot cover. For most Kubernetes-native deployments doing straightforward log shipping, Fluent Bit is the practical choice. The projects share configuration concepts, so switching between them is not a full rewrite.
How Fluentd handles log data
Fluentd models log data as a stream of tagged events. Each event has a tag (a dot-separated string like app.web or system.syslog), a timestamp, and a record. Tags drive routing: match directives in the configuration specify which tags get sent where, which filters apply, and in what order. Multiple outputs can match the same tag, so you can send the same events to both Elasticsearch and an S3 archive simultaneously.
The buffer system is what makes Fluentd reliable in production. Rather than writing directly to the destination, events accumulate in a buffer and are flushed in chunks at configurable intervals or when the buffer reaches a size threshold. If the destination is unreachable, events stay in the buffer and are retried with exponential backoff.
Standout features:
- 500+ community plugins: Covers integrations with most major log destinations and data sources without custom development.
- Flexible data routing: Events can be routed to multiple simultaneous destinations, such as files, RDBMS, NoSQL, IaaS, SaaS, and Hadoop, based on tag-based routing rules.
- Log processing focus: Fluentd is optimized for log processing and forwarding at scale, making it well-suited as a collection and routing layer in front of Elasticsearch or other storage backends rather than as a standalone analysis platform.
Syslog-ng
Syslog-ng is an open-source log management program that collects, classifies, transforms, and routes log data from multiple sources to storage or downstream platforms. Its distinguishing capability is structured processing: logs can be normalized into a consistent format before being forwarded to systems such as Apache Kafka or Elasticsearch.
Capabilities:
- Classify and structure logs using built-in parsers like csv-parser
- Store logs in files, message queues (AMQP), or databases (PostgreSQL, MongoDB)
- Forward to big data platforms, including Elasticsearch, Apache Kafka, or Hadoop
Distinct features:
- Automated log archiving: Syslog-ng handles log rotation and archiving natively, including compression and timestamped file naming. For environments with retention compliance requirements, this reduces the need for external tools like logrotate layered on top.
- Multiple message format support: RFC3164 (traditional syslog), RFC5424 (structured syslog), JSON, and key-value formats are all parsed natively. Syslog-ng can receive an RFC3164 message and output it as RFC5424 with added structured data fields, which is useful when feeding into systems that expect modern syslog format.
- Encrypted transport: TLS-encrypted syslog transport is supported natively for both receiving and forwarding. This matters in environments where log data transits untrusted network segments.
- Conditional routing: Filter expressions let you route based on any parsed field severity, facility, host, or custom fields extracted by parsers. A single syslog-ng instance can route authentication failures to a security team’s stream, application errors to the development team’s stream, and debug messages to /dev/null.
Where syslog-ng fits (and where it doesn’t)
Syslog-ng is the right choice when your log sources are primarily network devices and servers speaking syslog, and when you need reliable, high-throughput collection with structured field extraction before forwarding to a storage backend. It is not a log analysis platform; there is no query interface, no dashboards, and no alerting built in. It works as the collection and routing layer in front of Elasticsearch or Graylog, not as a standalone tool.
Nagios
A necessary clarification before going further: Nagios Core is the GPL-licensed open-source monitoring project, and it focuses on host, service, and network monitoring rather than log analysis.[15] The product described here is Nagios Log Server, a separate commercial product from Nagios Enterprises. If you are looking specifically for an open-source, no-cost log analysis tool, Nagios Log Server is not it. What it offers is a commercially supported log management platform from a vendor with a long track record in infrastructure monitoring.
Nagios Log Server collects log data in real time and feeds it to a search interface. It is compatible with Windows, Linux, and Unix servers and includes a setup wizard for integrating new endpoints or applications.4
Standout features:
- Network service monitoring: Covers SMTP, POP3, HTTP, PING, and other network services with a focus on infrastructure health.
- Host resource monitoring: Tracks processor load, disk utilization, and system health across monitored hosts.
- Log file rotation and archiving: Automated rotation and long-term archiving without manual intervention.
- Geographic log filtering: Filters log data by geographic origin and generates traffic-flow maps.
- Web interface: Optional interface for viewing current network status and log files.
For guidance on choosing the right tool or service, check out our data-driven sources: log analysis software.
FAQs
Open-source log analysis tools enable users to collect, process, store, search, and analyze log data from various sources, such as servers, applications, and network devices. These tools can help SecOps, ITOps, and DevOps to:
-Perform system troubleshooting by monitoring transaction log files.
-Leverage security incident response and investigation to maintain optimal database performance or execute user and entity behavior analytics (UEBA).
-Maintain compliance with audits, legislation, and special security rules (GDPR).
Cite this research
Pick the format that matches where you're publishing. Pasting the link version into your CMS preserves the backlink.
@misc{hafa2026,
  author = {Hafa, Adil and Sezer, Sena},
  title  = {{Top 6 Open-Source Log Analysis Tools: Wazuh, Graylog & More}},
  year   = {2026},
  month  = jun,
  howpublished    = {\url{https://aimultiple.com/open-source-log-analysis-tools}},
  note   = {AIMultiple. Retrieved June 23, 2026}
}


Be the first to comment
Your email address will not be published. All fields are required. Comments are left in their original language.