


Top 8 Observability Software with Pricing Including SolarWinds

Observability platforms promise complete visibility across distributed systems, but selecting the right one is hard when every vendor claims they do everything.
We analyzed the top 8 observability software products by reviewing their documented capabilities, public pricing, verified customer reviews, and enterprise reference cases. See the graph to learn each vendor’s search market share:
Observability software review, pricing, and feature coverage
* Ratings are based on Capterra, Gartner, and G2. Vendors are listed by rating, with our subscribers at the top.
** The number of covered features is calculated as the total number of differentiating features and shared features for each tool.
*** Workforce numbers are gathered from the companies’ LinkedIn pages.
Differentiating features of observability software
Top 8 observability software detailed analysis
1. SolarWinds Observability
SolarWinds Observability is a hybrid infrastructure monitoring platform available as both SaaS and self-hosted deployments, providing network flow analysis and database performance insights across on-premise and cloud environments.
- NetFlow traffic analysis monitors network bandwidth usage and traffic patterns between services at the network protocol level
- Hybrid infrastructure monitoring provides visibility across on-premise data centers and cloud environments including AWS, Azure, and Google Cloud Platform
- Database performance monitoring includes query-level insights for SQL Server, Oracle, MySQL, PostgreSQL, and cloud database services
- Pre-configured monitoring templates reduce setup time for common infrastructure components and application architectures
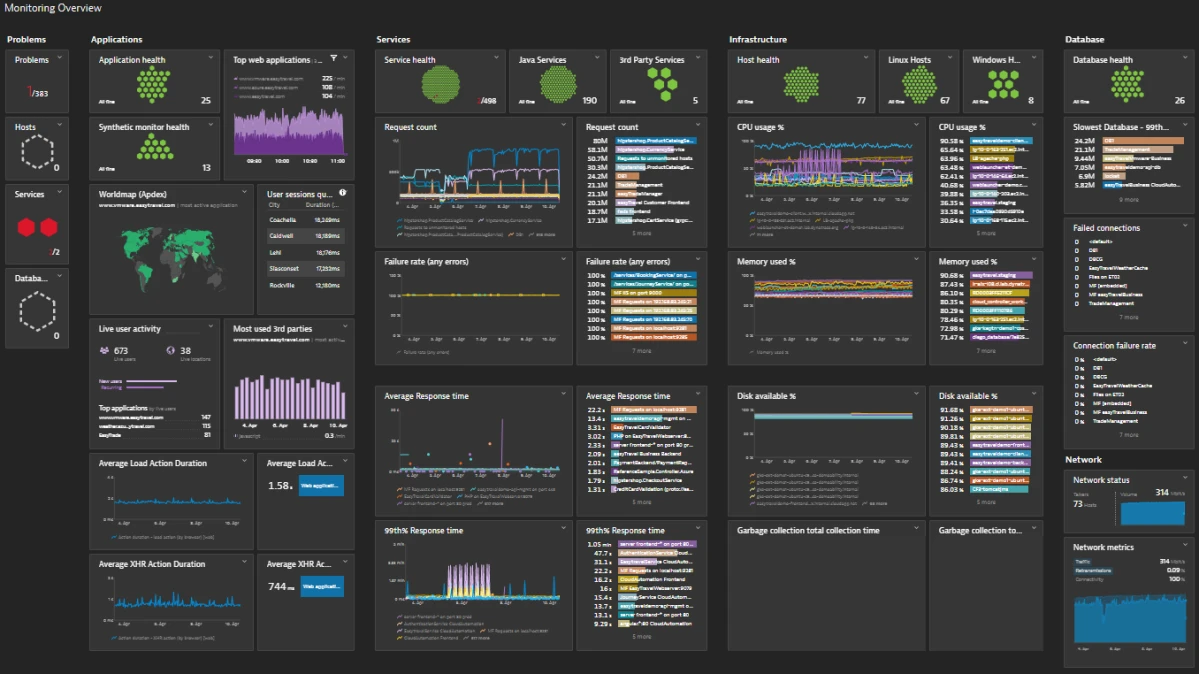
2. Dynatrace
Dynatrace is an automated observability software that uses Davis AI to map service dependencies and identify root causes without manual configuration.1
- Automatic dependency mapping discovers service relationships and infrastructure topology without configuration requirements
- Davis AI analyzes causation patterns across metrics and traces to identify root causes of performance degradations
- Cloud Security Posture Management (CSPM) identifies misconfigurations and compliance violations across multi-cloud environments
- Live Debugger provides real-time code-level diagnostics, including variable values and method execution paths in production
3. Datadog
Datadog is an observability software that integrates security monitoring, cloud cost tracking, and application performance data in a single interface.2
- Security monitoring analyzes observability telemetry to identify threats, vulnerabilities, and attack patterns in real-time3
- Real user monitoring captures frontend performance metrics across web browsers and mobile applications
- Cloud cost monitoring tracks infrastructure spending across providers with correlation to performance metrics for optimization analysis
- Workflow automation executes remediation actions automatically based on alert conditions and predefined playbooks
4. New Relic
New Relic is an AI-powered observability platform that scans applications for vulnerabilities and integrates observability data directly into developer workflows.
- Vulnerability management scans application dependencies and runtime environments for security issues within the observability software
- Applied Intelligence uses machine learning to detect anomalies, group related incidents, and reduce alert noise
- Agentic AI integrations connect observability data with ServiceNow, GitHub Copilot, and Amazon Q Business for automated task management
- Business observability correlates technical performance with revenue metrics and user engagement data
5. Better Stack
Better Stack is a unified observability tool best for small to medium teams wanting unified observability and incident response without managing multiple specialized tools
- Incident management combines alerting with on-call scheduling, escalation workflows, and post-incident analysis in a unified interface
- On-call scheduling automates rotation management with mobile applications for incident response
- Status pages generate public uptime reporting directly from observability data without requiring separate status page services
- Screenshot capture automatically records browser state when frontend errors occur for visual debugging context
6. Zabbix
Zabbix is an enterprise monitoring platform designed for organizations seeking a free, open-source monitoring solution with strong alerting and customization capabilities across hybrid IT environments.4
- Monitoring coverage for networks, servers, applications, databases, containers, and cloud services.
- Flexible data collection methods, including SNMP, IPMI, JMX, HTTP checks, and custom scripts for agent-based or agentless monitoring.
- Advanced alerting system with customizable triggers, escalation rules, and integrations with messaging tools like Slack, Telegram, and email.
- Built-in visualization tools such as dashboards, graphs, and network maps for real-time insight into system health.
7. Elastic Observability
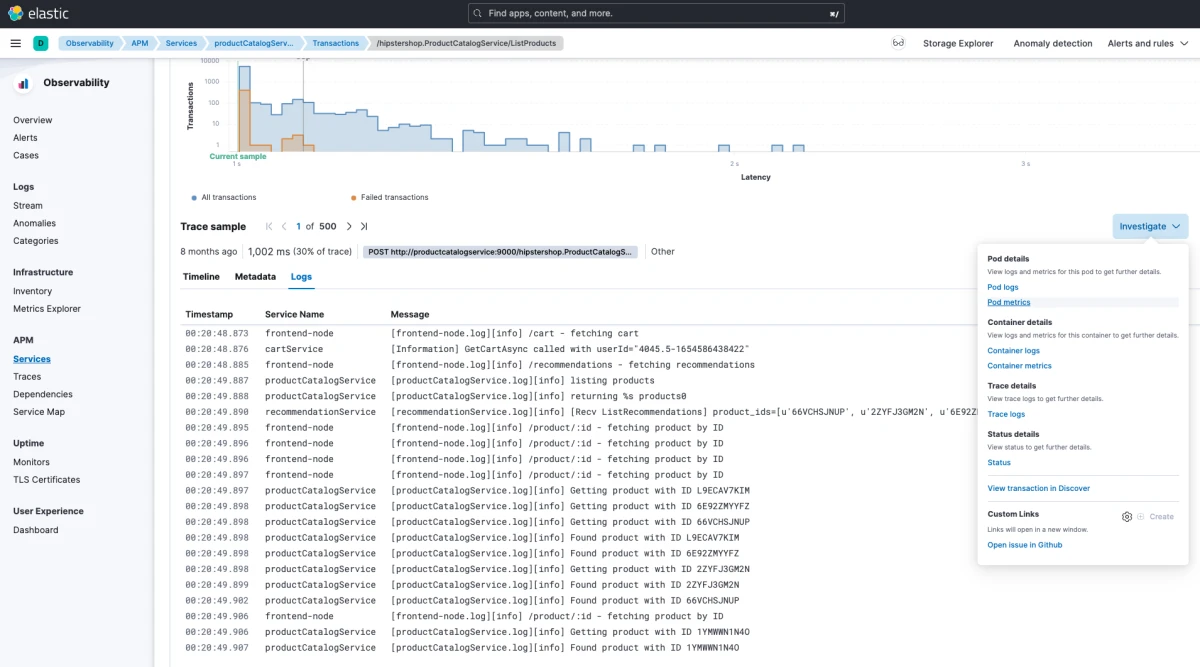
Elastic Observability is a unified search platform that allows teams to query logs, metrics, and traces together with self-hosted deployment options for regulated industries. Organizations with data sovereignty requirements or teams already using Elasticsearch for other applications would benefit from Elastic Observability.
Key Capabilities:
- Unified search applies Elasticsearch query language across logs, metrics, and traces in a single interface
- Machine learning detects anomalies in time-series data and generates forecasts based on historical patterns
- SIEM capabilities analyze security events alongside application performance data within the same platform
- Self-managed deployment provides control over data storage location and retention policies for regulated industries
8. Splunk Observability
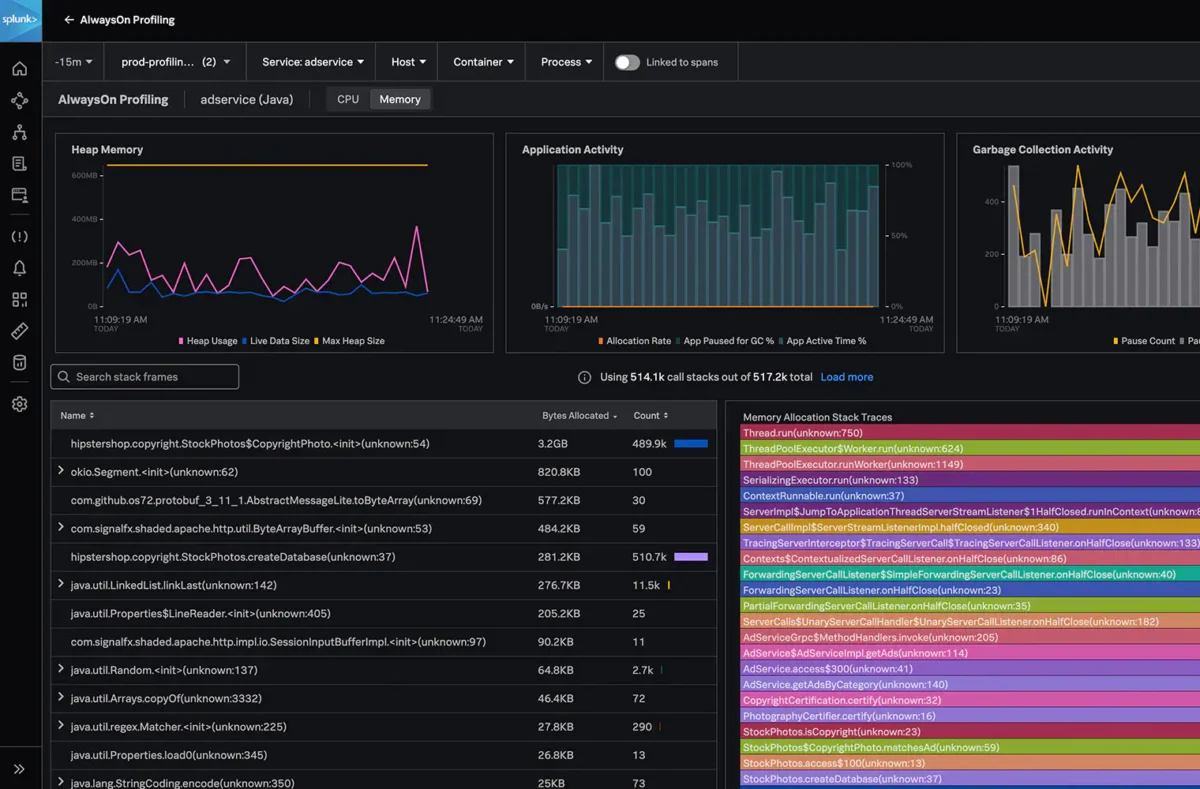
Splunk Observability is the best fit for enterprises with high transaction volumes that require complete trace capture for performance analysis.
- No-sample tracing captures every transaction instead of sampling subsets for complete visibility into rare performance issues
- Service Bureau enables multi-tenant deployments where different business units maintain isolated observability environments
- Real-time streaming processes telemetry immediately without batch indexing delays common in log-centric platforms
- Business workflows map technical services to business processes for impact analysis during outages
Shared features of observability software
All platforms provide these core observability capabilities.
- Log aggregation: Centralized collection and search across application and infrastructure logs
- Metrics collection: Time-series data gathering for system and application performance
- Distributed tracing: Request tracking across microservices architectures
- Alerting: Threshold- and anomaly-based notification systems
- Dashboards: Customizable visualization interfaces for observability data
- API access: Programmatic interfaces for data retrieval and configuration
- Multi-cloud support: Monitoring across AWS, Azure, and Google Cloud Platform
- Kubernetes monitoring: Native support for containerized workload observability
- Data retention: Configurable storage periods for historical analysis
- Role-based access control: Granular permissions management for teams
- Third-party integrations: Connections to development and operations tools
How to Choose Observability Software?
Infrastructure architecture: Hybrid environments with on-premise and cloud resources benefit from platforms supporting network flow analysis. Cloud-native applications on Kubernetes work well with platforms offering container-native monitoring and OpenTelemetry support.
Team size and structure: Smaller teams often prefer unified platforms combining observability with incident management to reduce tool sprawl. Larger organizations may integrate specialized tools for different functions across multiple teams.
Existing technology stack: Organizations using Elasticsearch, Prometheus, or specific cloud providers should evaluate platforms with strong integrations for their existing infrastructure. Migration costs and learning curves matter for established environments.
Budget and pricing model: Consumption-based pricing scales with usage but can be unpredictable during traffic spikes. Per-host or per-user models provide more predictable costs but may be expensive for dynamic infrastructure with frequent autoscaling.
Compliance requirements: Regulated industries with data sovereignty requirements should prioritize platforms offering self-managed deployment options or region-specific data storage to meet regulatory standards.
Security integration needs: Teams managing security and operations together benefit from platforms integrating vulnerability detection and threat monitoring with performance observability data in unified workflows.
 Add as preferred source
FAQs
Monitoring tracks predefined metrics and alerts when thresholds are exceeded, answering “is the system working?” Observability provides deeper context by correlating logs, metrics, and traces to answer “why is the system behaving this way?” Observability platforms let teams explore unknown issues without predefined dashboards.
Essential features include distributed tracing for microservices, centralized log management, metrics collection, customizable dashboards, and intelligent alerting. Advanced capabilities to consider include AIOps for anomaly detection, automatic service dependency mapping, OpenTelemetry support for vendor-neutral data collection, and integration with incident management tools.
Cite this research
Pick the format that matches where you're publishing. Pasting the link version into your CMS preserves the backlink.
@misc{dilmegani2026,
  author = {Dilmegani, Cem and Ermut, Sıla},
  title  = {{Top 8 Observability Software with Pricing Including SolarWinds}},
  year   = {2026},
  month  = sep,
  howpublished    = {\url{https://aimultiple.com/observability-software}},
  note   = {AIMultiple. Retrieved September 21, 2026}
}Results and timestamps of 16 data points. Download the summary data shown in this article's charts and tables as a ZIP file containing 2 CSV files.
Want the granular data behind it? Join Premium
Changelog
2 updatesAdded a search share section comparing Datadog, Zabbix, New Relic, Dynatrace, Splunk, Elastic, and SolarWinds.
Reference Links
Cem's work at AIMultiple has been cited by leading global publications including Business Insider, Forbes, Morning Brew, and Washington Post, global firms like Deloitte and HPE, NGOs like World Economic Forum, and supranational organizations like European Commission. [1], [2], [3], [4], [5]
Throughout his career, Cem served as a tech consultant, tech buyer and tech entrepreneur. He advised enterprises on their technology decisions at McKinsey & Company and Altman Solon for more than a decade. He also published a McKinsey report on digitalization.
He led technology strategy and procurement of a telco while reporting to the CEO. He has also led commercial growth of deep tech company Hypatos that reached a 7 digit annual recurring revenue and a 9 digit valuation from 0 within 2 years. Cem's work in Hypatos was covered by leading technology publications like TechCrunch and Business Insider.
Cem regularly speaks at international technology conferences. He graduated from Bogazici University as a computer engineer and holds an MBA from Columbia Business School.

She previously worked as a recruiter in project management and consulting firms. Sıla holds a Master of Science degree in Social Psychology and a Bachelor of Arts degree in International Relations.






Be the first to comment
Your email address will not be published. All fields are required. Comments are left in their original language.