


Top 8 Network Monitoring Software

We compared the top 8 network monitoring tools for their performance, ease of setup, and real-world usability.
Top 8 network monitoring software compared
The table is sorted based on the number of reviews. We list our subscribers at the top.
Vendor selection criteria: We narrowed down our network monitoring software comparison using three main factors:
- Company stability: Vendors with 15+ employees
- User validation: Solutions with user reviews from G2, Capterra, TrustRadius
- Performance standards: Minimum 4.4/5 average rating across review platforms
- Market presence: Active development and regular feature updates
The core features of network monitoring software
For definitions of the features mentioned above, refer to the shared features of network monitoring tools.
Detailed analysis of network monitoring software
NinjaOne
NinjaOne combines network monitoring with remote management tools. Users can monitor performance, patch systems, and manage backups from one place.
NinjaOne’s network monitoring is an SNMP-based module built into the same console as its RMM and patch tools. A discovery wizard scans a given IP range and auto-identifies SNMP-enabled routers, switches, firewalls, and printers. Then, it polls them for uptime, CPU and memory load, bandwidth throughput, and interface errors in real time, with more than 50 prebuilt OID templates for common hardware and support for custom OIDs.
NetFlow and syslog data land in the same dashboard, so a bandwidth spike and a device throwing errors show up next to each other instead of in separate tools.
The tradeoff for buyers evaluating dedicated network monitoring platforms: coverage depends entirely on SNMP support, quality varies by device vendor, and NinjaOne itself recommends verifying compatibility before relying on it for niche hardware.
SolarWinds NPM
SolarWinds Network Performance Monitor (NPM) uses SNMP monitoring, automatic discovery, and packet analysis to track network health.
- Orion Maps: Dynamic network maps display devices, connections, and performance metrics in real-time. The visualization updates automatically.
- Layer 2 and 3 mapping: Shows both physical connections and logical network relationships. You can troubleshoot at whatever level the problem exists.
- NetPath: This unique feature traces the exact path packets take across on-premises, hybrid, and cloud networks. You can see hop-by-hop performance and identify where delays occur.
- Auto-discovery with alerts: Uses SNMP, WMI, and ICMP to find devices automatically, then monitors them for issues. Alerts trigger when thresholds are breached.
Atera
Atera targets MSPs and IT departments that need monitoring, ticketing, and automation in one platform. Handles both network monitoring and service desk functions.
- Continuous discovery: Scans domains and subdomains constantly, updating device lists as your network evolves. You don’t need to manually trigger scans when you add equipment.
- Security scanning: Identifies open ports, missing patches, and outdated antivirus automatically. This gives you a security checklist without running separate vulnerability scanners.
- Active Directory integration: Monitors AD-connected devices and generates reports on OS versions, device health, and user connections.
- Visual reporting: After each scan, you get graphs showing device types, operating systems, and health status across the network.
Datadog
Datadog monitors cloud-native applications by collecting data from servers, containers, databases, and services. Designed for teams running distributed systems across multiple cloud providers.
- Live network topology: Interactive maps show your entire infrastructure automatically. Spot bottlenecks, trace dependencies, and identify network partitions visually.
- Layer 3 traffic monitoring: Captures network flows between hosts, containers, VMs, and serverless functions. You see exactly how data moves through your infrastructure.
- Tag-based filtering: Instead of tracking individual IP addresses, you group traffic by service, role, region, or any other tag. This makes it easier to monitor dynamic cloud environments where IPs change constantly.
- Unified monitoring: Network, application, and infrastructure metrics live in the same platform. You can correlate issues across the stack without switching tools.
LogicMonitor
LogicMonitor provides cloud-based network monitoring for enterprise, hybrid, and distributed IT environments.
- Automatic device discovery: Scans IP ranges on a schedule to find routers, switches, firewalls, and other network devices. LogicMonitor can then automatically apply monitoring templates, while SNMP Active Discovery detects individual components such as interfaces and storage resources.
- SNMP and real-time monitoring: Collects CPU, bandwidth, latency, interface status, and other performance metrics using SNMP, WMI, and APIs, with polling intervals as frequent as 30 seconds.
- Topology mapping: Builds dynamic Layer 3 topology maps showing relationships and dependencies between network resources.
- Traffic analysis and intelligent alerts: Uses flow data to break down traffic by source, destination, application, and protocol.
Auvik
Auvik runs entirely in the cloud and focuses on multi-site network monitoring. It automatically maps your network topology and keeps those maps current as your infrastructure changes.
- Zero-touch discovery: Deploy the collector, and Auvik finds everything using SNMP, CDP, and LLDP. Network maps appear automatically – no manual diagramming.
- Multi-layer visibility: See both physical connections (Layer 1) and logical relationships (Layers 2/3). This helps when troubleshooting, as you can trace problems through the entire stack.
- Customizable views: Filter out irrelevant devices to focus on specific network segments. Toggle between VLAN topology, clustered views, or other perspectives.
- Export-ready documentation: Generate PDF or SVG maps for documentation or client reports.
Paessler PRTG Network Monitor
Paessler PRTG Network Monitor monitors your entire IT infrastructure from one dashboard. It tracks servers, switches, cloud services, and bandwidth at the same time.
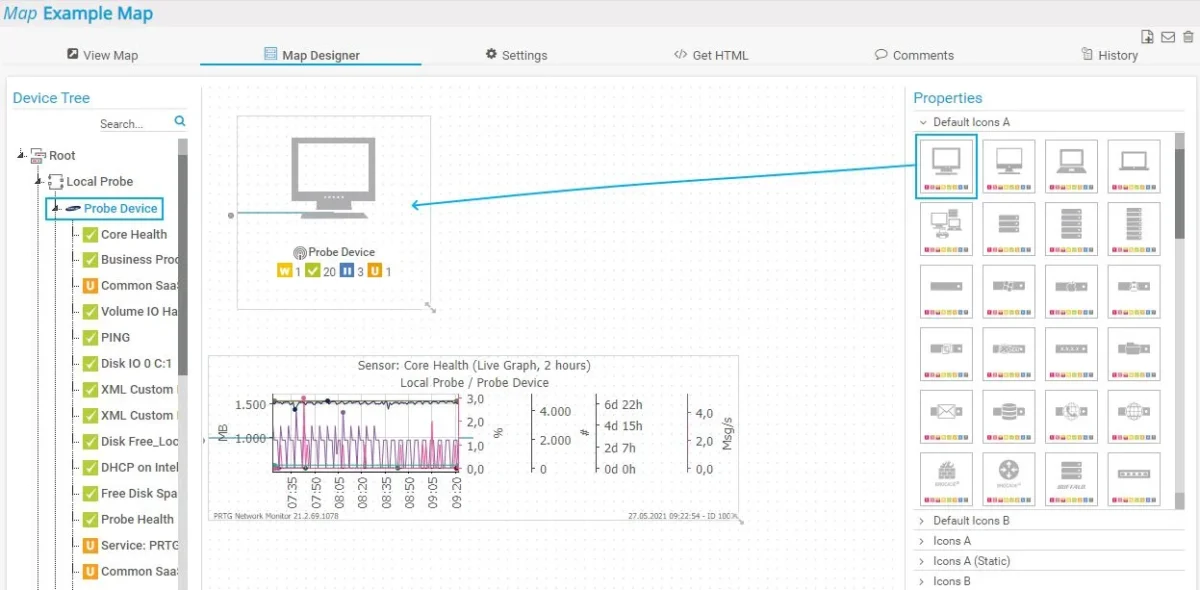
- Visual mapping: Drag devices onto the map and see their status change in real-time.
- Monitors anything with sensors: Over 250 pre-built sensors for different devices and protocols. SNMP, NetFlow, WMI, plus custom options if you need something specific.
- Cloud-native monitoring: Direct connections to AWS, Azure, and Google Cloud.
- Security built in: Scans for vulnerabilities and suspicious activity as part of normal monitoring. Spots intrusion attempts without adding another security tool.
Site24x7 (ManageEngine)
Site24x7 monitors websites, servers, applications, and network infrastructure from the cloud. Focuses on uptime and performance across your entire IT stack.
- Automatic discovery: Scans IP ranges using SNMP to find devices automatically. The network map updates in real-time as you add or remove equipment.
- Layer 2 and topology mapping: Layer 2 maps show device connections and interfaces, helping you spot unauthorized devices. Topology maps provide a hierarchical view of device relationships.
- Dependency visualization: Shows how devices depend on each other. When you plan changes, you can see which systems might be affected before you start.
Shared features of network monitoring tools
 Add as preferred source
Cite this research
Pick the format that matches where you're publishing. Pasting the link version into your CMS preserves the backlink.
@misc{dilmegani2026,
  author = {Dilmegani, Cem and Ermut, Sıla},
  title  = {{Top 8 Network Monitoring Software}},
  year   = {2026},
  month  = sep,
  howpublished    = {\url{https://aimultiple.com/network-monitoring-software}},
  note   = {AIMultiple. Retrieved September 22, 2026}
}Results and timestamps of 22 data points. Download the summary data shown in this article's charts and tables as a ZIP file containing 3 CSV files.
Want the granular data behind it? Join Premium
Changelog
12 updatesAdded SNMP-based network monitoring details to the NinjaOne section.
Removed Pros and Cons from the Paessler PRTG Network Monitor section.
Cem's work at AIMultiple has been cited by leading global publications including Business Insider, Forbes, Morning Brew, and Washington Post, global firms like Deloitte and HPE, NGOs like World Economic Forum, and supranational organizations like European Commission. [1], [2], [3], [4], [5]
Throughout his career, Cem served as a tech consultant, tech buyer and tech entrepreneur. He advised enterprises on their technology decisions at McKinsey & Company and Altman Solon for more than a decade. He also published a McKinsey report on digitalization.
He led technology strategy and procurement of a telco while reporting to the CEO. He has also led commercial growth of deep tech company Hypatos that reached a 7 digit annual recurring revenue and a 9 digit valuation from 0 within 2 years. Cem's work in Hypatos was covered by leading technology publications like TechCrunch and Business Insider.
Cem regularly speaks at international technology conferences. He graduated from Bogazici University as a computer engineer and holds an MBA from Columbia Business School.

She previously worked as a recruiter in project management and consulting firms. Sıla holds a Master of Science degree in Social Psychology and a Bachelor of Arts degree in International Relations.






Be the first to comment
Your email address will not be published. All fields are required. Comments are left in their original language.