Top 12 RMM Software Tested: Features and Pricing
We benchmarked the top 3 RMM platforms (NinjaOne, ManageEngine, and Acronis) by deploying them to seven servers across six AWS regions. We analyzed how they handle agent deployment and monitoring from scratch.
RMM benchmark summary
Dashboard & Monitoring
- NinjaOne monitoring started automatically, with real-time metrics displayed in a full-page layout. Unique features included open ports with process names and clear OS-specific icons for instant identification.
- ManageEngine matched metric visibility but split service controls between the System tab (read-only) and the System Manager (full power). Offered standalone chat with file attachments which works without active remote sessions.
- Acronis requires a manual monitoring plan application before displaying any metrics, with a compressed right-panel layout. Provided built-in software library, actionable security alerts, GPS tracking, and integrated backup/disaster recovery.
Critical Gaps
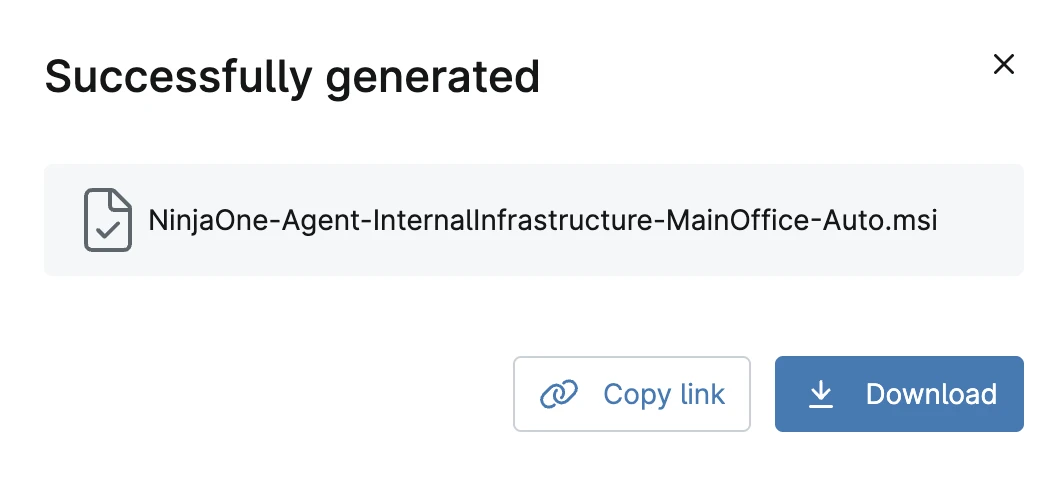
- Installation Feedback: All platforms failed here. NinjaOne and ManageEngine provided no completion confirmation, necessitating dashboard checks to verify success.
- Linux Deployment: Acronis Linux installation requires a manual dependency confirmation step and browser-based registration per device. Total install time was approximately 4 minutes.
- Network Security: Only NinjaOne displayed open ports with associated process names, a security feature absent from both competitors.
Agent Deployment
- NinjaOne: Sub-2-second installation on Windows and Linux with copyable URLs and pre-authorized tokens. Didn’t require any manual steps.
- ManageEngine: 20-second Windows install with CAPTCHA and wizard clicks. Linux execution took 5 seconds, but session-locked URLs required manual SCP transfers, adding 5-10 minutes per server.
- Acronis: Agent download speeds depend on geographic proximity to Acronis CDN servers. In our Mumbai region test, the 588MB macOS installer took 45 minutes to download due to limited CDN coverage in the region. The Mumbai region showed consistently slow download speeds across all agent installations, regardless of vendor. This reflects limited CDN coverage in the region rather than a vendor-specific issue. Windows and Linux installations in other regions (Ireland, Ohio, Seoul, São Paulo, California, Canada) were completed without CDN-related delays.
See the detailed results of my remote monitoring and management benchmark.
Prices
* We selected the most economical tier that provided all the core capabilities of an RMM. For ManageEngine Endpoint Central, the price is annual-based and costs $1,195.
For more: RMM pricing.
If you are looking to avoid license fees, Open source remote monitoring and management.
Search market shares
Search market shares reflect how frequently users search for these brands on Google:
User reviews & company size
*Based on the total number of reviews and average ratings (on a 5-point scale) from leading software review platforms.
Top 12 RMM software analyzed
Pros and cons are based on B2B user reviews from platforms like Capterra, Gartner, G2, and TrustRadius. Points highlighted in user reviews are included below only if several users bring up the same issue.
1. NinjaOne RMM
NinjaOne is a cloud-based remote monitoring and management platform designed for IT teams and managed service providers (MSPs). The platform combines endpoint management, security monitoring, remote access, and automated patch management into a unified interface.
Our benchmark testing revealed NinjaOne delivered the fastest agent deployment among competitors, with installation completing in under 2 seconds on Windows and Linux systems. The platform automatically begins monitoring immediately after agent registration, eliminating manual configuration steps.
Pros
- Onboarding: Users like easy onboarding and navigation.
- Remote Management Tools: Browser-based terminal access (with 2FA), complete file browser, process manager, service control, and Windows registry editor, all accessible without RDP or SSH connections.
- Unique Feature: Open ports visibility displays every listening port with associated process names, a security feature absent from competitors tested.
- Activity Logging: Tracks 1,000+ event types with granular filtering by user, date range, and action type.
Cons
- Installation Feedback: Windows and Linux installers provide no completion notification. Users must check the dashboard manually to confirm successful installation.
Choose NinjaOne RMM to monitor, patch, and manage endpoints remotely.
2. Acronis
Acronis Cyber Protect Cloud provides RMM capabilities alongside its core backup and disaster recovery features. We signed up and began the agent deployment process.
Pros
- Standalone Chat: Chat works without an active remote control session. Messages appear instantly as system notifications on the target device. This is a meaningful advantage over NinjaOne, where chat is only accessible inside an active remote session.
- Web Client: Acronis operates entirely through a web client, which allows administrators to manage devices from any browser without installing a dedicated desktop application. However, the panel-based layout for device details feels compressed compared to full-page device views in desktop RMM clients, and some features require additional plan configuration before they become accessible.
- Built-in Software Library: A full catalog of pre-packaged applications with version, language, and architecture selection. Adobe Reader installed silently in just over two minutes without requiring a manual installer or scripting. NinjaOne has no equivalent.
- Actionable Alerts: Alerts include a Response action menu that lets administrators connect, run a script, open a command line session, or resolve the issue directly from the alert interface. When we selected the option to disable Windows AutoRun, it resolved the alert immediately and logged the action.
- Advanced Patch Management: The Patches tab displays severity levels and stability indicators per patch, helping teams prioritize which updates to install first and which to approach with caution.
- GPS Location Tracking: Device physical location and movement history via the “See on map” feature. Useful for tracking employee laptops and mobile devices. Not present in NinjaOne.
- Workflow Automation: Cross-service automation across backup, DR, RMM, security, and PSA with triggers ranging from device registration to EDR incident updates.1
Cons
- Agent deployment: Acronis uses a generic installer requiring manual browser-based registration per device. Each registration requires admin dashboard credentials. An IT administrator deploying to 200 workstations cannot grant dashboard access to every end user. NinjaOne and ManageEngine both use pre-authorized tokens that avoid this entirely.
- No copyable download URL: Both Windows and Linux agent selection triggers an immediate download rather than providing a URL to copy. Administrators managing remote Linux servers work from the CLI, not a browser. We had to extract the URL manually from the download prompt.
- No device renaming from dashboard: Devices cannot be renamed from the web interface. We had to log into each server individually and change the computer name at the OS level.
Recent Developments
- Workflow Automation Platform: Cross-service automation across backup, DR, RMM, security, and PSA.2
- Kaseya VSA 10 Integration: MSPs can now provision tenants, deploy agents, and monitor security status directly within Kaseya with automated workflows.3
- Enhanced Security Controls: New RMM operator role provides least-privilege access limited to remote management tasks. Automatic agent uninstallation protection helps prevent ransomware from disabling security software.4
3. AirDroid Business
AirDroid Business is an MDM platform focused on Android device management for enterprises. The platform helps organizations remotely monitor and control Android device fleets, including unattended endpoints like kiosks, digital signage, and point-of-sale systems.
Unlike general-purpose RMM platforms that focus on multiple operating systems, AirDroid Business focuses exclusively on Android, delivering deep integration and Android-specific features that broader platforms may lack.
Pros
- Remote Access Reliability: The Black Screen privacy feature hides remote sessions from on-site viewers.
- Kiosk Mode: Administrators successfully deploy locked-down configurations across device fleets. The multi-app kiosk option provides flexibility for devices requiring access to multiple applications while still restricting general system access.
- Android Depth: The platform provides Android-specific features absent from general RMM tools. Remote camera access, geofencing, and app-level controls work reliably across Android device manufacturers.
Cons
- No iOS Support: Organizations managing both Android and iOS devices need separate platforms. Mixed-device environments require either dual RMM solutions or accepting limited iOS coverage.
- MDM focus: MSPs and enterprises managing both desktop and mobile devices should choose an RMM solution rather than AirDroid.
4. ManageEngine Endpoint Central MSP
ManageEngine is a cybersecurity and IT automation platform developed by Zoho Corporation. Zoho Corporation is a technology company that develops a wide range of cloud-based applications.
Pros
- AI-Powered Insights: ManageEngine introduced Zia Insights, offering automated narratives that simplify data interpretation with clear, plain-language summaries of key insights from performance graphs.5
- Enhanced Monitoring Capacity: Now supports monitoring up to 2,500 devices per Monitoring Probe, with improved CSV discovery for automatic device imports.6
- Custom Dashboards: Users can create custom widgets from Advanced Report data and add them to dashboards for personalized monitoring views.7
Cons
- Interface: The user interface needs improvement. Some users described it as unintuitive.
- Training: Explanatory information about tools and the software in general is found to be lacking.
- Multi-OS: Some features are observed to perform more poorly on Linux and macOS than on Windows.
5. Atera
Atera’s platform integrates RMM, Professional Services Automation (PSA), and remote access tools into a single cloud-based solution. The software is designed to help users manage IT networks, automate processes, and monitor system health in real-time.
Pros
- AI-Powered Features: Atera’s platform features IT Autopilot (an autonomous, context-aware AI agent for end users) and AI Copilot (an IT technician’s companion for productivity), representing the world’s first Autonomous IT platform. Atera achieved 500% sales growth for its patented AI agents in 2025 and serves over 13,000 customers in 120+ countries.8
Cons
- Linux Deployment is challenging.
- Agent installation is significantly slower than NinjaOne.
Figure 1. The above picture matches the features with average user ratings
6. GoTo Resolve
GoTo, formerly known as LogMeIn, is a company that offers Remote Monitoring and Management (RMM) solutions, particularly through its GoTo Resolve platform. The company provides IT management tools designed for small and medium-sized businesses, enabling IT professionals and Managed Service Providers (MSPs) to manage, monitor, and support remote endpoints. GoTo Resolve includes features such as remote access, patch management, antivirus management, and automated workflows, all integrated into a single platform.
Pros
- Remote control and monitoring: Many users like GoTo Resolve’s remote monitoring and control abilities.
- Ticket management: According to most reviews, the ticketing system is efficient at handling problems raised by their multiple clients. Unnecessary information exchange regarding issues at hand is eliminated.
Cons
- Reporting: Reporting customization is lacking. Users express the need for tools that create more complex reports.
- Guidance: Explanatory information on features is lacking.
7. Kaseya VSA
Kaseya has been delivering IT management solutions since 2000. The company provides its customers with IT security software, service automation, ticket management, and quote management (As mentioned on its website).
Pros
- Windows updates: Users like the product’s ability to update Windows applications. Users report that they can easily update Windows-based applications.
- Remote control: Many users like the products’ remote control capabilities.
Cons
- Product updates: Reviewers express concern about the product’s updates. They seem to be problematic at times.
- User experience: Multiple users note that the product requires a steep learning curve. Understanding the tools and the interface demands effort.
Recent Developments
- AI-Powered Digital Workforce: Kaseya announced its Digital Workforce platform, featuring digital specialists who use agentic reasoning to think, assess, and act like top-tier technicians. Limited availability begins in Spring 2026.
- Pricing Model Changes: Effective December 2025, Kaseya ended its High Watermark pricing policy for Datto RMM, SaaS Protection, and Autotask, transitioning to a Committed Minimum Quantity and Variable Consumption model for greater flexibility.9
8. Pulseway
Founded in 2011, Pulseway offers a platform that enables users to remotely monitor and control IT systems, with capabilities including real-time alerts, automated tasks, patch management, and remote desktop access. The software is known for its mobile-first approach, enabling users to manage IT environments on mobile devices as well as desktops.
We tested Pulseway and looked at its RMM capabilities. Our findings are below:
- The deployment process is easy.
- You can easily browse around the platform.
- Remote access runs without a problem.
In summary, Pulseway is an easy-to-use RMM platform from the outset.
Pros
- Mobile app: Users appreciate the app’s availability and find it practical.
- User interface: Reviewers appreciate its ease of use. We found that browsing the platform is easy, and the user interface is intuitive.
Cons
- Price: The product’s overall cost is higher than that of its competitors.
- Remote management: Managing clients’ devices remotely can be unreliable. The system sleeps off and on, resulting in lost connections.
Figure 2. The above screenshot depicts Pulseway’s user interface
9. ConnectWise Automate
ConnectWise provides security, automation, and staff support for IT teams.
Pros
- Scripts: Reviewers like the availability of ready-to-implement script libraries.
Cons
- Customer support: Some users are dissatisfied with it.
10. Datto RMM
Datto was founded in 2017 in Texas, America. The company produces backup, SaaS, remote monitoring and management, professional service automation, quote management software, and hardware such as routers and WiFi. Datto acquired Bitdam and Infocyte, cyber threat detection and response companies.
Pros
- Upcoming Cyber Resiliency Platform: Kaseya previewed its Cyber Resiliency Platform, expected in April 2026, which provides a unified view, flexible pricing, and pooled storage to support all backup use cases, with advanced security and AI capabilities.
- Identity Protection: Kaseya introduced Datto Backup for Microsoft Entra ID, a purpose-built backup and recovery solution that protects identity data and enables rapid restoration after accidental deletions, misconfigurations, or attacks. Available both as a standalone product and included in Kaseya 365 User.10
- All-in-one platform: The platform offers multiple tools that are easily accessible and run without error.
Cons
- Configuration process: Reviewers describe the configuration process as complex, with a demand for the availability of predefined configurations.
- Patch management: Some users express frustration with patching because the process is reportedly unclear and difficult to follow.
Post-Acquisition Updates
Pricing Flexibility: The High Watermark pricing model was eliminated in 2025, replaced with a Committed Minimum Quantity and Variable Consumption model across the Datto product line.11
11. Action1
Action1 is a cloud-based Remote Monitoring and Management (RMM) software company that provides tools for IT administrators and Managed Service Providers (MSPs) to manage and secure remote endpoints. Founded in 2018, the company offers a platform that enables users to automate patch management, monitor systems, and ensure compliance across distributed networks.
Pros
- Interface: The easy-to-use interface is liked by most of the reviewers.
Cons
- Remote management user experience: User experience fails to satisfy users’ needs when remote monitoring is in process. On the client’s desktop, when monitored, informative notifications are lacking.
- Mobile application for iOS devices: The Mobile application for iOS devices is not available.
12. N-able N-Sight
Originally part of SolarWinds, N-able became a separate entity in 2021. The company offers a suite of tools designed to help MSPs manage, monitor, and secure IT environments for their clients. These tools include patch management, endpoint detection and response, backup, and recovery, as well as automation features.
We tested N-able N-sight and looked at its RMM capabilities. Our findings are below:
- It can occasionally be challenging for users to navigate to other pages due to the structure of the web browser page.
- In the device management and monitoring window, you can choose to remote control, download agents, chat, send mail, choose report settings, and share files.
- The predefined script library can be utilized to deliver automated tasks by allowing specific scripts to be executed.
- You can invoice your customers in accordance with the type of fee you define.
Pros
- Training: Reviewers like the availability of training content.
- Easy use: Multiple users like the product’s easy settings.
Cons
- Deployment of functions: Users do not like the product’s responses. The product is claimed to demand useless information when deploying different tools.
- Navigation: Some users find navigating through the product cumbersome. We agree that the structure of the website can make it difficult for users to navigate to other pages.
13. SuperOps
SuperOps is a company that provides cloud-based IT management software, specifically focusing on Remote Monitoring and Management (RMM) and Professional Services Automation (PSA) solutions. Founded to serve the needs of Managed Service Providers (MSPs), SuperOps offers a unified platform that combines IT service management and operations tools into a single interface.
The following are the main conclusions from our benchmarking study of RMM tool products, including SuperOps’s:
Pros
- Ease of use: Browsing through the platform is easy with tab-based navigation.
- PSA integration: The built-in PSA integration works seamlessly.
Here are the key takeaways from other reviewers’ points of view:
Cons
- Mobile app: Reviewers claim the mobile app needs improvement in its update frequency.
RMM Agent Deployment and Dashboard Benchmark
1. Agent Deployment
Agent Deployment Comparison Table
1. NinjaOne
NinjaOne opened with a “Get started” page featuring intro videos and step-by-step guides for adding technicians, users, and devices. The onboarding anticipates everyday first tasks without overwhelming new users.
We clicked the “+” button in the top right and selected “Add new device.” The dropdown revealed every manageable device type: computers, mobile devices, virtual infrastructure, cloud monitors, and network management systems.
Windows Agent Installation
We selected “Computer” and chose Windows from the operating system options. The right panel requested organizational details, such as the organization and office location to which the device belongs. NinjaOne generated a single Windows installer for deployment across our servers in Ireland, Ohio, and Seoul.
The platform provided both a download button and a copyable link. The link option lets us paste the URL directly into each server’s browser instead of downloading locally and transferring files, a time-saver when managing remote servers.
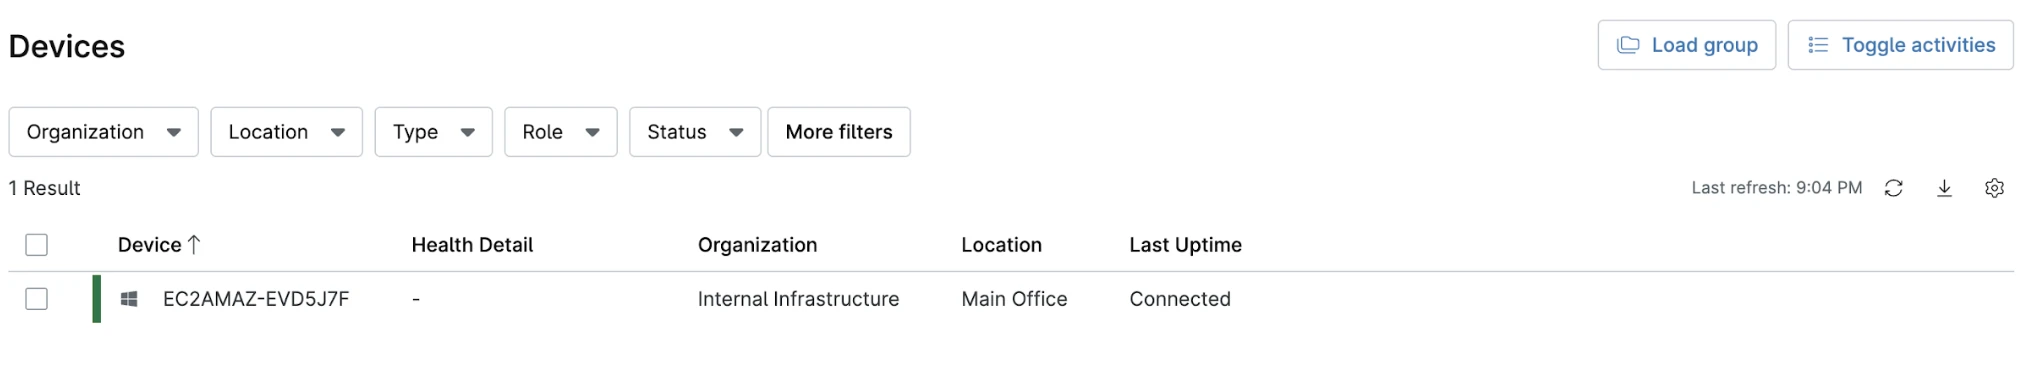
We downloaded the installer on our Ireland server and double-clicked the .msi file. The installer window disappeared instantly. No progress bar, no completion dialog. We checked the NinjaOne dashboard and found the device already listed with a “Connected” status.
Installation took under 2 seconds from click to dashboard registration.
We renamed the device from its AWS hostname to “IRELAND” for clarity. Our only complaint: the complete lack of installation feedback. A simple notification saying “Agent installed successfully” would confirm the installation worked instead of leaving users wondering if something failed silently.
We repeated the process on Ohio and Seoul servers using the same installer file. All three Windows instances appeared in the dashboard within seconds of execution.
Again, we expected a completion notification to confirm success, but the silent installation provided no feedback.
Linux Agent Installation
We generated a Linux installer for deployment to our São Paulo, North California, and Canada servers. Linux setup required selecting a distribution type. NinjaOne showed “Debian” and “RPM” as options.
The dropdown would be clearer with familiar distribution names, “Ubuntu/Debian” or “CentOS/RHEL” instead of package format types. Users unfamiliar with .deb versus .rpm packaging might not know which to select.
The platform provided a download link but no installation instructions. We expected a “How to install” section, or, at a minimum, a sample command to execute the installer. Windows users clicking a .msi file is intuitive, but Linux users need to know whether to run it. dpkg -i, apt install, or another command.
After generating the Linux installer, NinjaOne displayed the download link, but never mentioned that this single installer works across unlimited devices running the same OS.
We knew from experience that one installer can deploy to multiple machines, so we used the same file across all three Linux servers. However, administrators unfamiliar with agent deployment might assume each device needs its own installer.
We pasted the download URL into our São Paulo server’s terminal and executed the .deb package:
The agent was installed before we could lift our finger from the Enter key. The terminal showed “NinjaOne installation completed successfully” and returned to the prompt. The device appeared in the dashboard immediately, literally within seconds of the installation completing.
We deployed to servers in Northern California and Canada using the same installer. All three Linux instances registered in the dashboard as soon as installation finished.
macOS Agent Installation
Mac setup asked whether we wanted DMG or PKG format. We selected DMG for the standard macOS installation experience.
We connected to our Mumbai Mac instance via VNC and opened the downloaded DMG. The installation wizard walked through standard macOS steps and displayed a completion message, unlike the silent Windows and Linux installers that provided no feedback.
The device didn’t appear in the dashboard. We waited 5 minutes with no change. We restarted the machine, still nothing in the device list.
We reran the installer. This time it displayed “Previous installation detected” but allowed us to proceed. After the second installation, the device finally appeared in the dashboard with “Not connected” status. A few seconds later, it switched to “Connected.”
macOS installation required troubleshooting that Windows and Linux didn’t need. The agent was installed successfully the first time (confirmed by the “Previous installation detected” message on the second run), but failed to register with the dashboard.
NinjaOne needs better visibility into agent registration status and more explicit error messages when initial registration fails.
2. ManageEngine
We signed up for ManageEngine Endpoint Central and received a verification email from Zoho. ManageEngine is a Zoho product.
The trial setup asked whether we wanted on-premises or cloud deployment. NinjaOne and Acronis only offered cloud, so this deployment flexibility was unexpected. We selected the cloud to match our other tests.
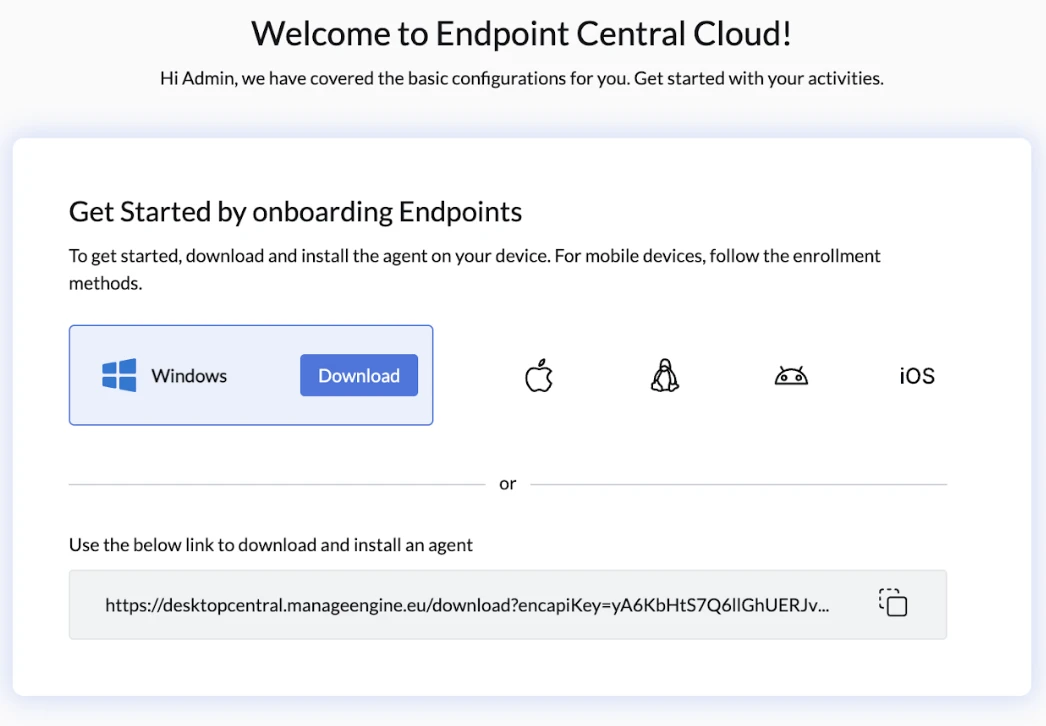
After registration, ManageEngine directed us immediately to device enrollment: no onboarding tour or setup guidance, just a prompt to add devices.
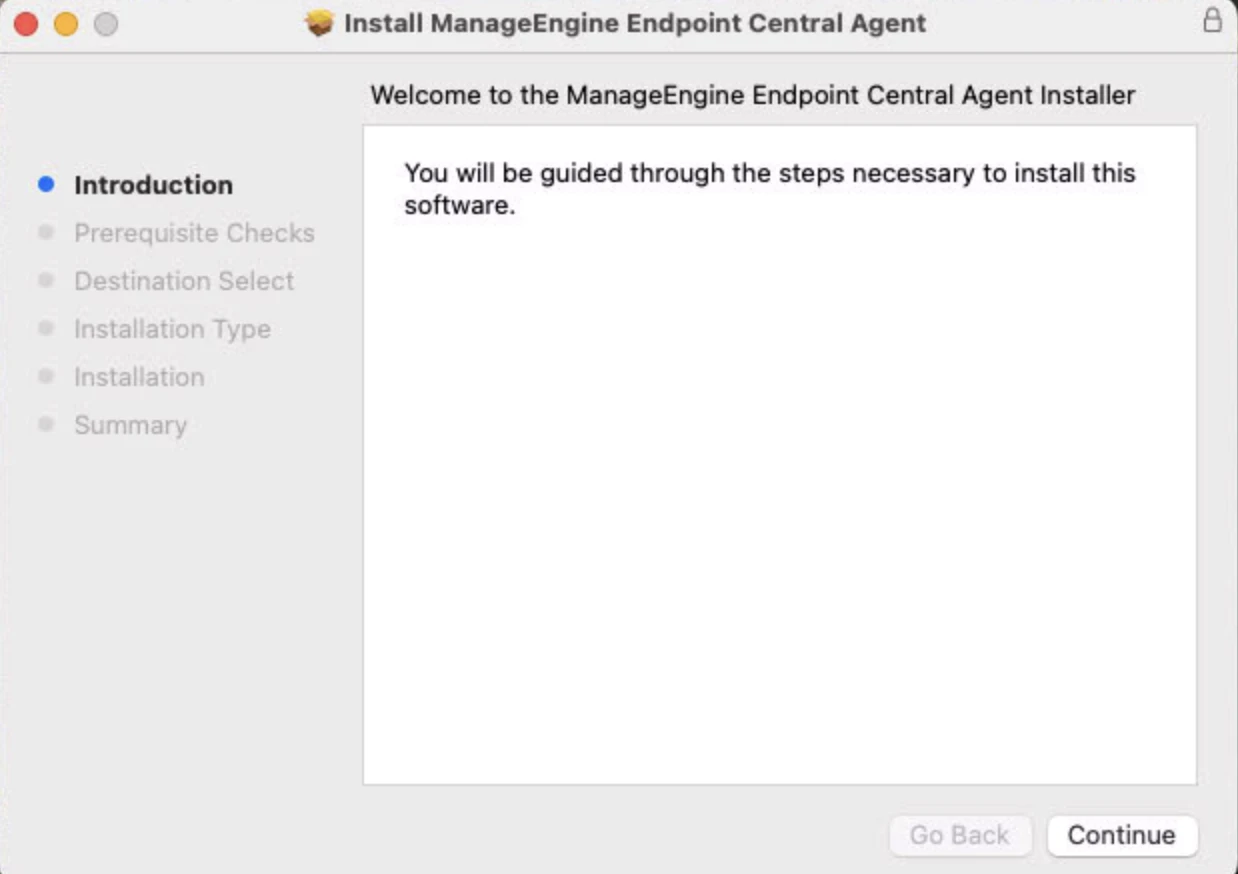
Windows Agent Installation
We clicked the download link, expecting a direct file download. Instead, ManageEngine opened a separate page showing the installer download button with OS selection options.
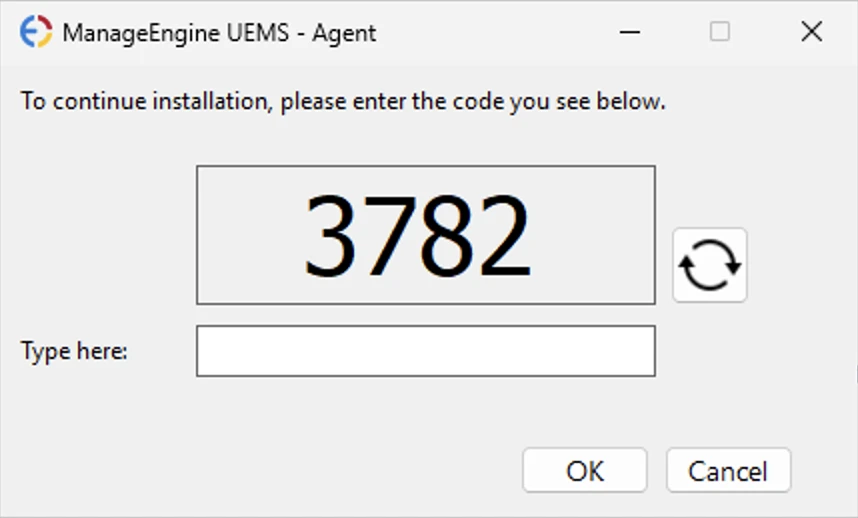
Clicking download opened the installer. Before installation could begin, a CAPTCHA verification prompt appeared:
We clicked through the wizard steps. Installation completed in 15-20 seconds. Unlike NinjaOne’s silent Windows installation, ManageEngine required clicking “Next” through multiple screens.
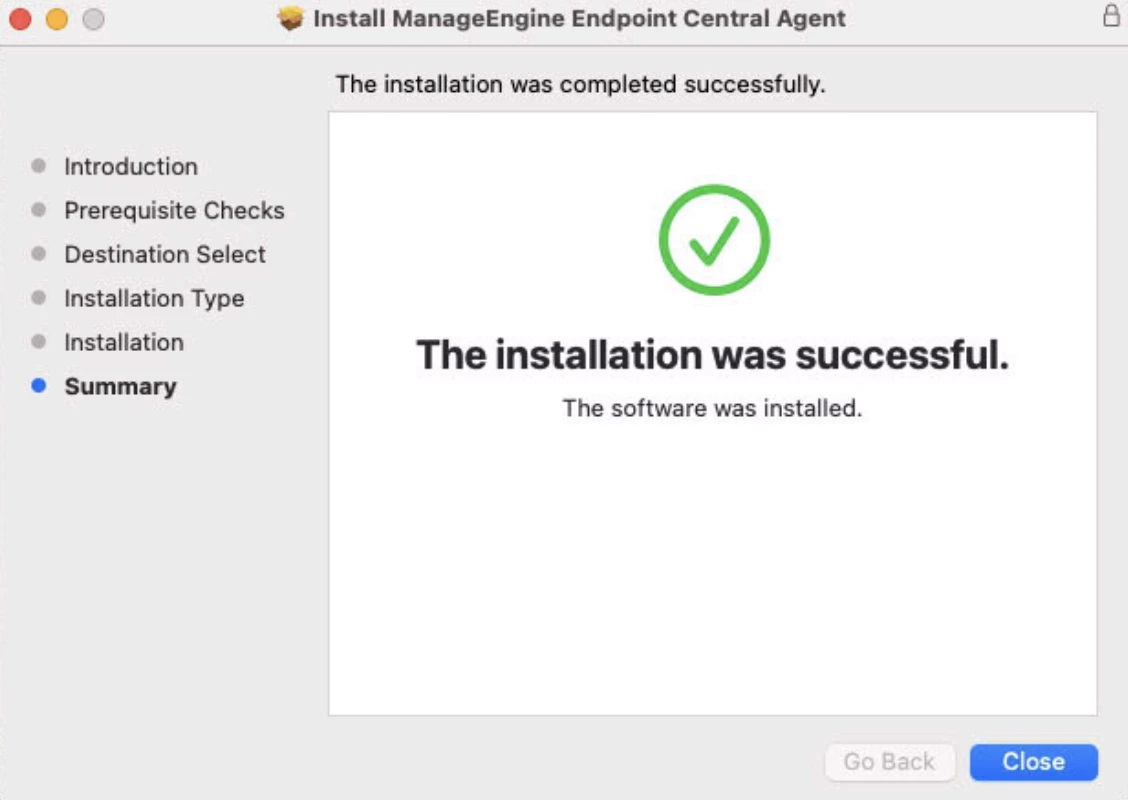
The installer provided no completion notification. No dialog saying “Agent installed successfully.” We navigated to the dashboard manually to confirm the device registered.
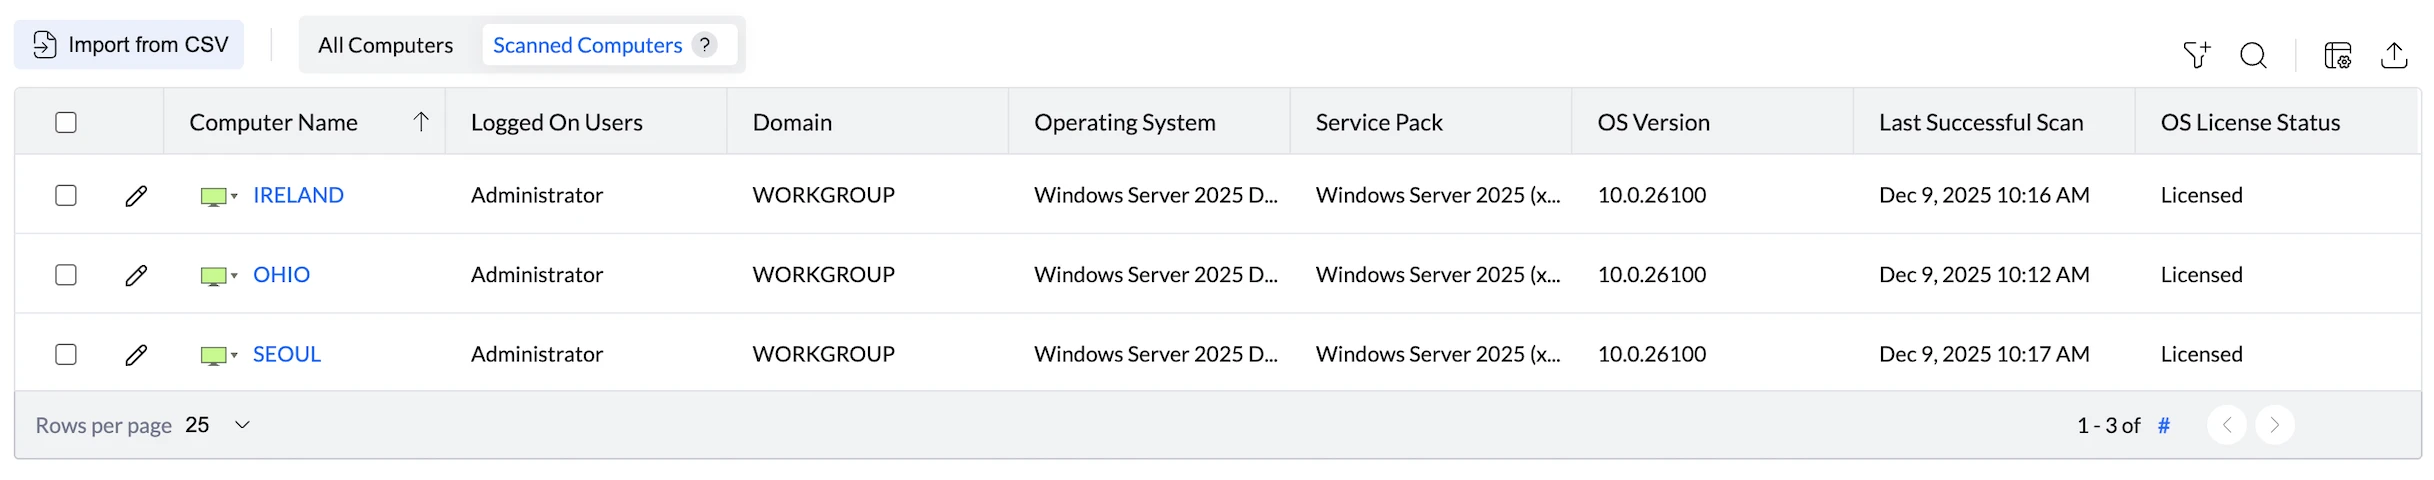
The dashboard showed that our Ireland server appeared successfully. We repeated the process for Ohio and Seoul servers using the same installer file.
All three Windows instances registered within a minute of installation completing.
Linux Agent Installation
Linux installation presented immediate problems. The download page only offered a browser download button, no direct URL to copy. We needed to download the agent on our local machine, then figure out how to transfer it to our Linux servers.
We tried copying the download button URL and pasting it into the Linux terminal. The URL returned a 400 error. The download link was session-specific and wouldn’t work when accessed from a different machine or IP address.
We eventually downloaded the .zip file locally, uploaded it to our servers via SCP, and proceeded with installation. This added 5-10 minutes per server compared to NinjaOne’s copy-paste URL approach.
The download page contained zero installation instructions: no command examples, no documentation link. We extracted the .zip file and found a README with installation steps buried inside the archive.
We ran the .bin file and timed the downloads across regions:
- Canada: 4.88 MB/s
- São Paulo: 1.16 MB/s
- California: 3.25 MB/s
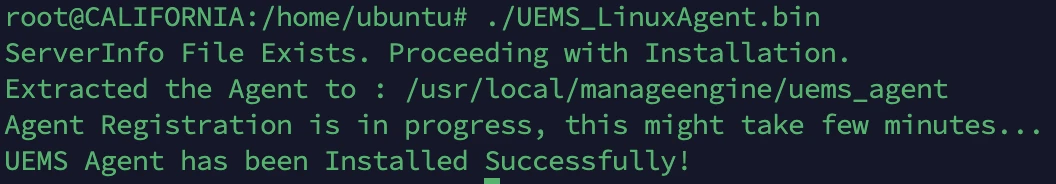
The agent was extracted and installed within seconds once executed:
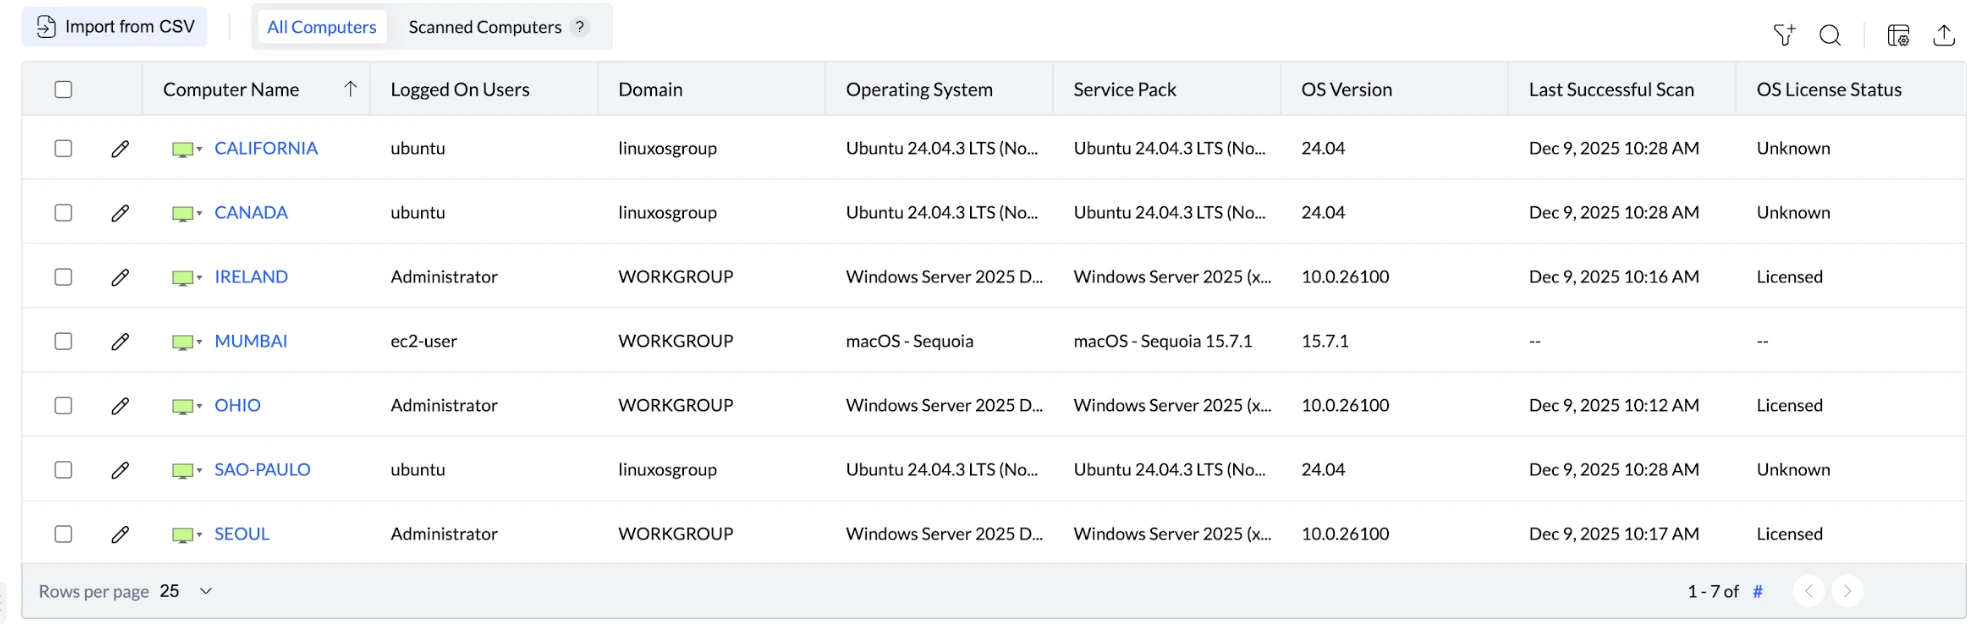
macOS Agent Installation
Mac installation downloaded a standard .pkg installer. We opened it on our Mumbai Mac instance.
The installer walked through typical macOS installation steps. Installation completed in seconds with a clear completion message.
The device appeared on the dashboard immediately:
macOS installation worked smoothly without the registration issues we encountered with NinjaOne.
3. Acronis Cyber Protect Cloud
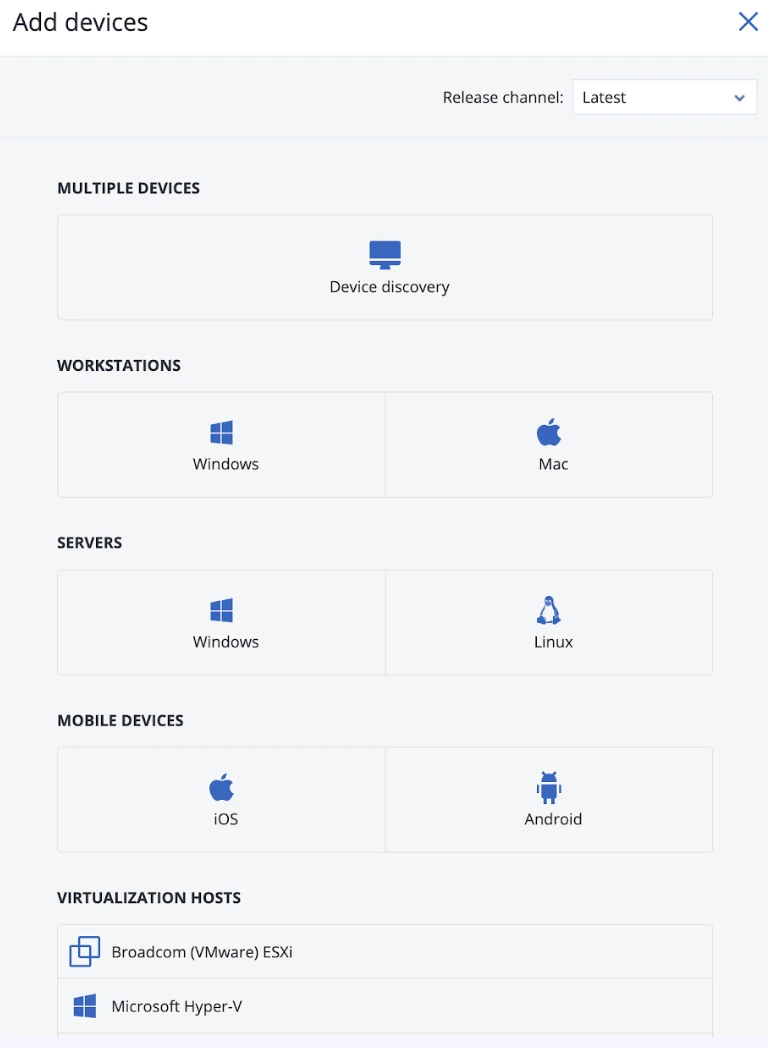
Acronis provides RMM capabilities through its Cyber Protect Cloud product. We signed up and began adding devices.
The “Add devices” panel showed device types arranged differently from competitors’. Windows and Linux appeared under “Servers,” while Mac joined Windows under “Workstations.” This categorization felt arbitrary; we were deploying to servers across all three operating systems.
Windows Agent Installation
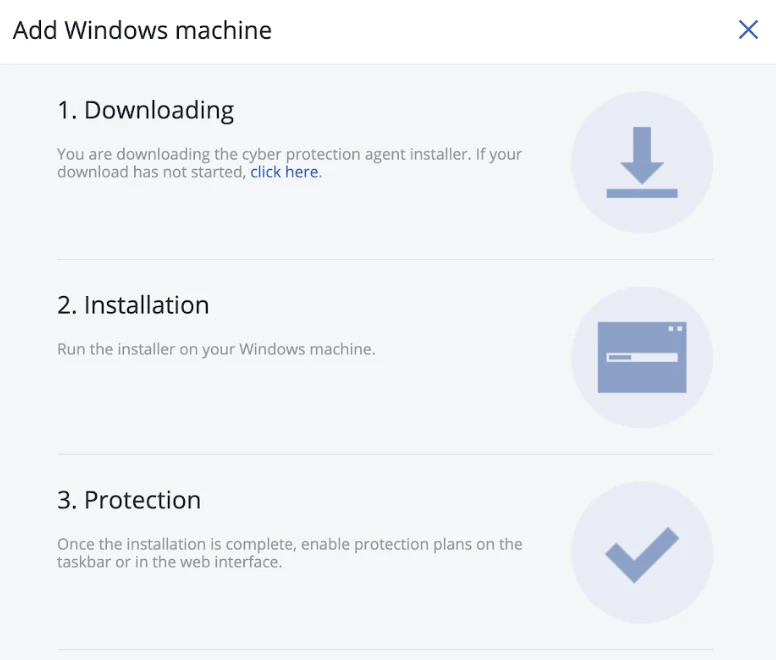
We selected Servers, Windows, and the platform immediately triggered a download without offering a URL to copy. We needed to install agents on remote servers, not the local admin machine. This UX oversight forced us to find the “click here if download hasn’t started” link to extract the actual download URL.
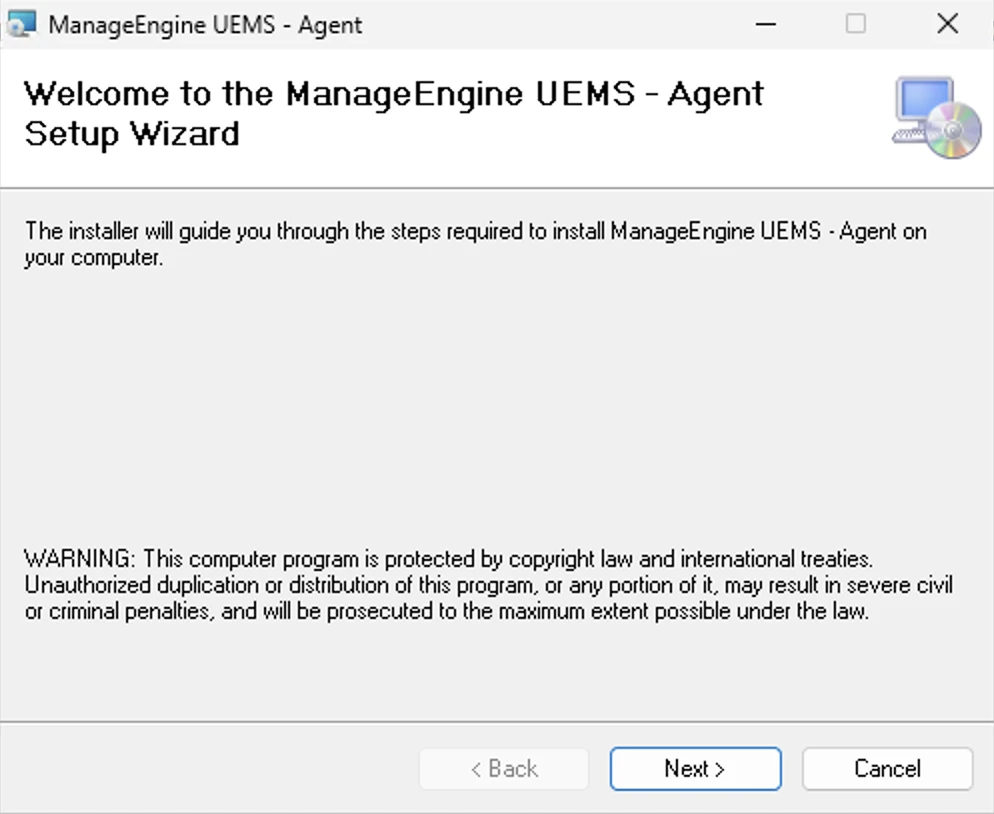
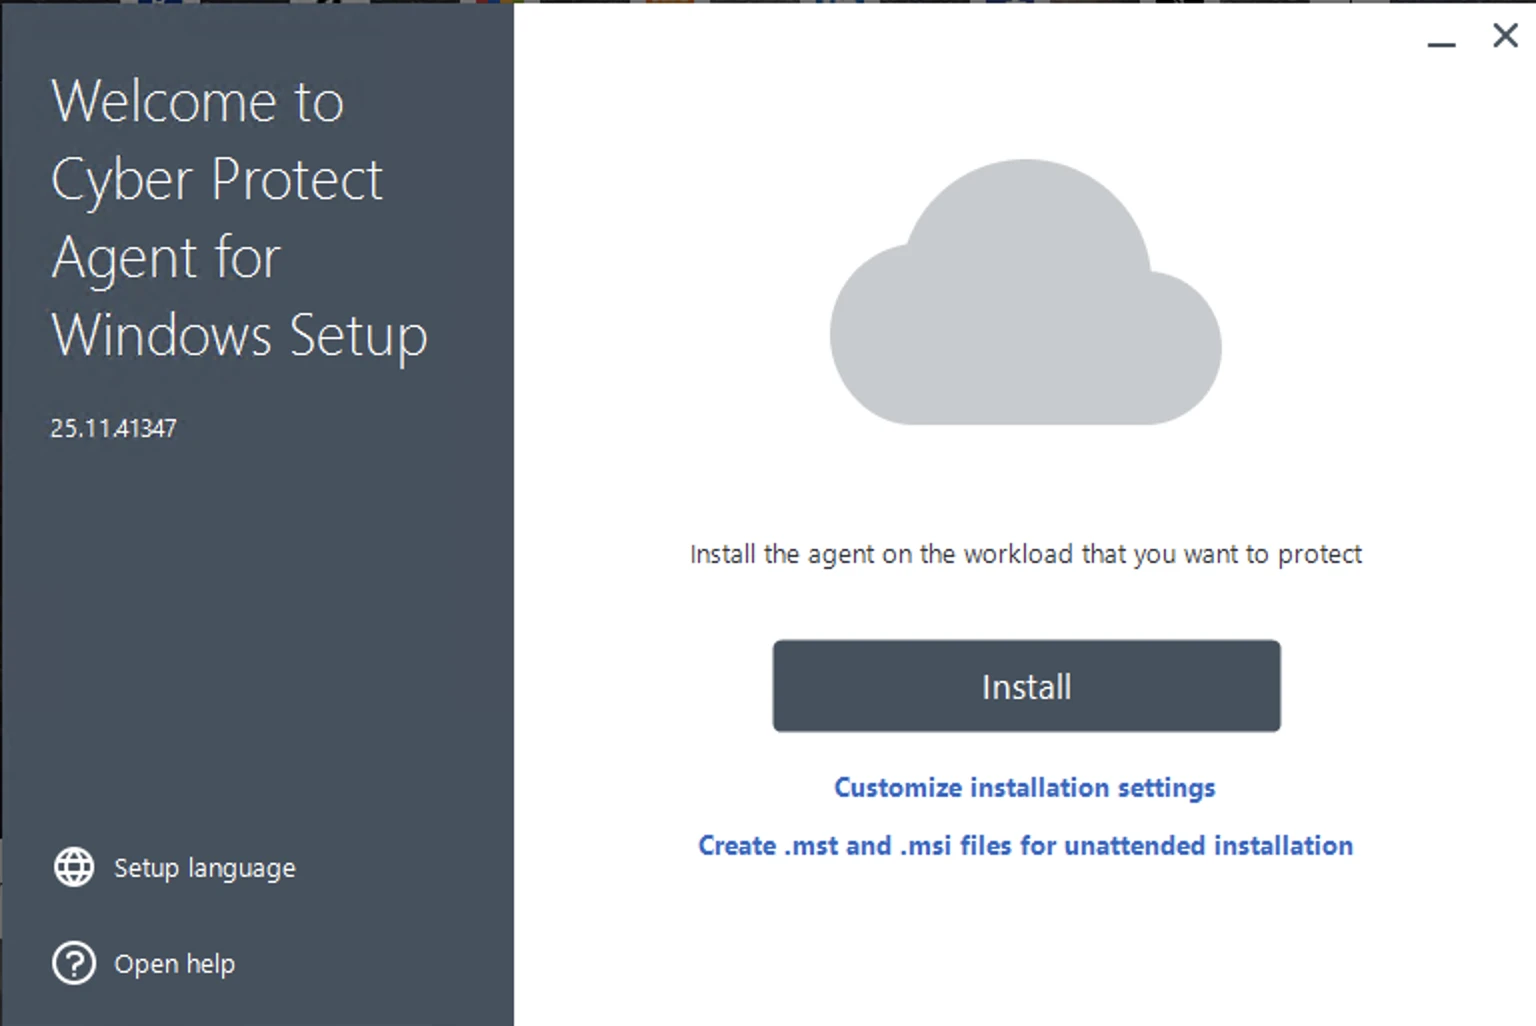
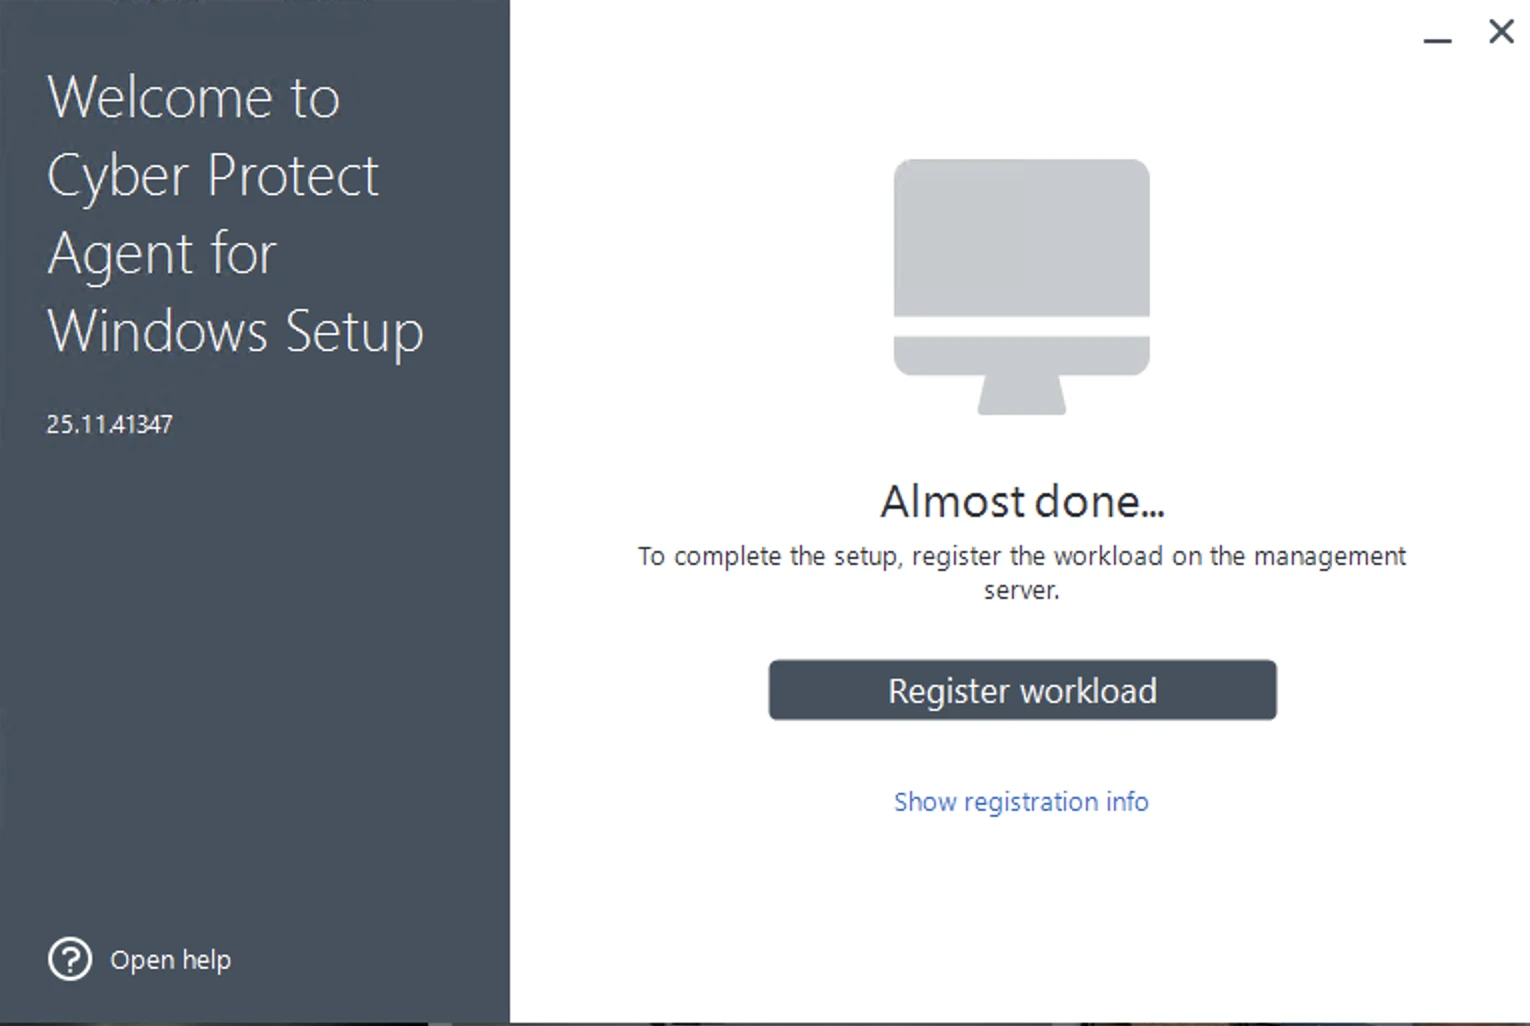
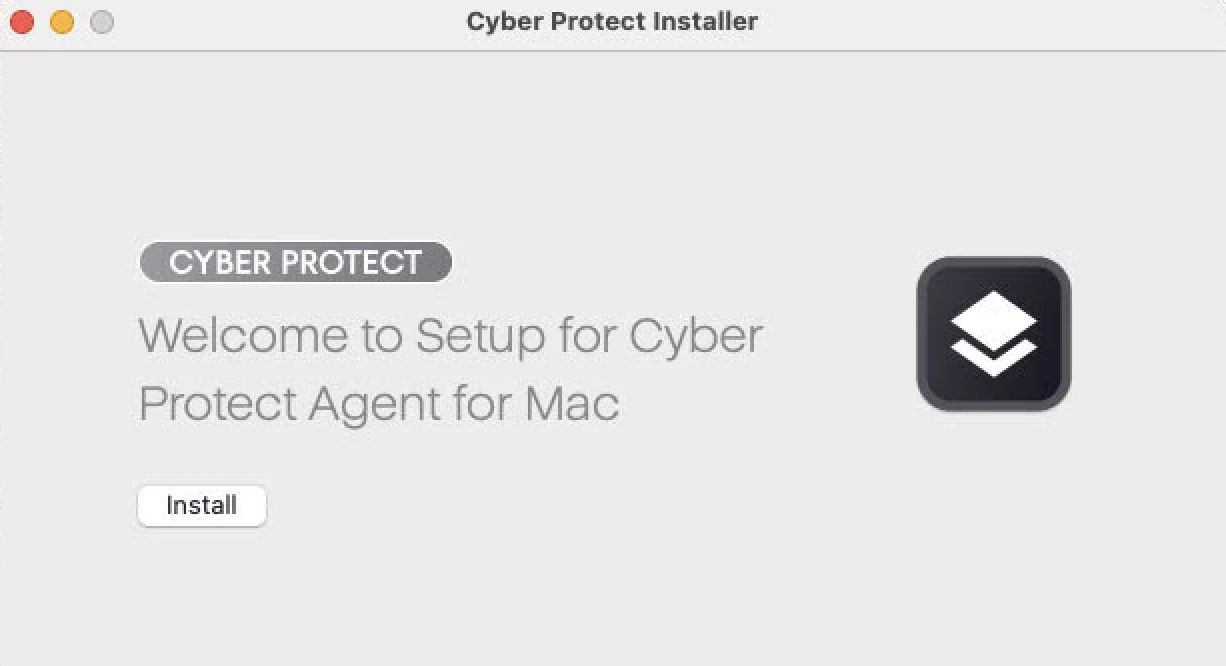
We downloaded the installer and launched it. The welcome screen appeared.
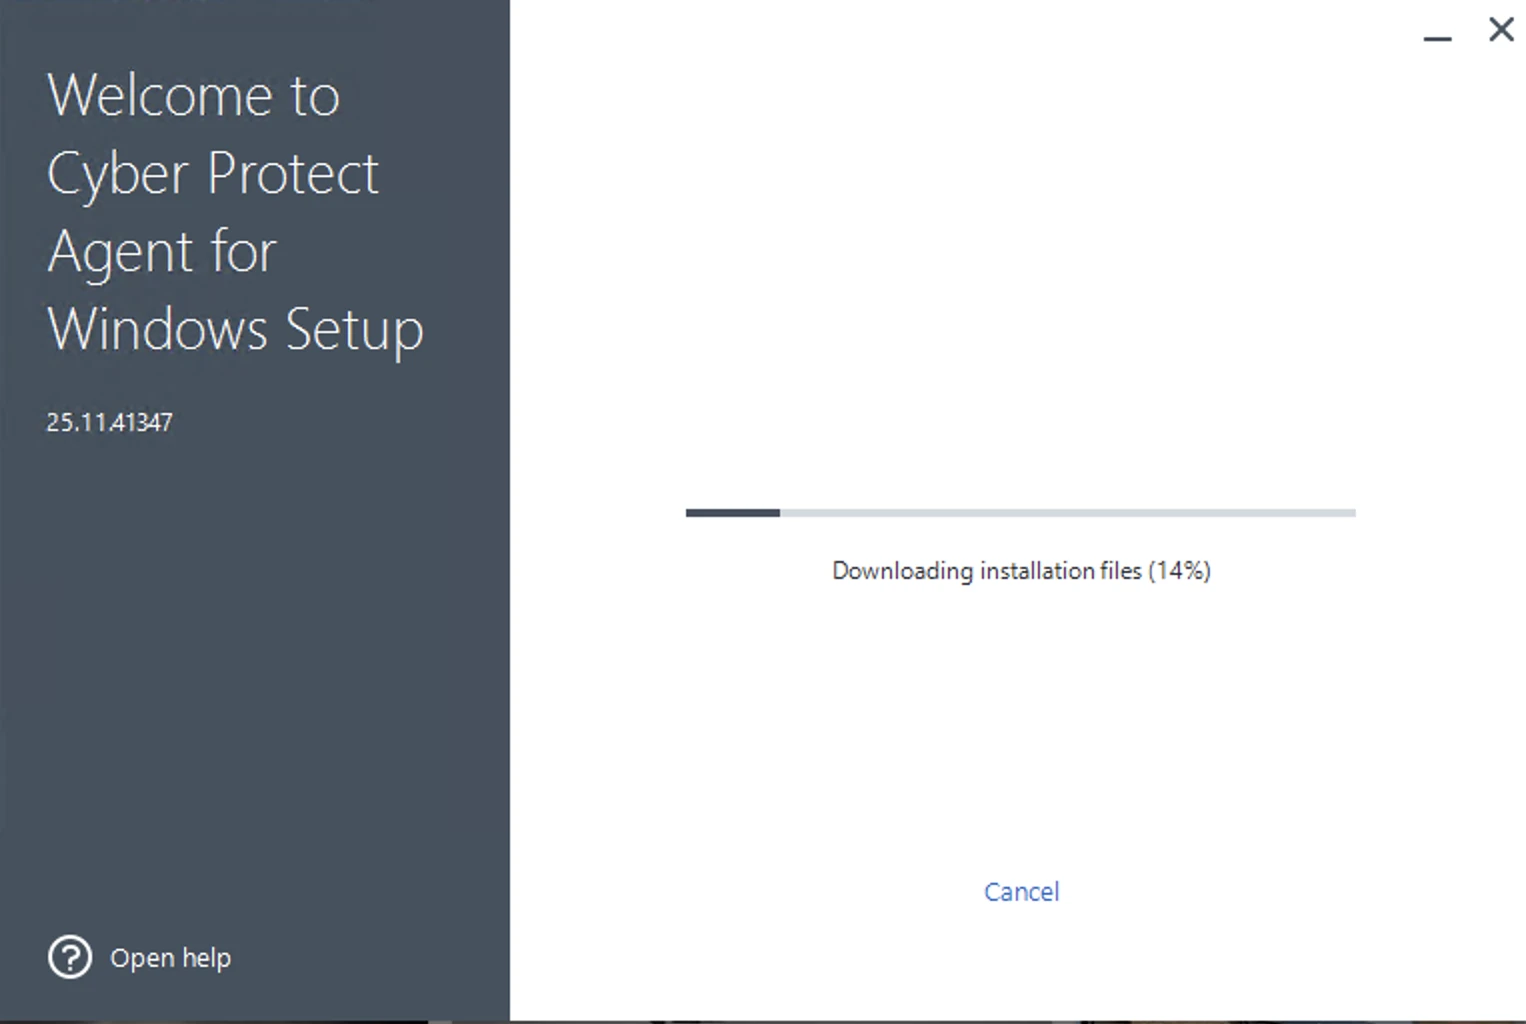
Clicking “Install” revealed that the installer downloads additional files from Acronis servers during installation:
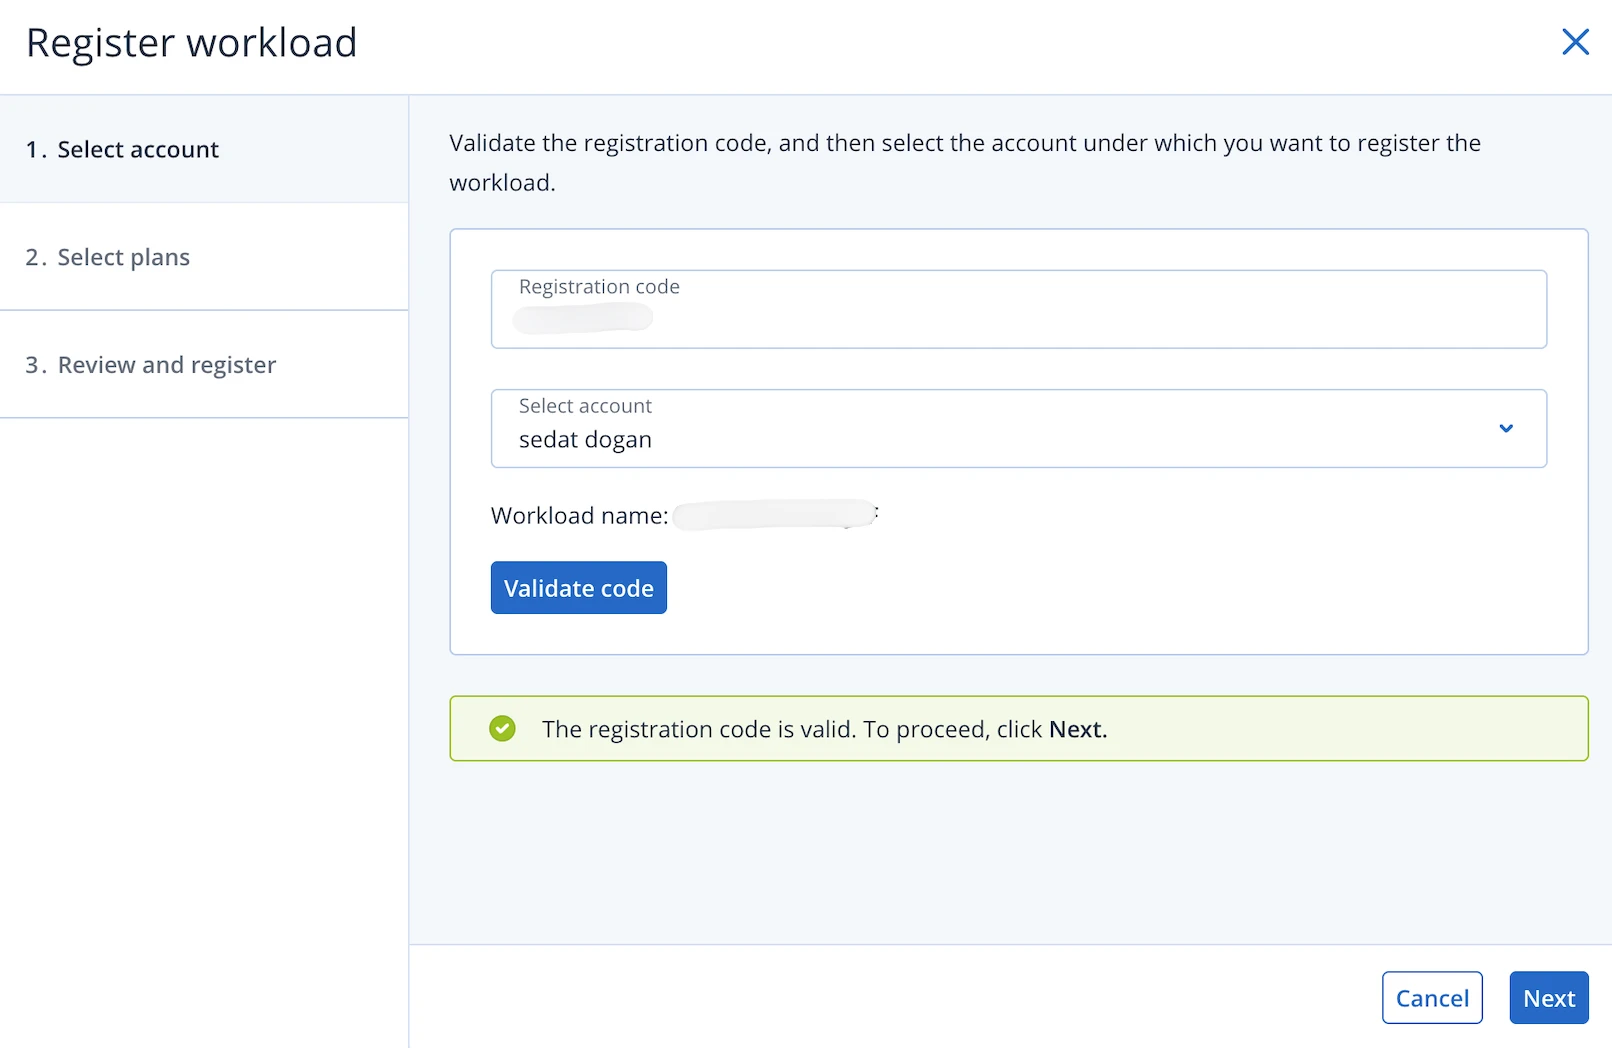
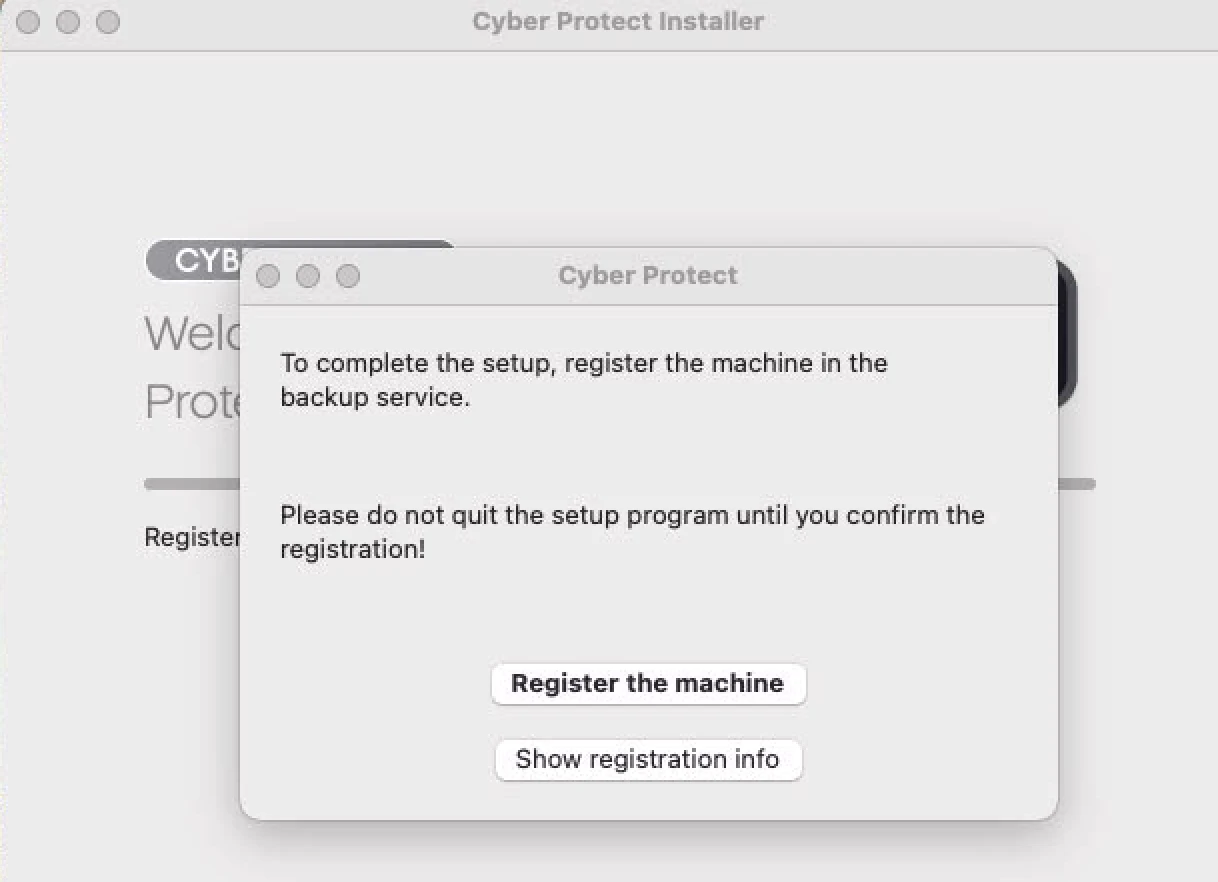
After the download completed and the installation finished, we clicked “Register workload.” The installer opened our default web browser and demanded admin login credentials.
This registration workflow creates problems at scale. For example, an IT administrator deploying agents to 200 employee workstations cannot give dashboard access to every end user. DevOps teams deploying to server fleets don’t need dashboard logins. NinjaOne and ManageEngine both avoided this issue with pre-authorized installer tokens.
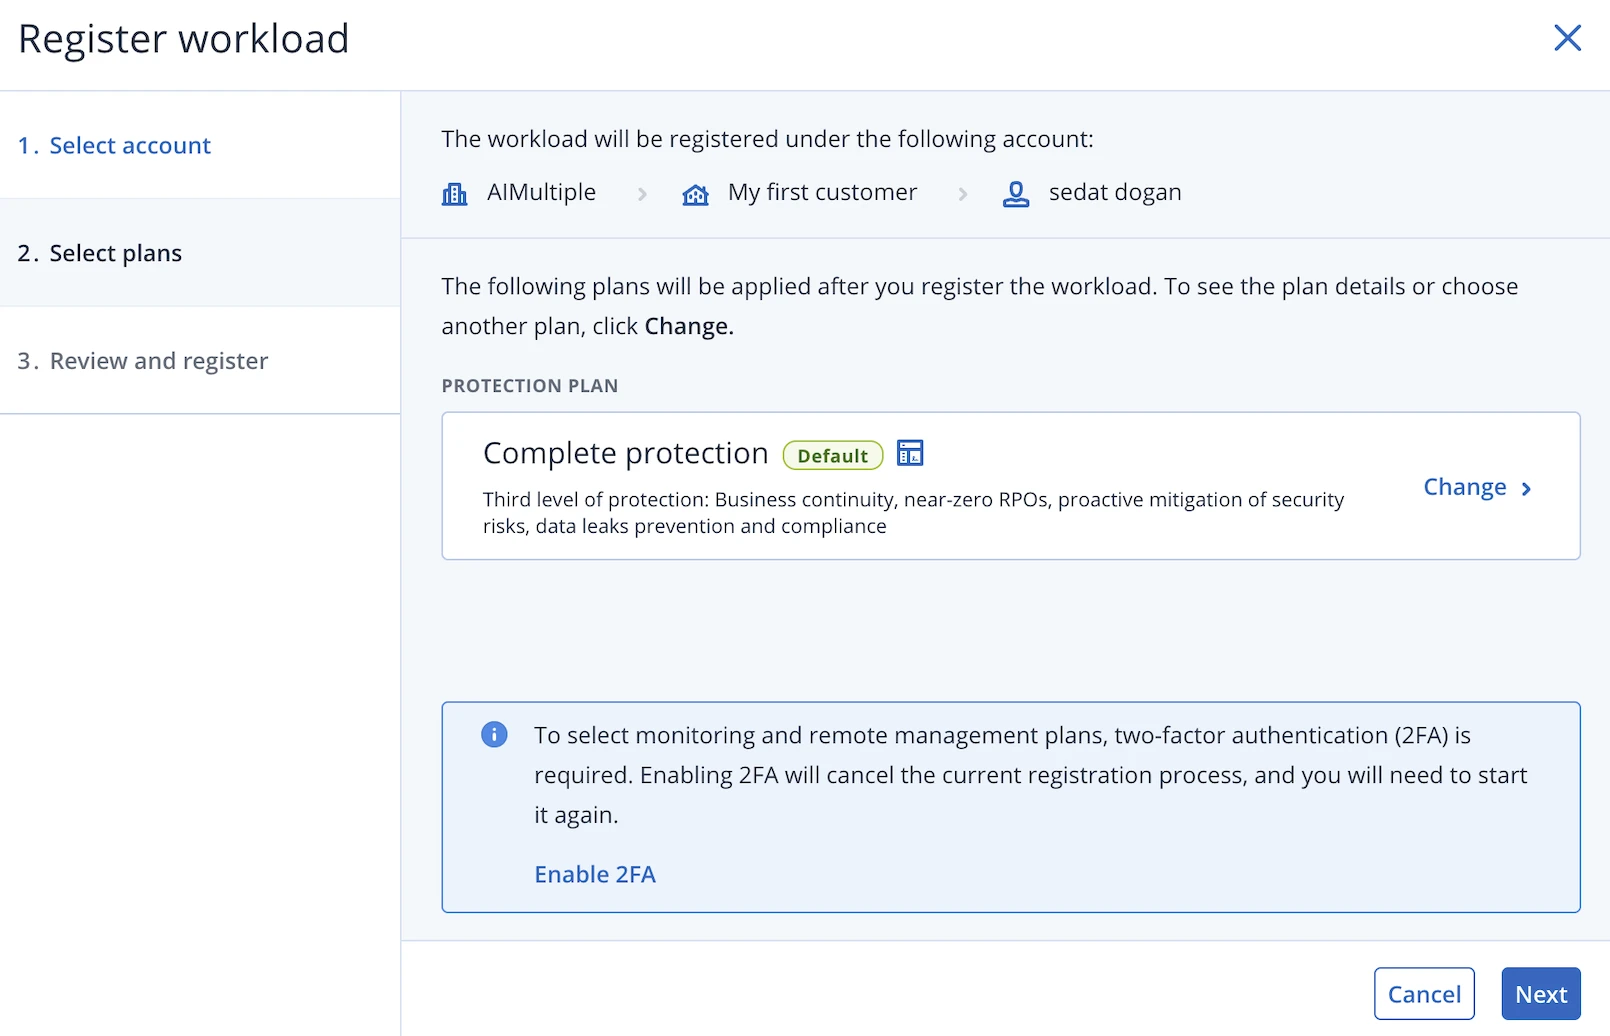
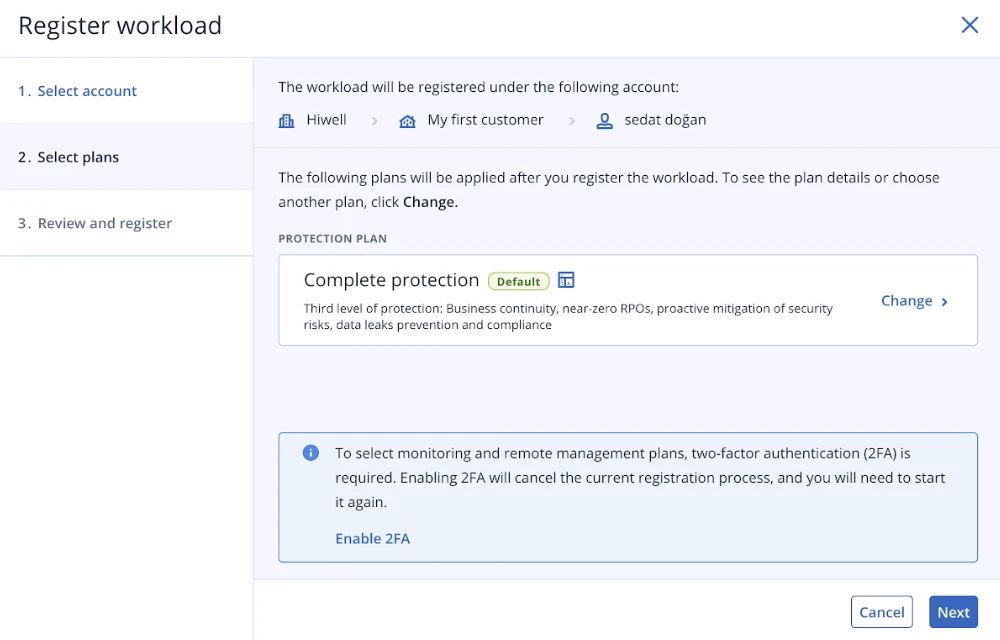
After logging in, Acronis displayed a registration wizard requesting a protection plan selection:
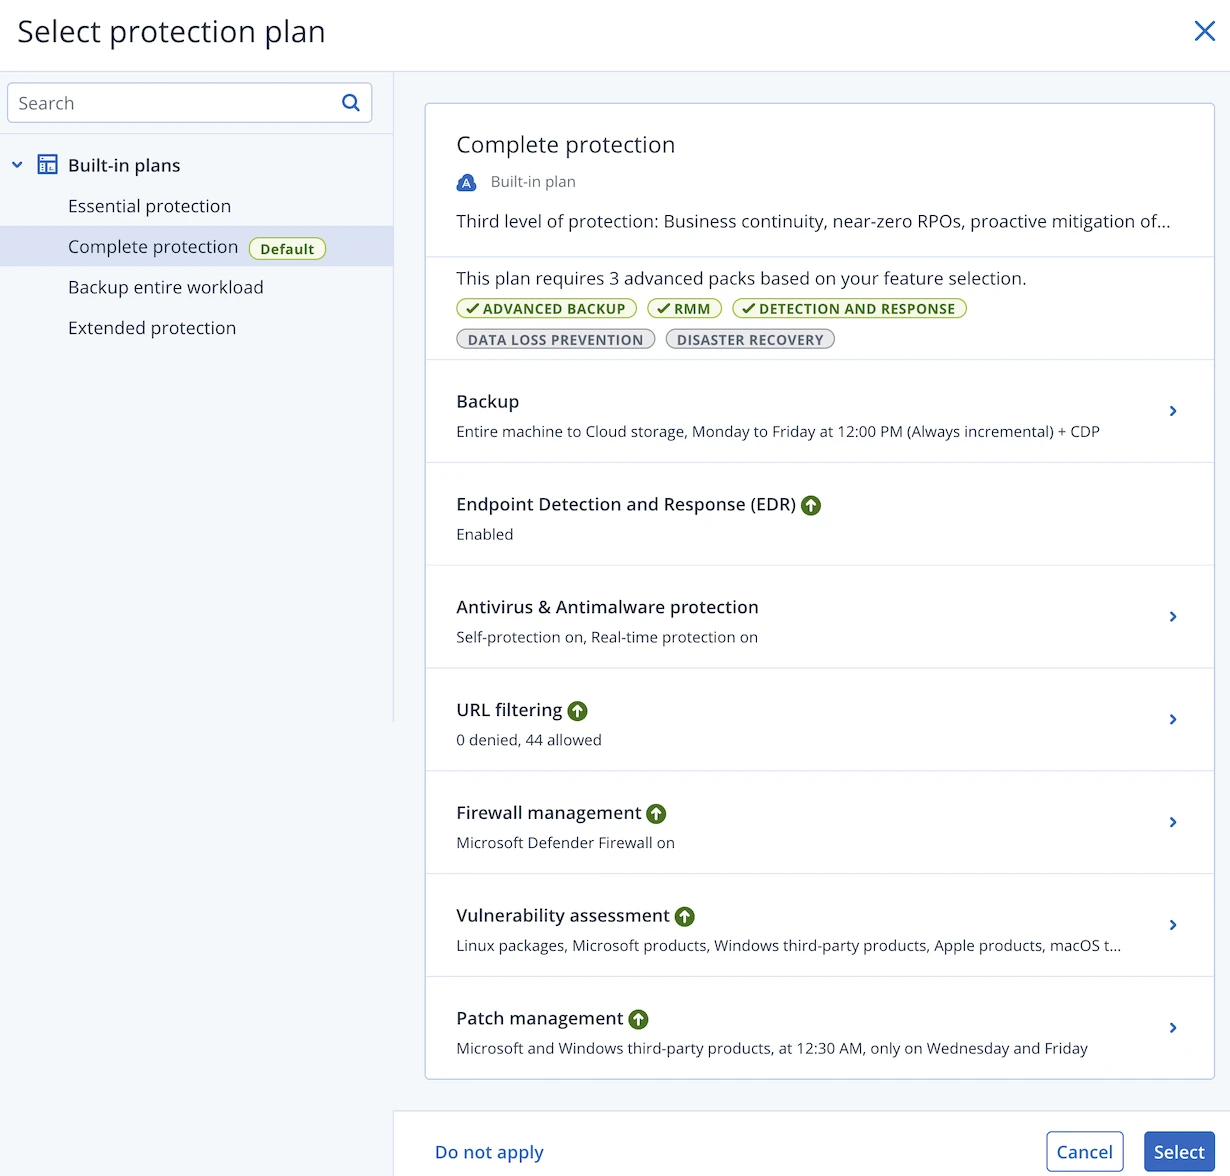
We clicked “Change” to see available options. The platform offered Essential, Complete, Backup, and Extended protection plans. We kept the default “Complete protection” setting.
Acronis uses a generic installer for all devices. Unlike NinjaOne’s device-specific tokens, Acronis requires manual web registration after installation. This explains the browser-based workflow the installer cannot pre-authorize devices.
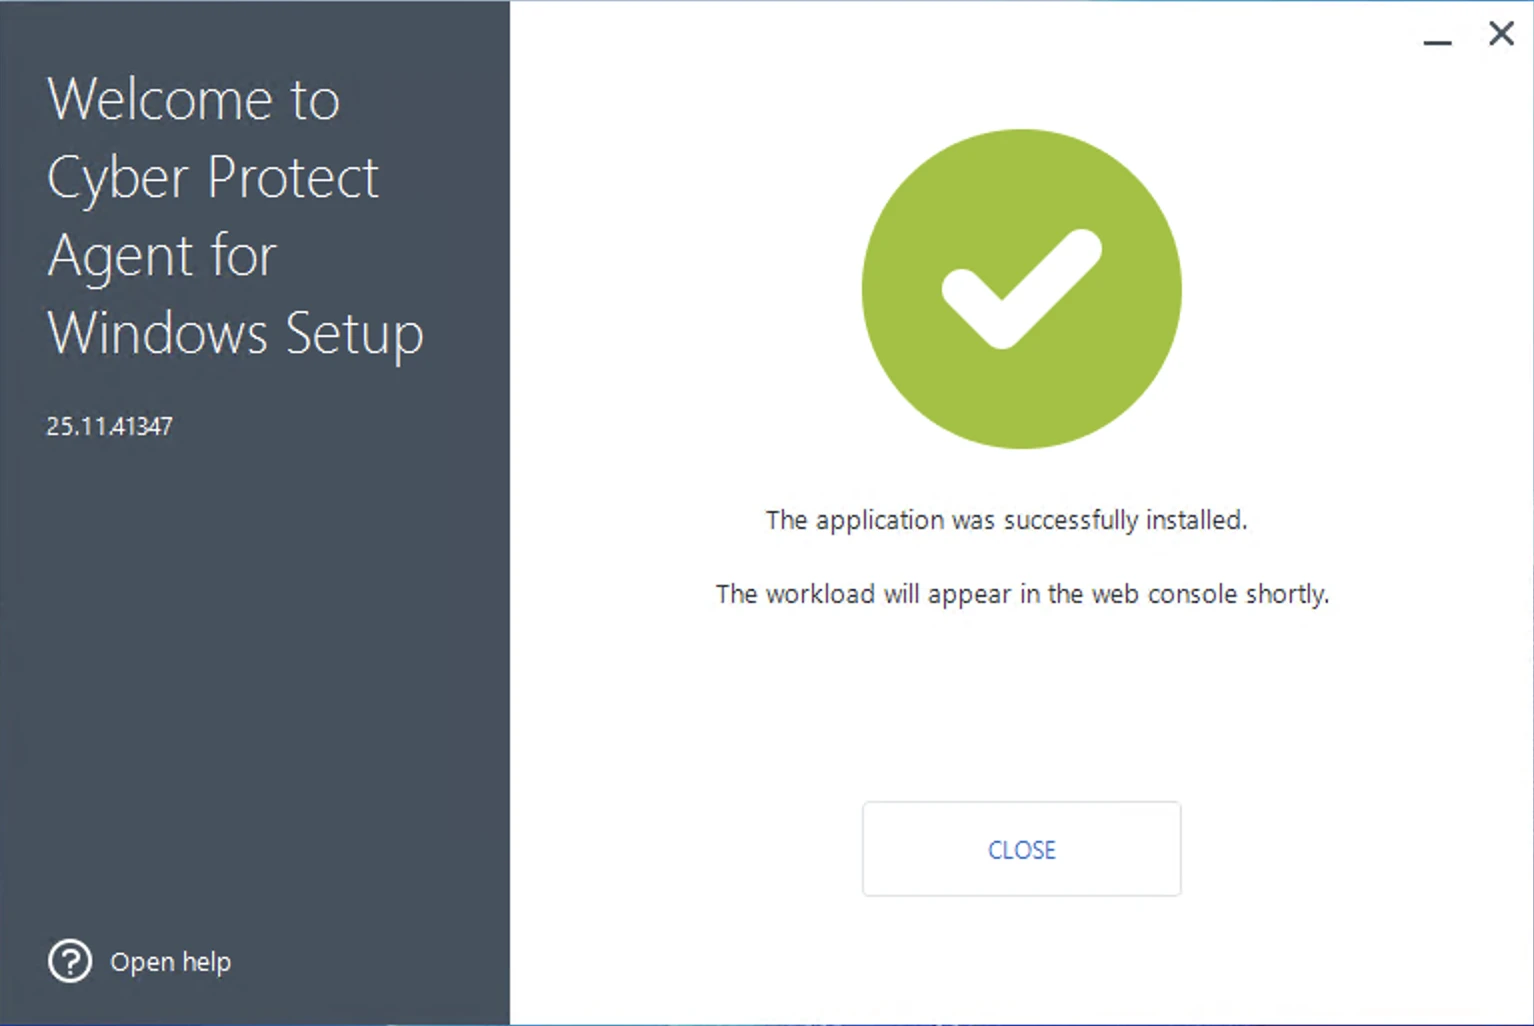
After completing web registration, the agent confirmed successful installation:
The device appeared in the dashboard. However, Acronis provided no option to rename devices from the web interface. NinjaOne let us rename devices instantly. We had to log into each Windows server and change the computer name at the OS level, which was an unnecessary extra step.
We repeated the process for Ohio and Seoul servers. All three Windows instances registered successfully.
Linux Agent Installation
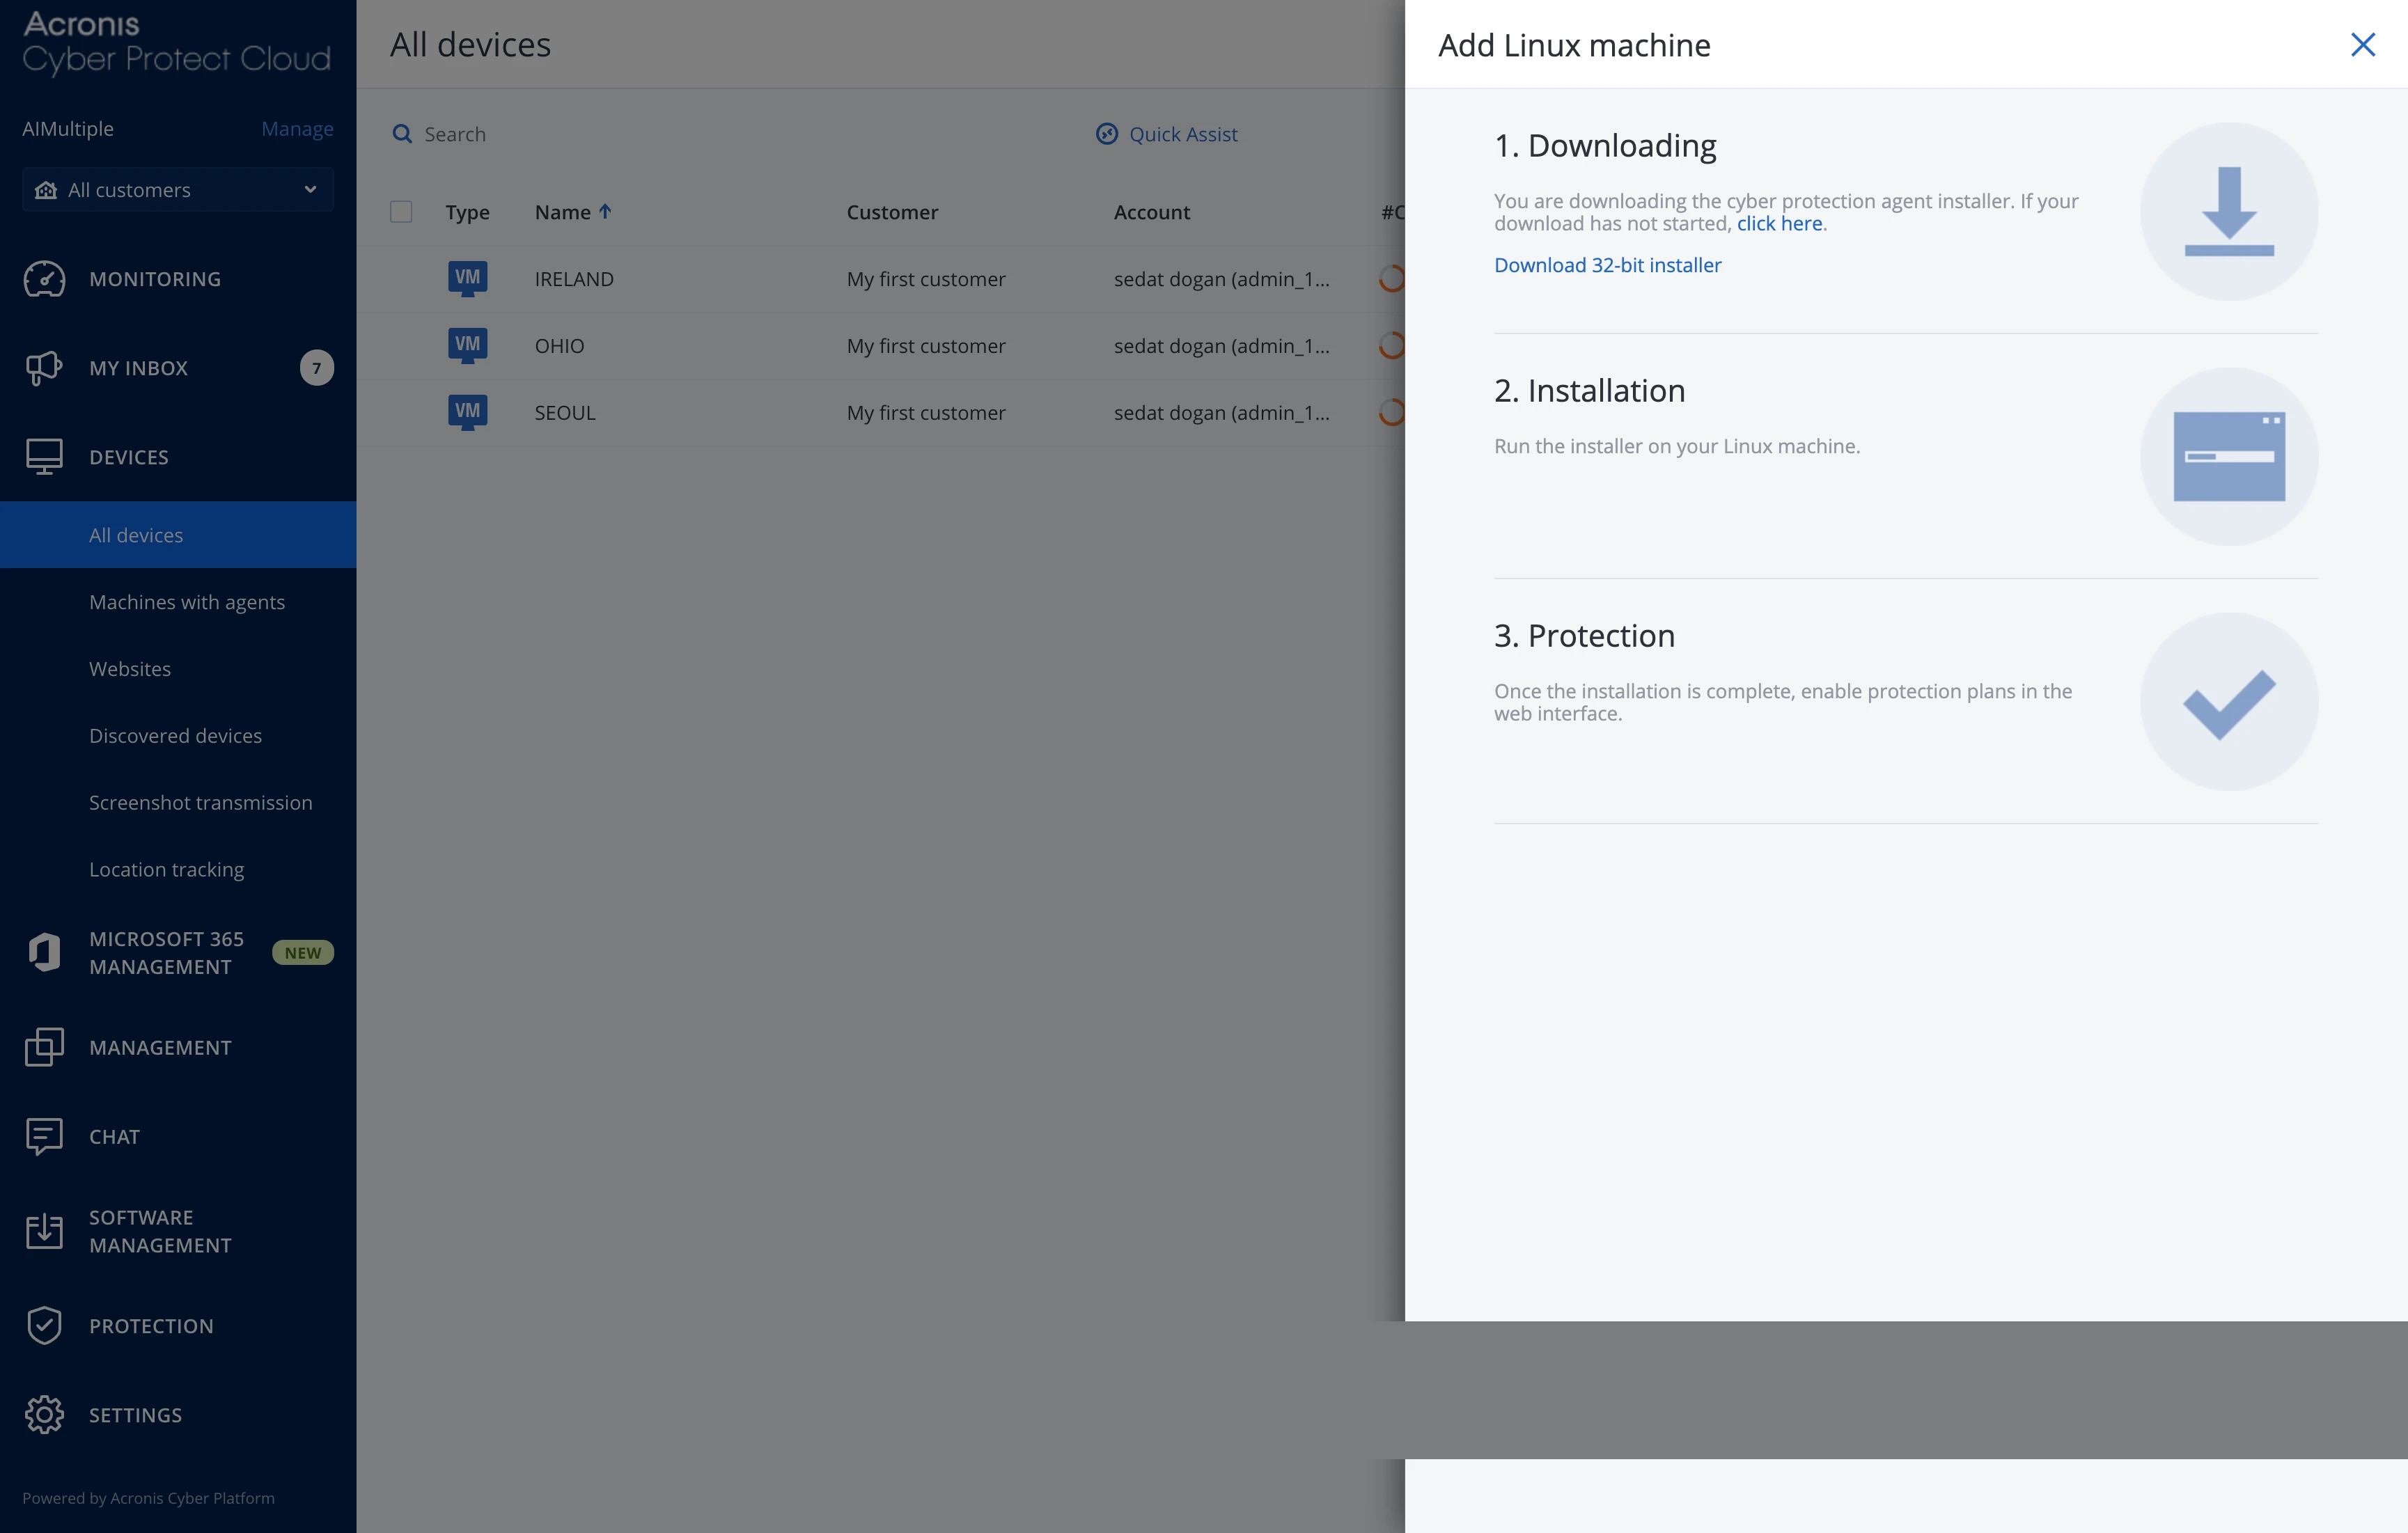
Linux agent selection triggered an automatic download rather than providing a copyable URL. Administrators managing Linux servers work from the CLI, not a browser GUI, so we had to extract the download link manually. No installation instructions appeared on the download page.
The installer is approximately 1.1GB. We changed server hostnames before running it since Acronis does not allow device renaming from the dashboard.
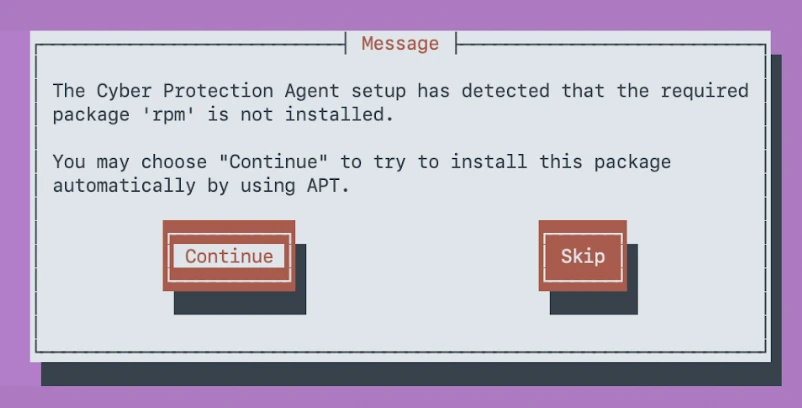
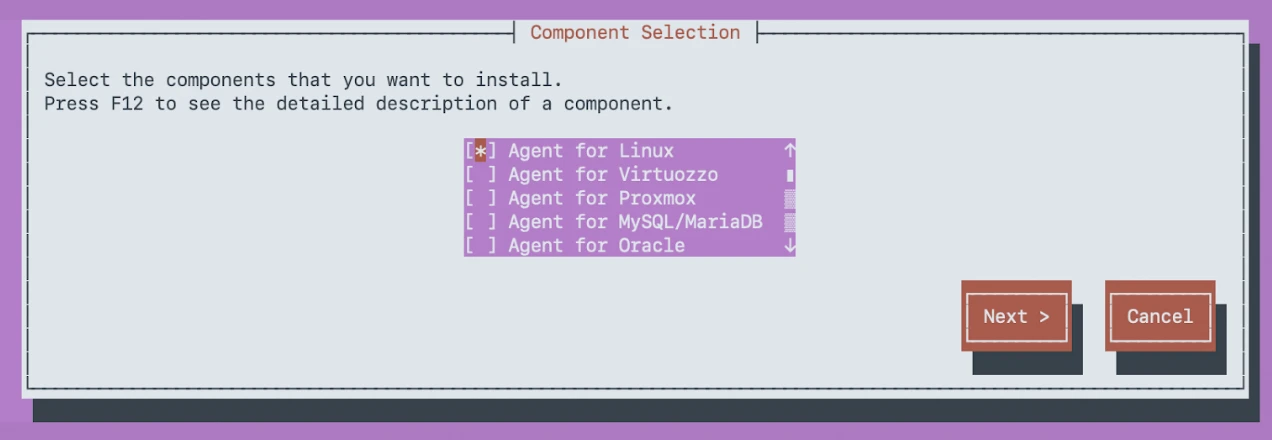
After running the installer, it flagged missing dependencies and prompted us to install them. We confirmed, and the platform proceeded to ask which agent infrastructure we wanted. We selected the Linux agent directly. The installer then downloaded and installed all required files sequentially.
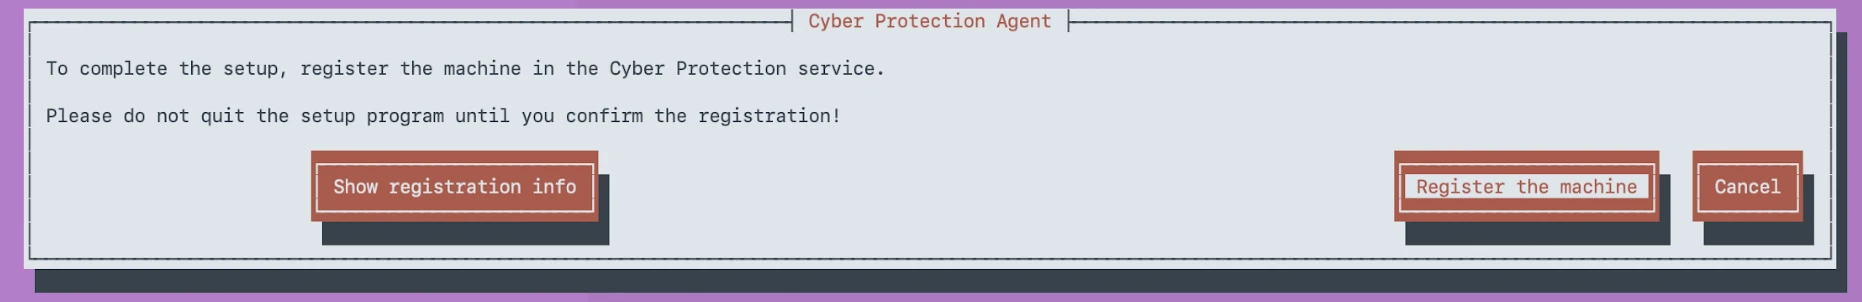
Once installation was completed, the platform prompted enrollment into Acronis. Clicking “Show registration info” displayed a URL and a registration code. We navigated to that URL, entered the code, and the platform located the server. We selected Complete Protection and finished the process.
Total installation time: 4 minutes. Download time: 3 minutes.
The dashboard showed all six devices (three Windows, three Linux) but provided no visual distinction between operating systems. NinjaOne displayed clear OS icons for each device. Acronis showed identical icons, requiring users to open device details to identify the operating system.
macOS Agent Installation
We downloaded the Mac installer and opened it.
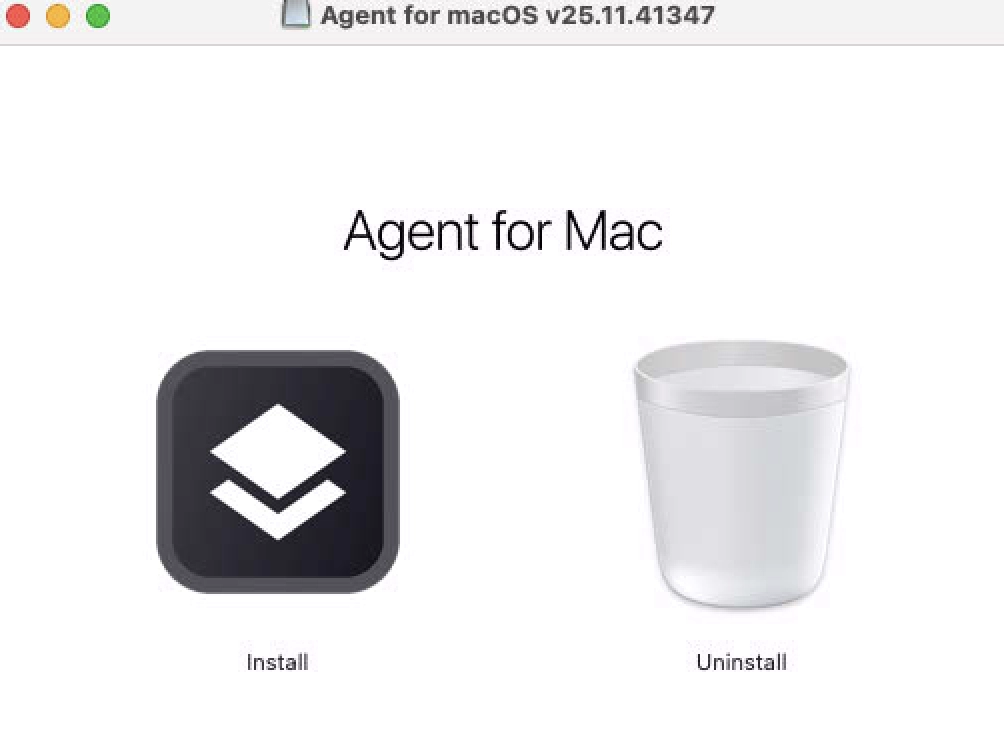
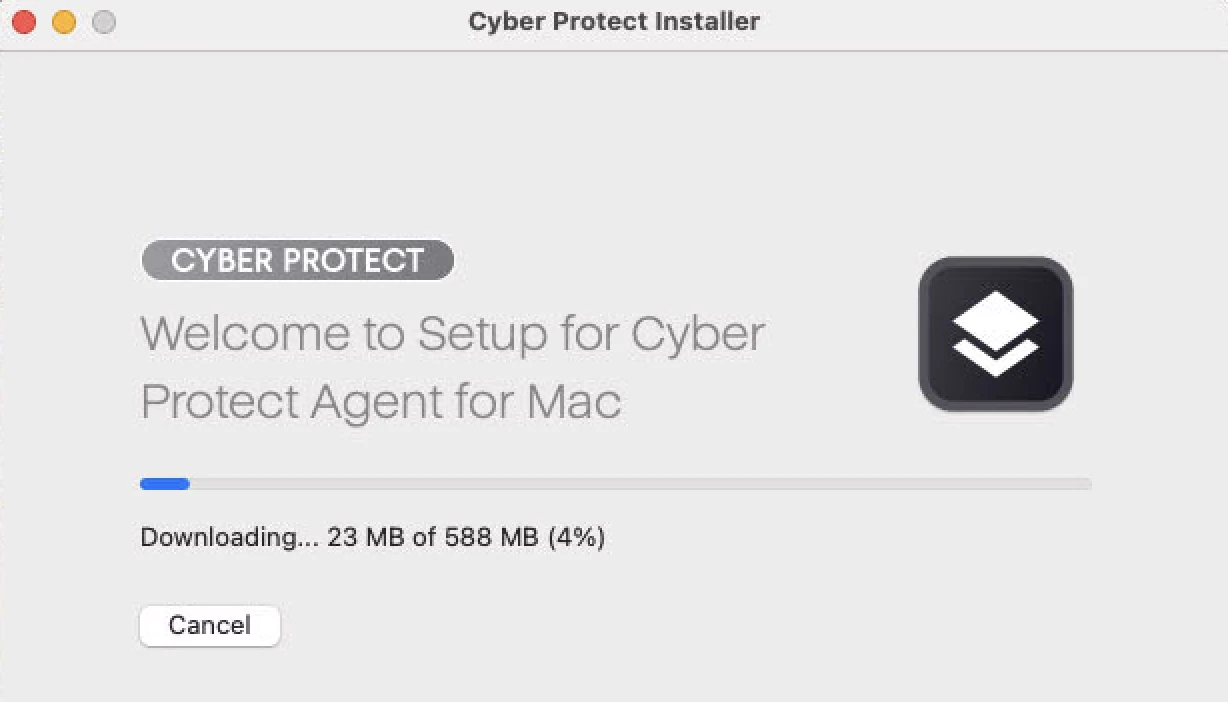
We clicked “Install” and watched the progress:
The installer downloaded 588MB of additional files during installation. Download speeds from Mumbai were extremely slow, likely due to limited CDN presence in the region. The download took 45 minutes to complete.
After installation finished, the agent prompted for workload registration. We completed web registration with the Complete Protection plan.
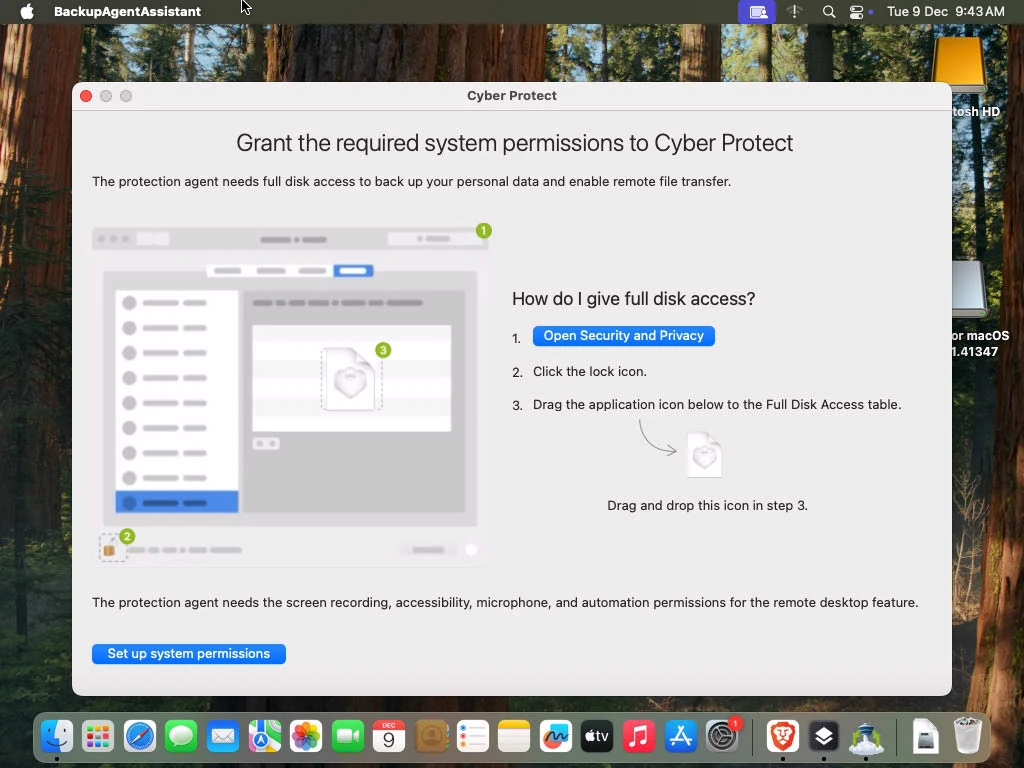
macOS requested extensive system permissions for the agent. We granted Full Disk Access, Accessibility, and other requested permissions:
After granting permissions, Acronis requested that we log into the Acronis account from the Mac itself. This behavior differed from Windows and Linux agents. The Mac agent functions more like a standalone portal application than a background monitoring agent. It added an icon to the dock and menu bar.
We declined to log in. The agent should operate like Windows and Linux versions without requiring local user authentication.
The device appeared in the dashboard. macOS showed a distinct Apple icon, making the operating system immediately visible. However, Windows and Linux devices still lacked clear OS identification. The “Backup” column showed an “OK” status for macOS, though we hadn’t configured backups yet, so it’s unclear why this appeared.
2. Dashboard & Monitoring Capabilities
Dashboard Features Comparison
Monitoring & Management Tools Comparison
1. NinjaOne
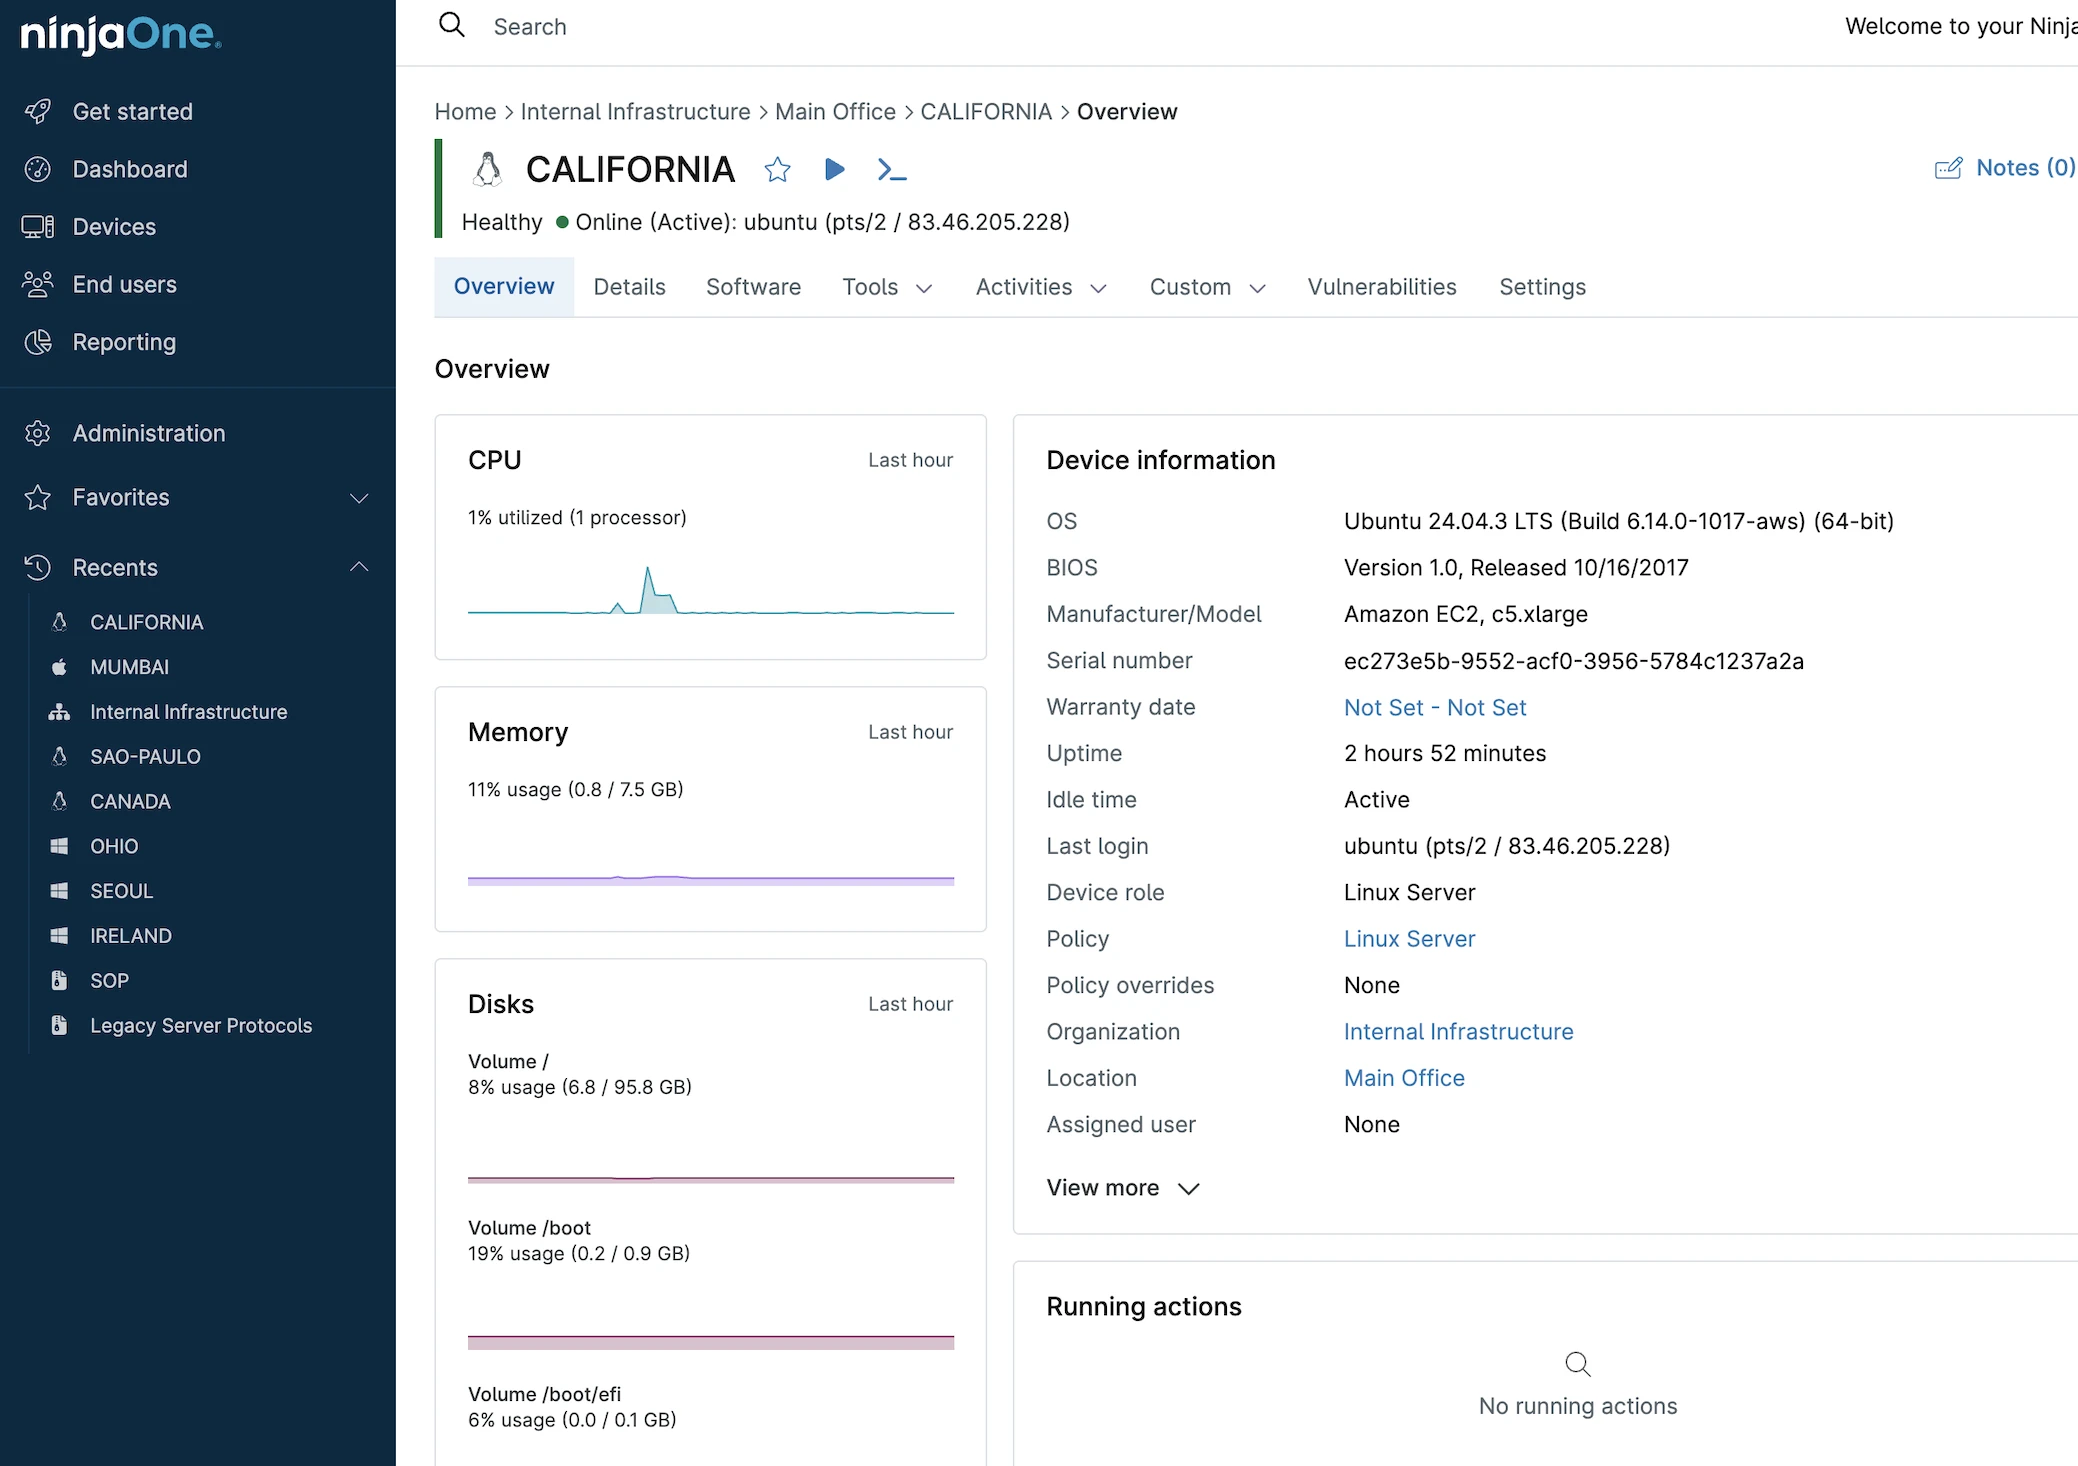
Clicking any device from the main list opened a detailed device view with multiple tabs across the top: Overview, Details, Software, Tools, Activities, Custom, Vulnerabilities, and Settings.
The Overview tab displayed essential information immediately:
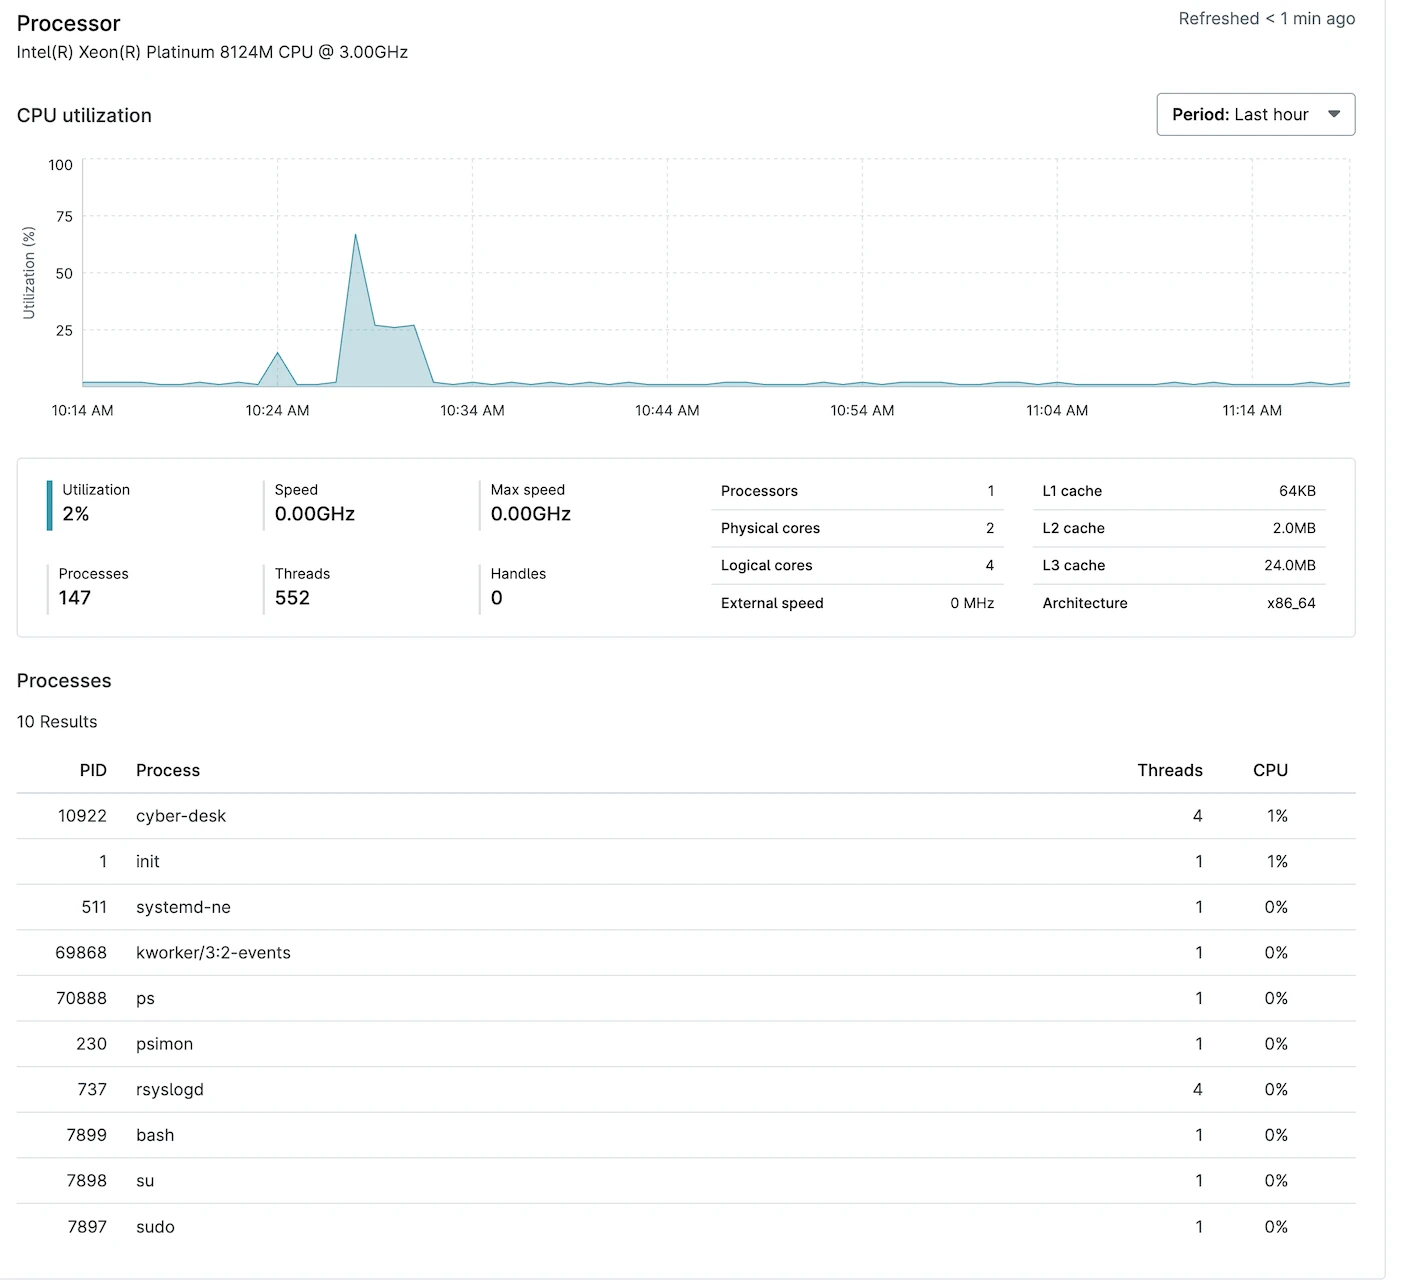
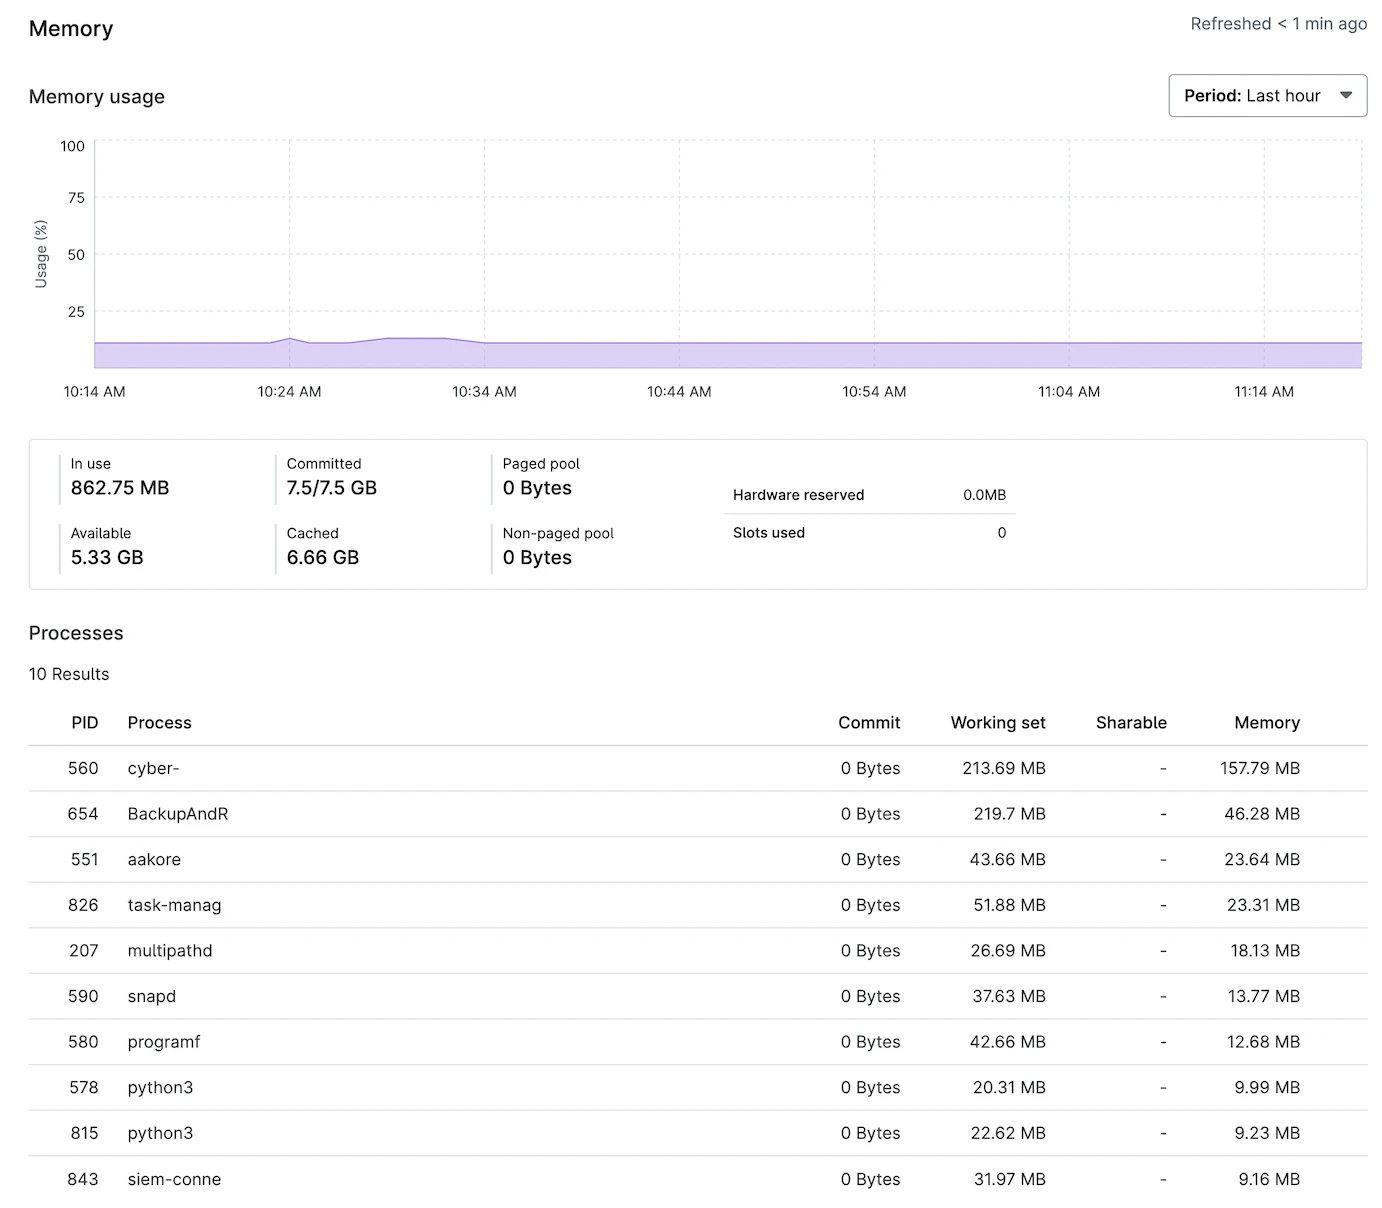
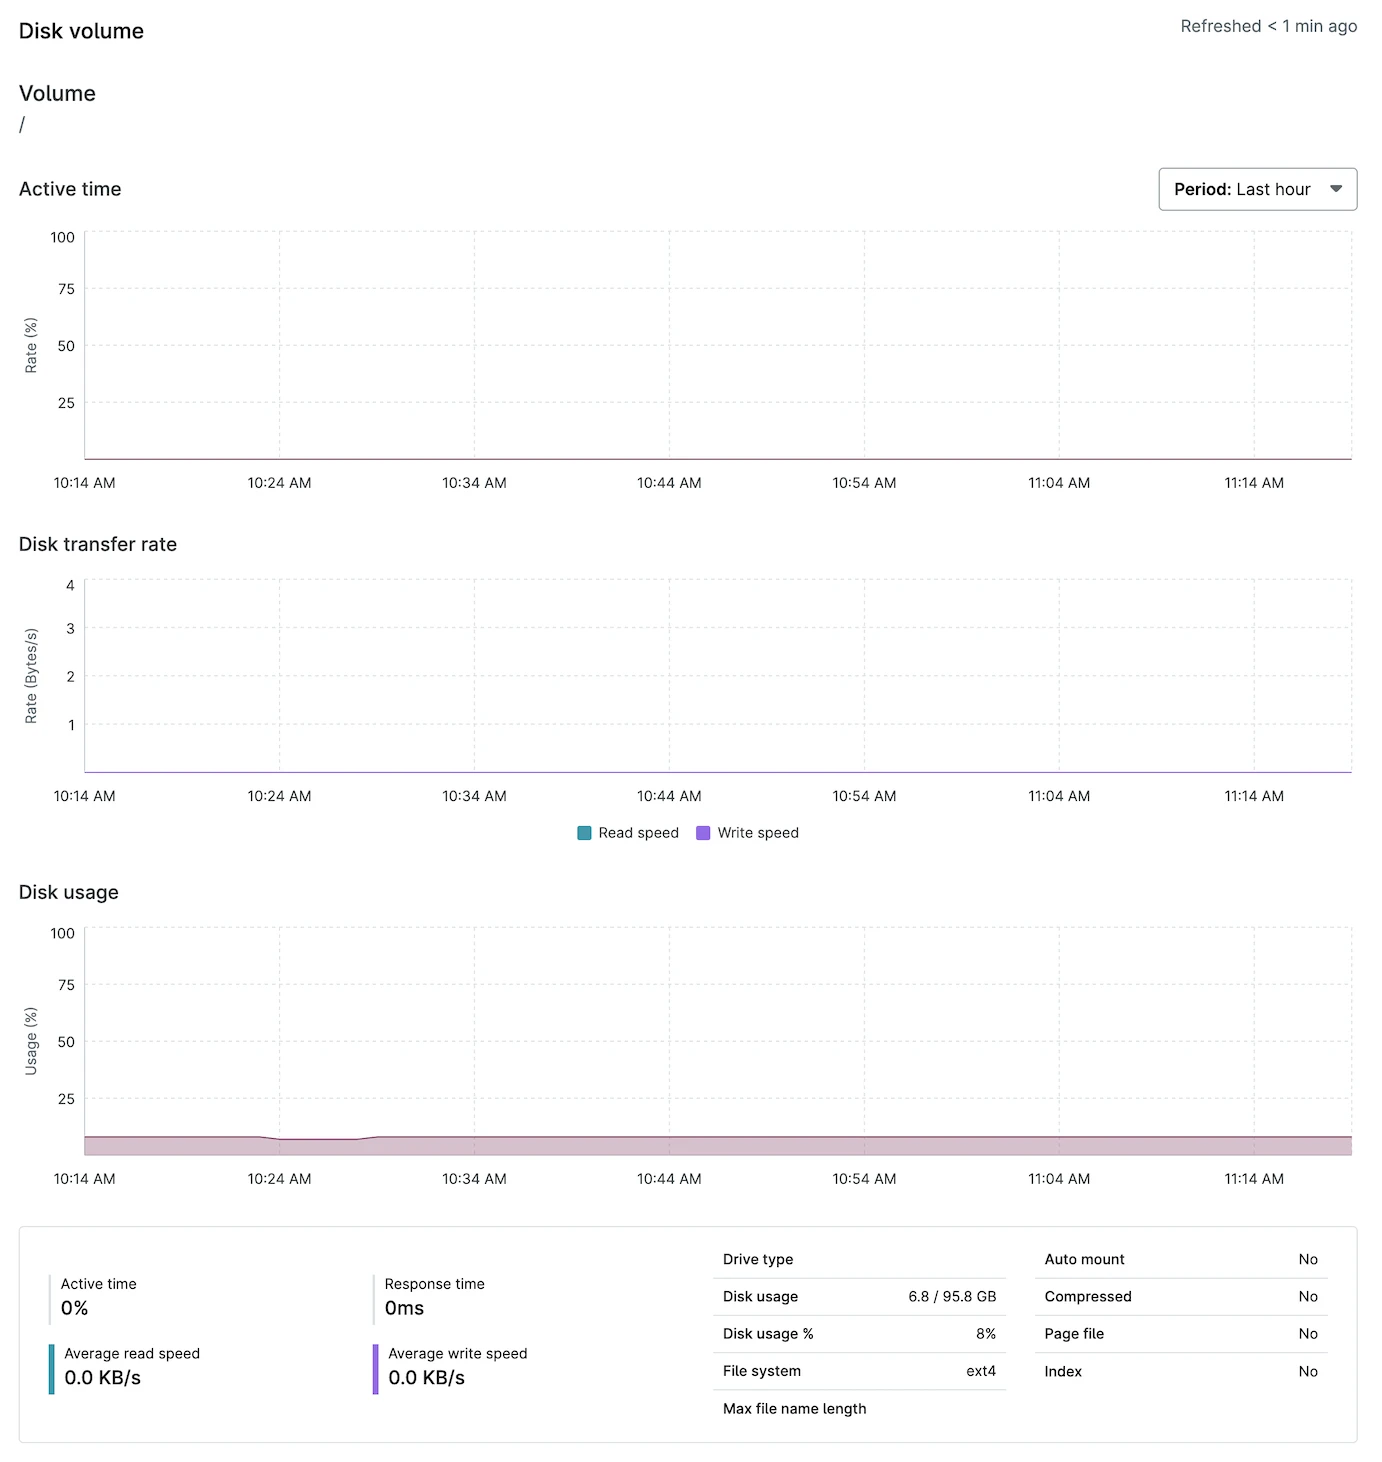
Real-Time Metrics: Four graphs showed current resource usage:
- CPU usage (10 minutes of history)
- Memory consumption (current usage vs total)
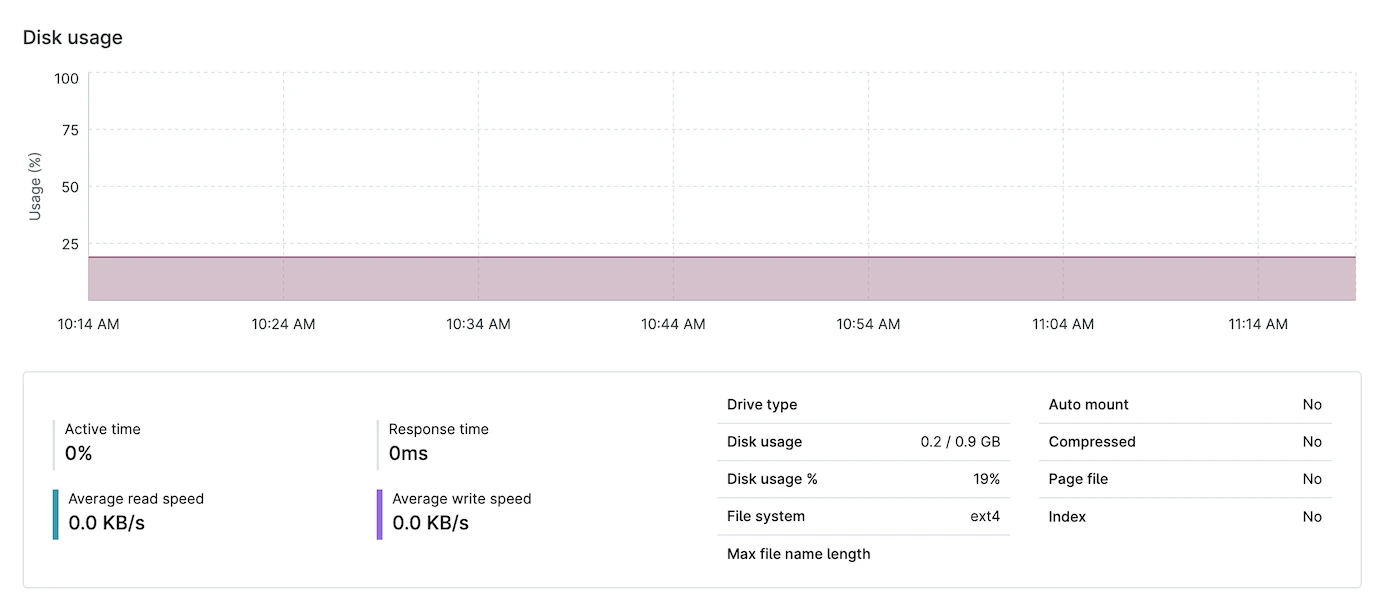
- Disk space (usage per volume)
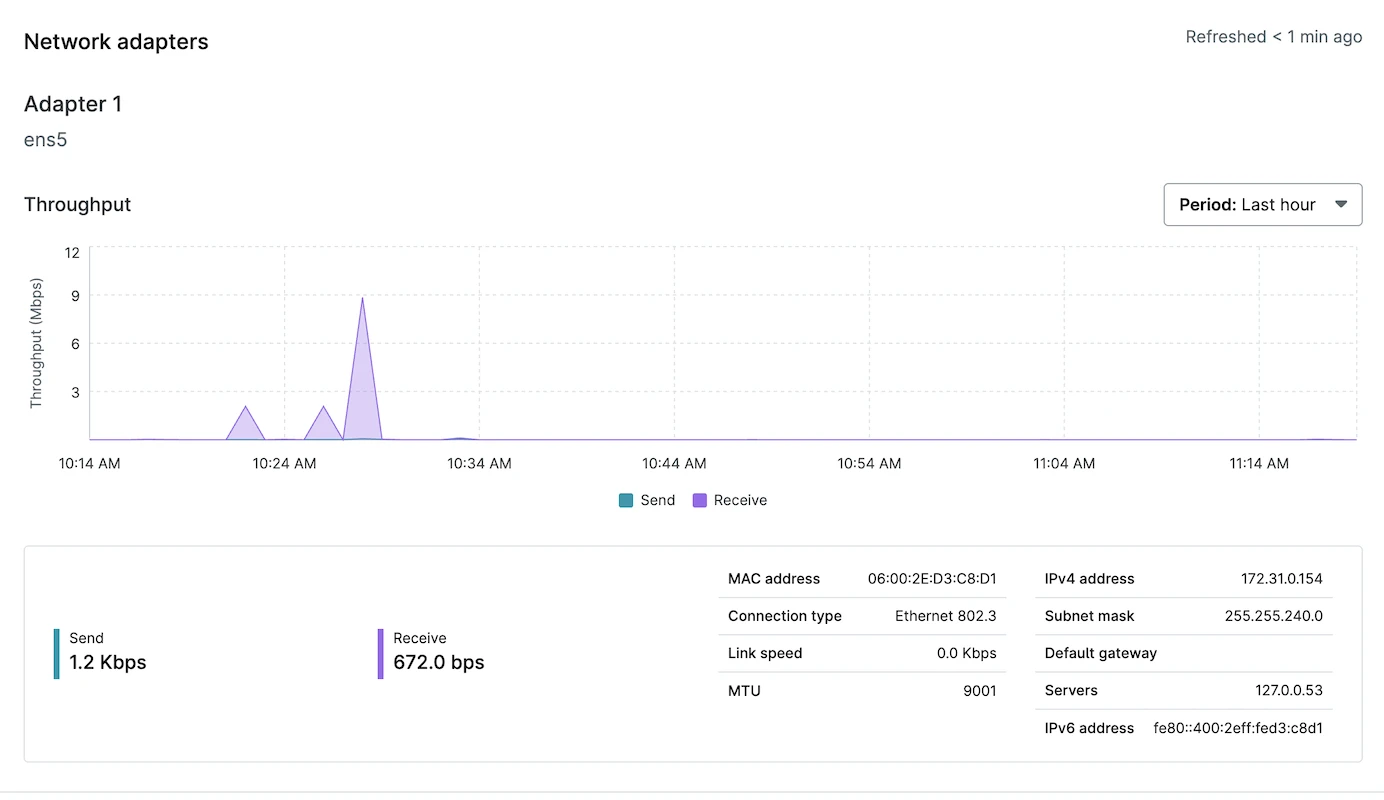
- Network activity (last hour)
Device Information Panel: The right column lists system details.
Health Status: A dedicated section flagged any system problems. Our fresh servers showed no issues, but this area would display driver warnings, disk space alerts, or service failures.
Recent Activities Log: The bottom portion showed timestamped server events:
- User logins and logouts
- Software installations
- OS updates
- User account changes
- System restarts
Each activity entry included the specific action, timestamp, and affected user or component.
Quick Actions: The page provided immediate access to everyday tasks without navigating away.
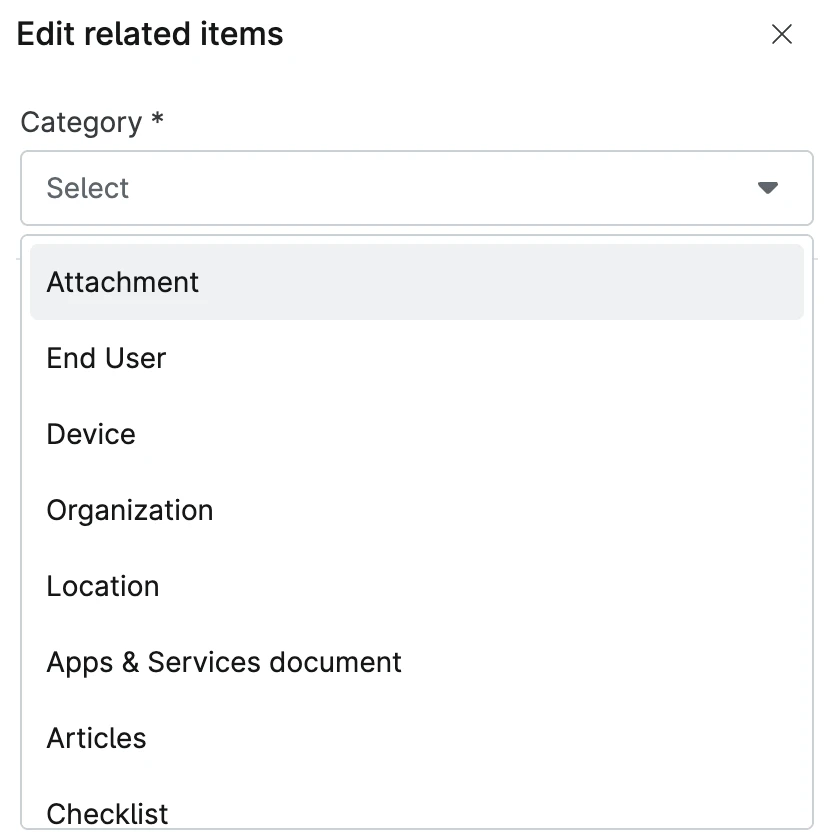
The “Related items” feature lets us link devices to other entities: attachments, end users, other devices, organizations, locations, apps & services, documents, articles, and checklists. This grouping helps organize complex infrastructure where multiple components work together.
Terminal Access
We clicked the terminal button to test command-line access. NinjaOne immediately prompted for 2FA verification proper security for privileged access.
After 2FA, a terminal window opened in the browser with several features:
- Virtual keyboard (useful for special characters)
- Download/copy output buttons
- User selection dropdown
On Linux, we could choose between root and standard user access. On Windows, NinjaOne offered more granular options:
- CMD (32-bit or 64-bit)
- PowerShell (32-bit or 64-bit)
- System user or currently logged-in user
This terminal flexibility exceeded our expectations. Most RMM platforms offer a single terminal type per OS.
Details Tab
The Details tab displayed comprehensive system specifications organized into expandable sections.
Time-frame selector options appeared at the top:
- Last hour
- 24 hours
- 7 days
- 30 days
- 90 days
No custom date range option existed—a minor limitation when investigating issues that occurred at specific known times.
The Details tab sections included:
CPU Information:
- Processor model and specifications
- Core count and speed
- Current temperature
- Usage graphs over selected timeframe
Memory:
- Total and available RAM
- Usage patterns over time
- Memory type and speed
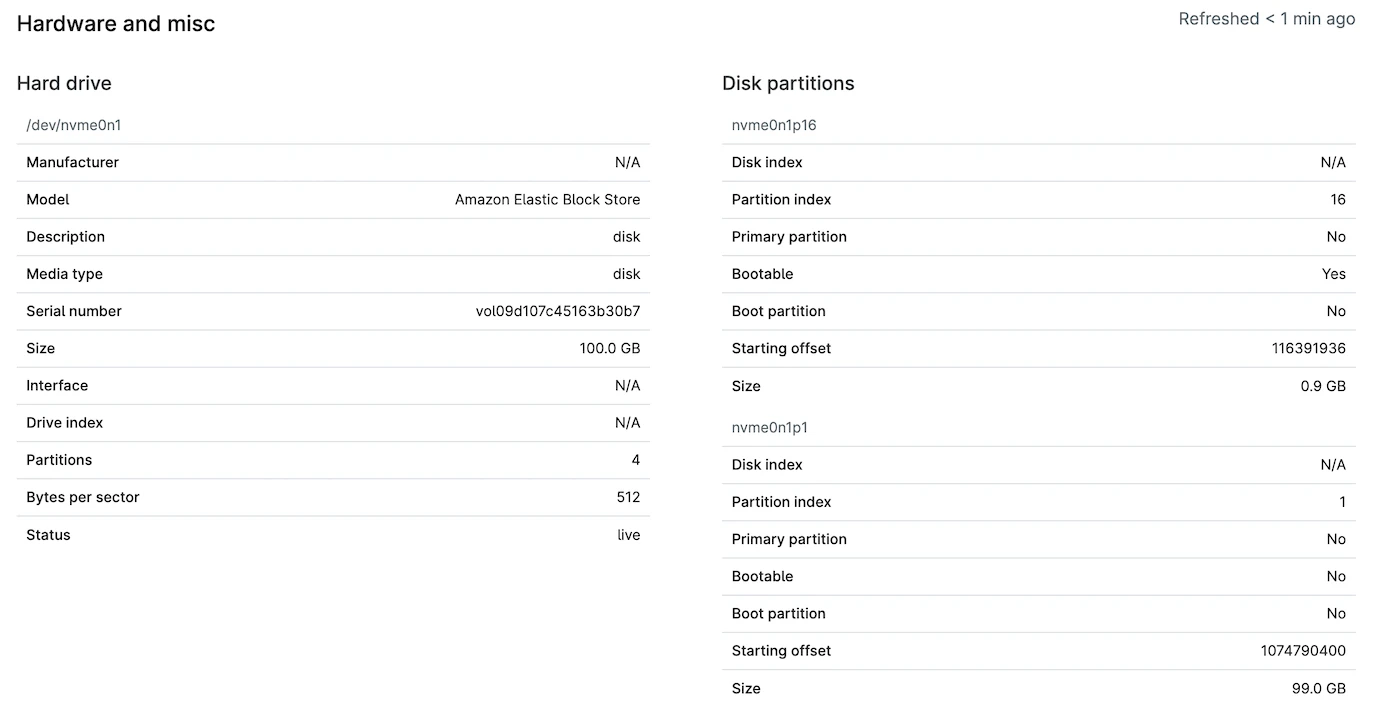
Disk:
- All volumes with capacity and free space
- I/O metrics and throughput graphs
- SMART health status
Network:
- All adapters with IP addresses and MAC addresses
- Bandwidth usage graphs
- Active connections
BIOS/UEFI:
- Firmware version and date
Open Ports: A dedicated section listed every listening port with the associated process name. We saw port 22 (SSH), port 3389 (RDP on Windows servers), and AWS management services. This visibility helps identify unexpected services or security concerns. We haven’t seen this feature in other RMM platforms.
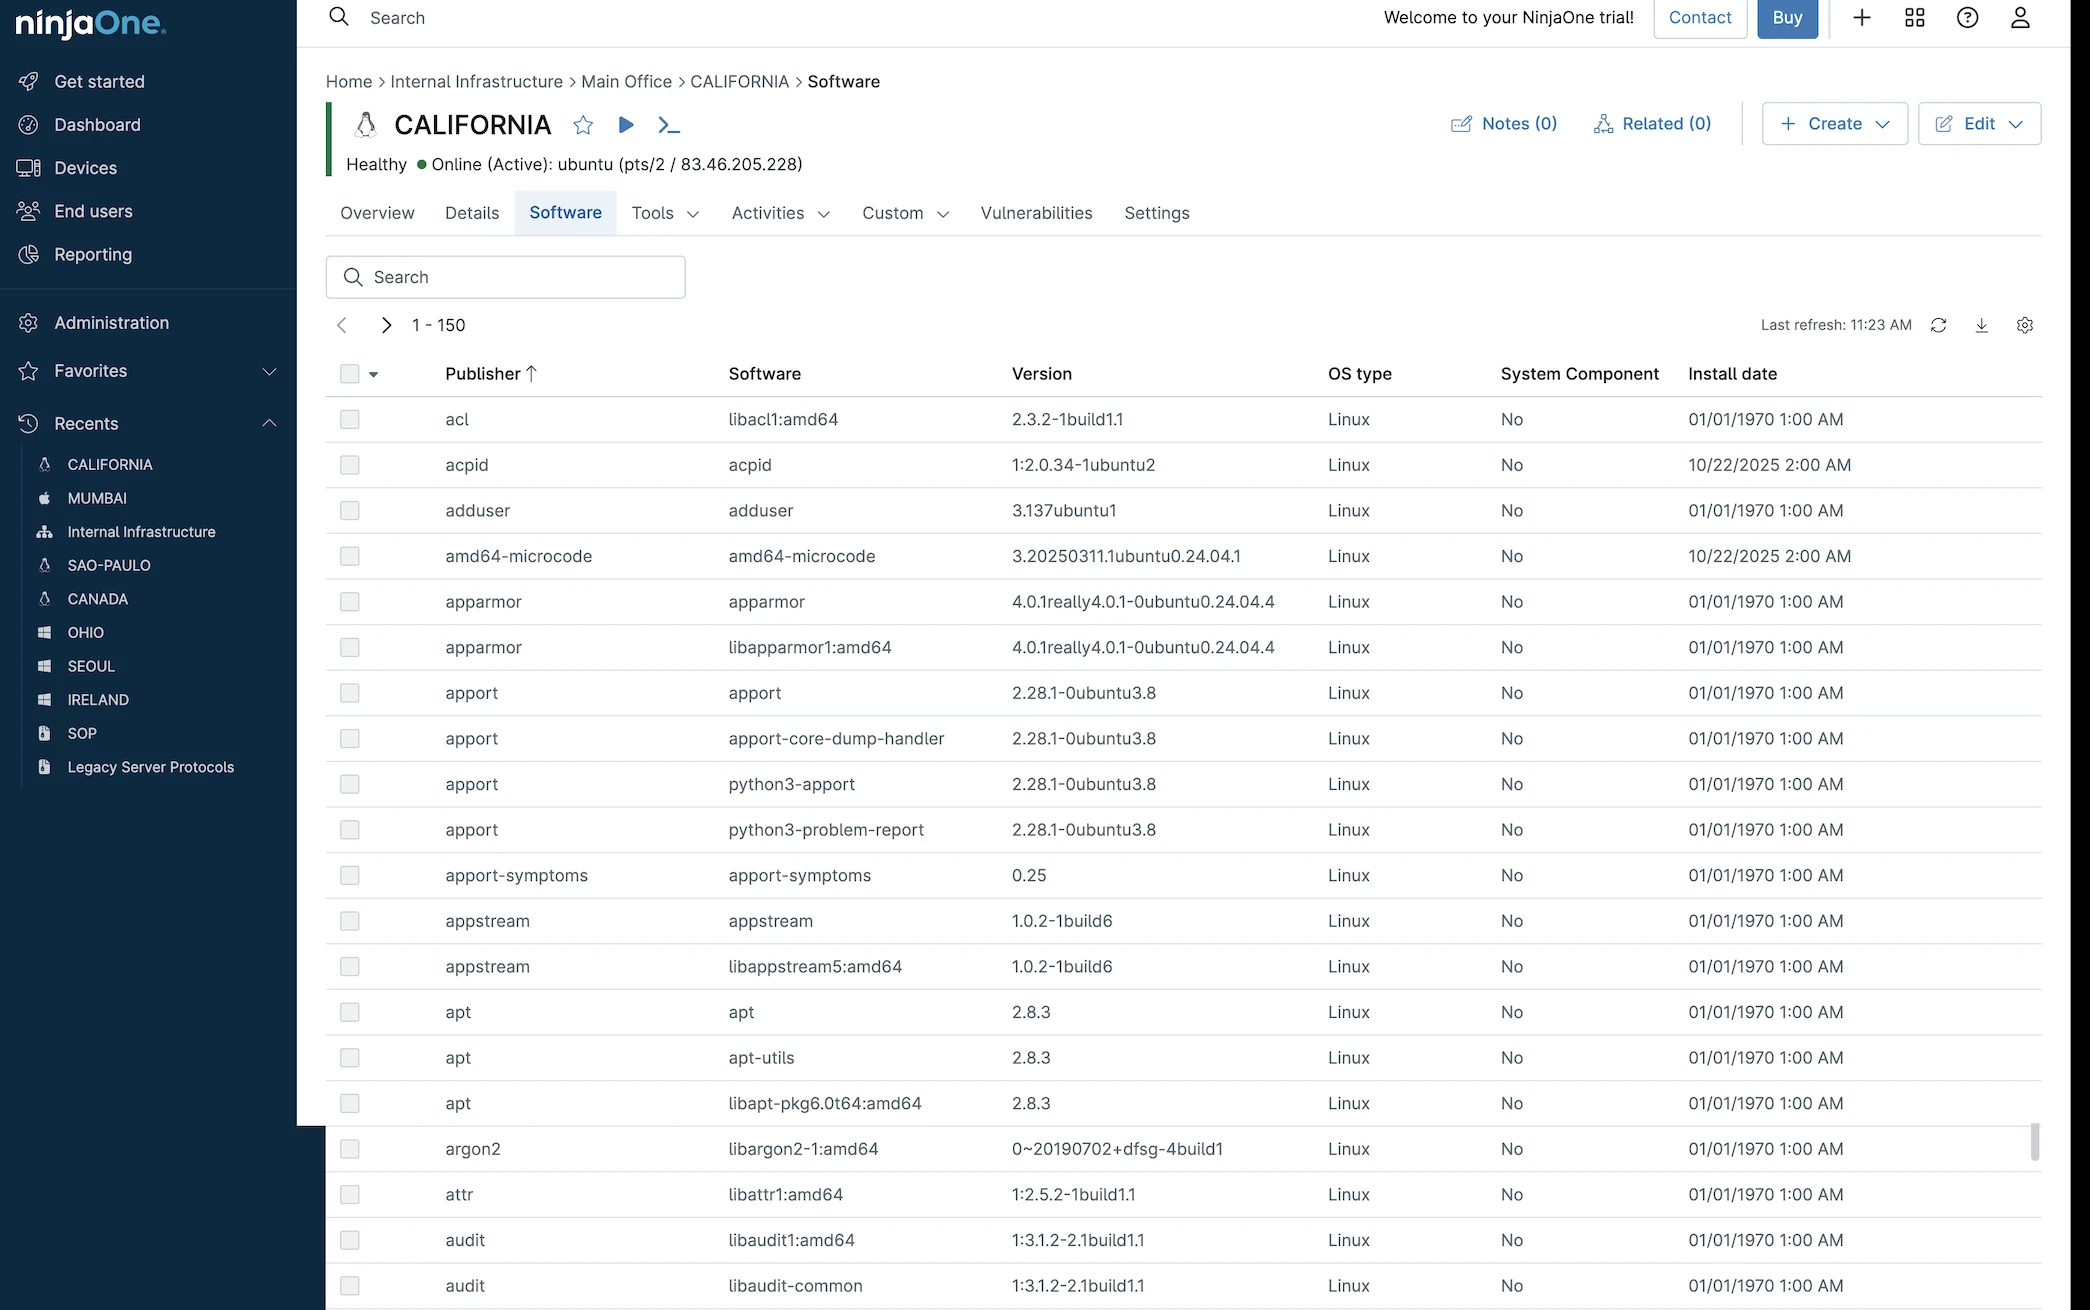
Software Tab
The Software tab listed all installed applications and services, with full search capability.
Sortable columns included:
- Application name
- Version
- Publisher
- Installation date
- Size
Sorting by installation date helps spot recently added software during security audits. We quickly identified when the NinjaOne agent itself was installed, along with any subsequent changes.
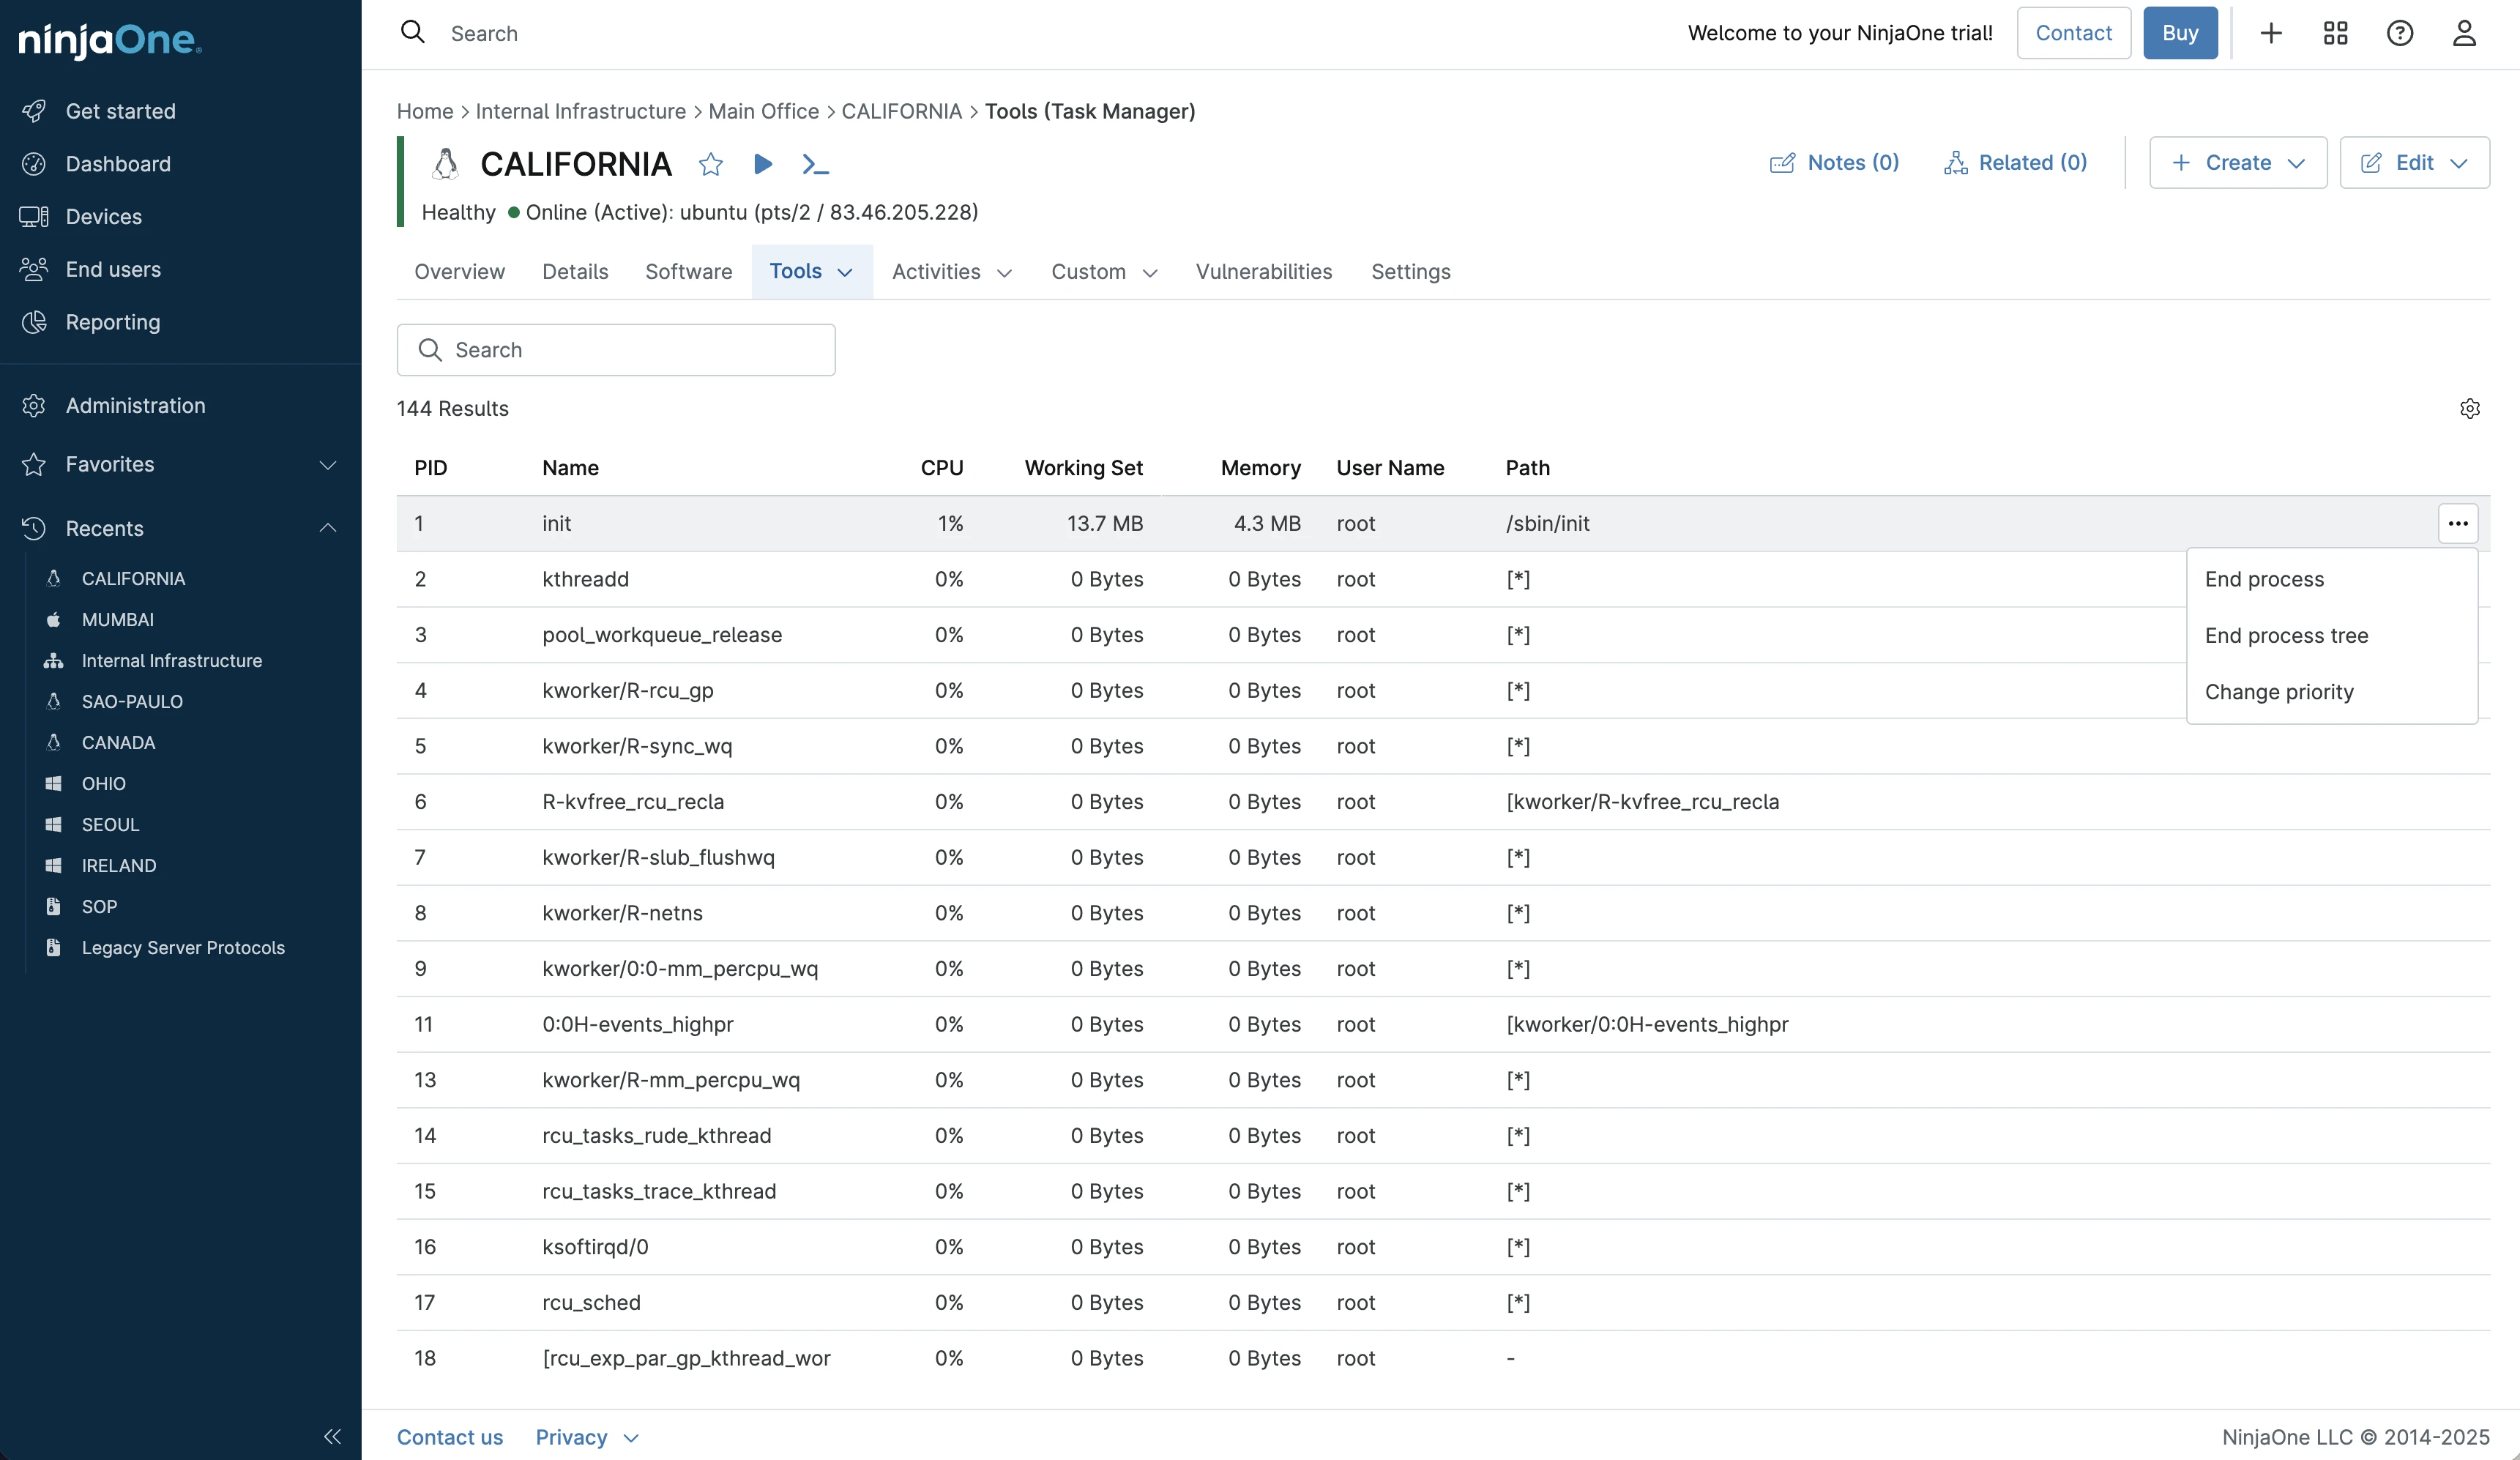
Tools Tab
The Tools tab contained four powerful remote management features that replicate local system administration.
- Task Manager
The Task Manager view displayed all running processes with real-time resource consumption. We could:
- Search for specific processes
- Sort by CPU, Memory, or Disk usage
- Select any process and terminate it
- Change process priority
This replicated Windows Task Manager and Linux top command functionality through the web interface. We tested terminating a non-critical process and it stopped immediately.
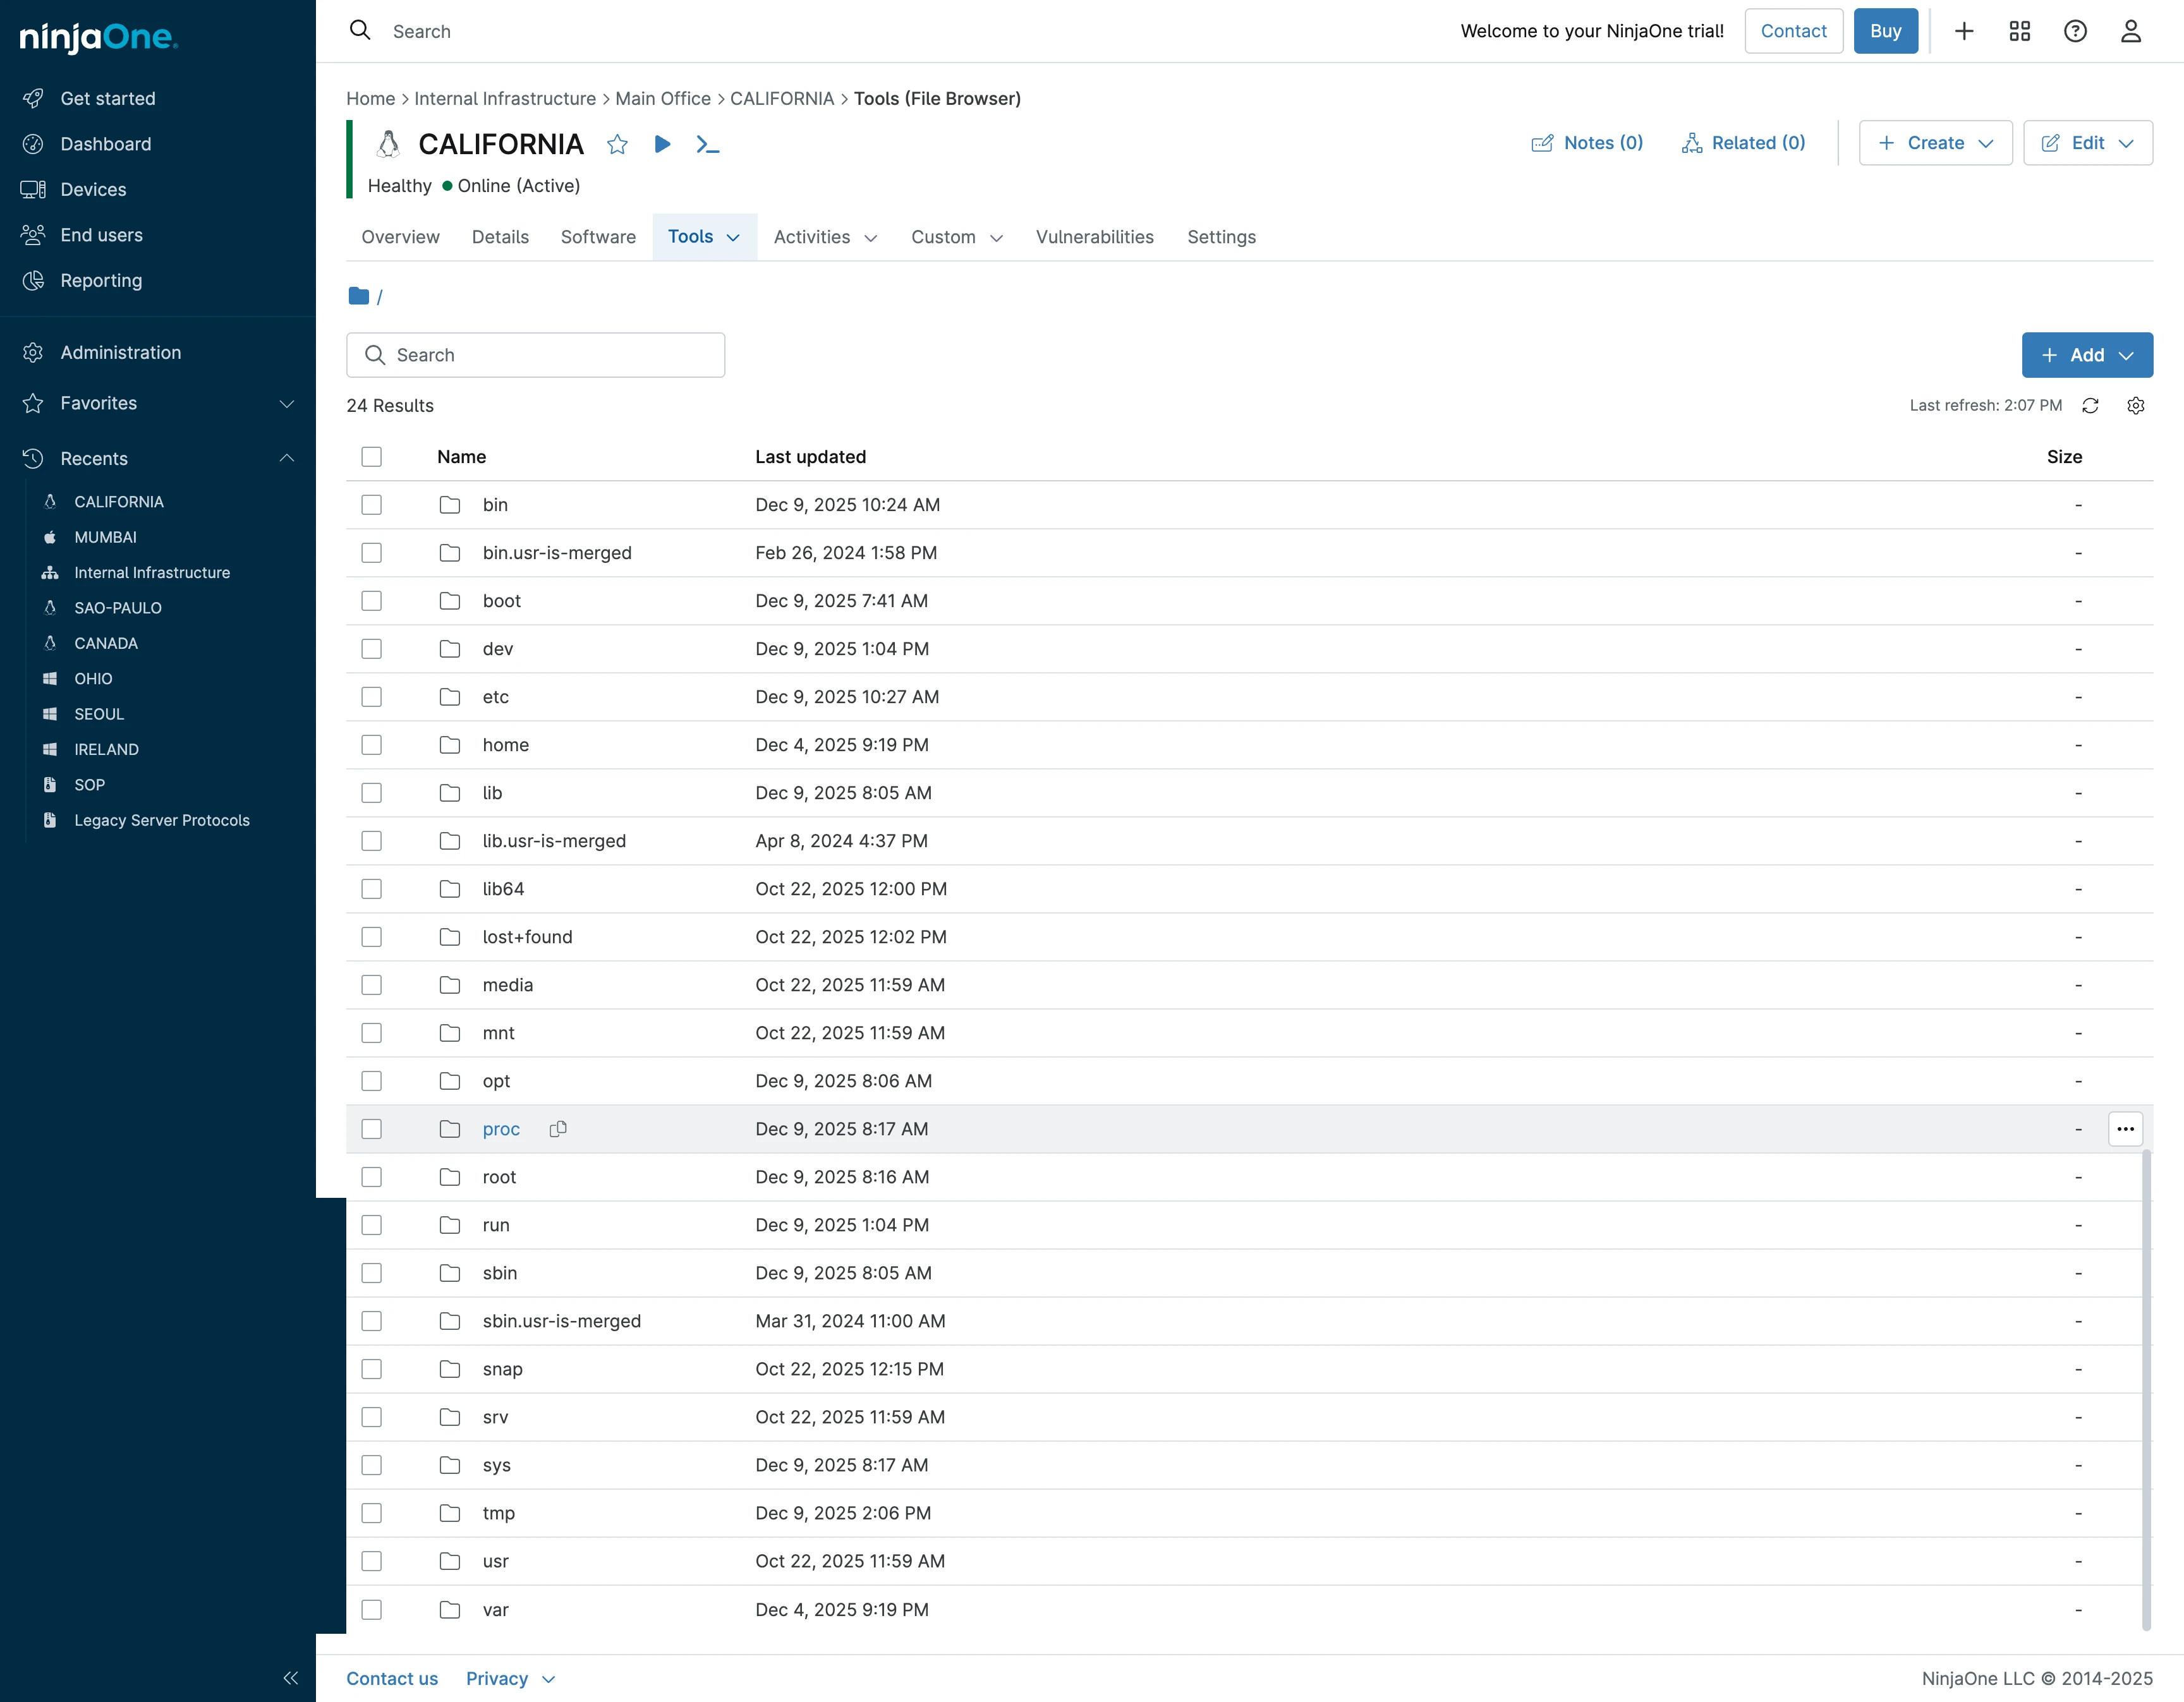
2. File Browser
The File Browser provided complete access to the filesystem. We navigated to the root directory (/) and saw all 24 system directories: bin, boot, dev, etc, home, lib, and others.
Available operations:
- Navigate any directory
- Download files
- Upload files
- Rename files and folders
- Delete items
- Create new folders
We tested uploading a file it appeared in the target directory instantly. This eliminates the need for separate SFTP/RDP connections when grabbing log files or uploading configurations.
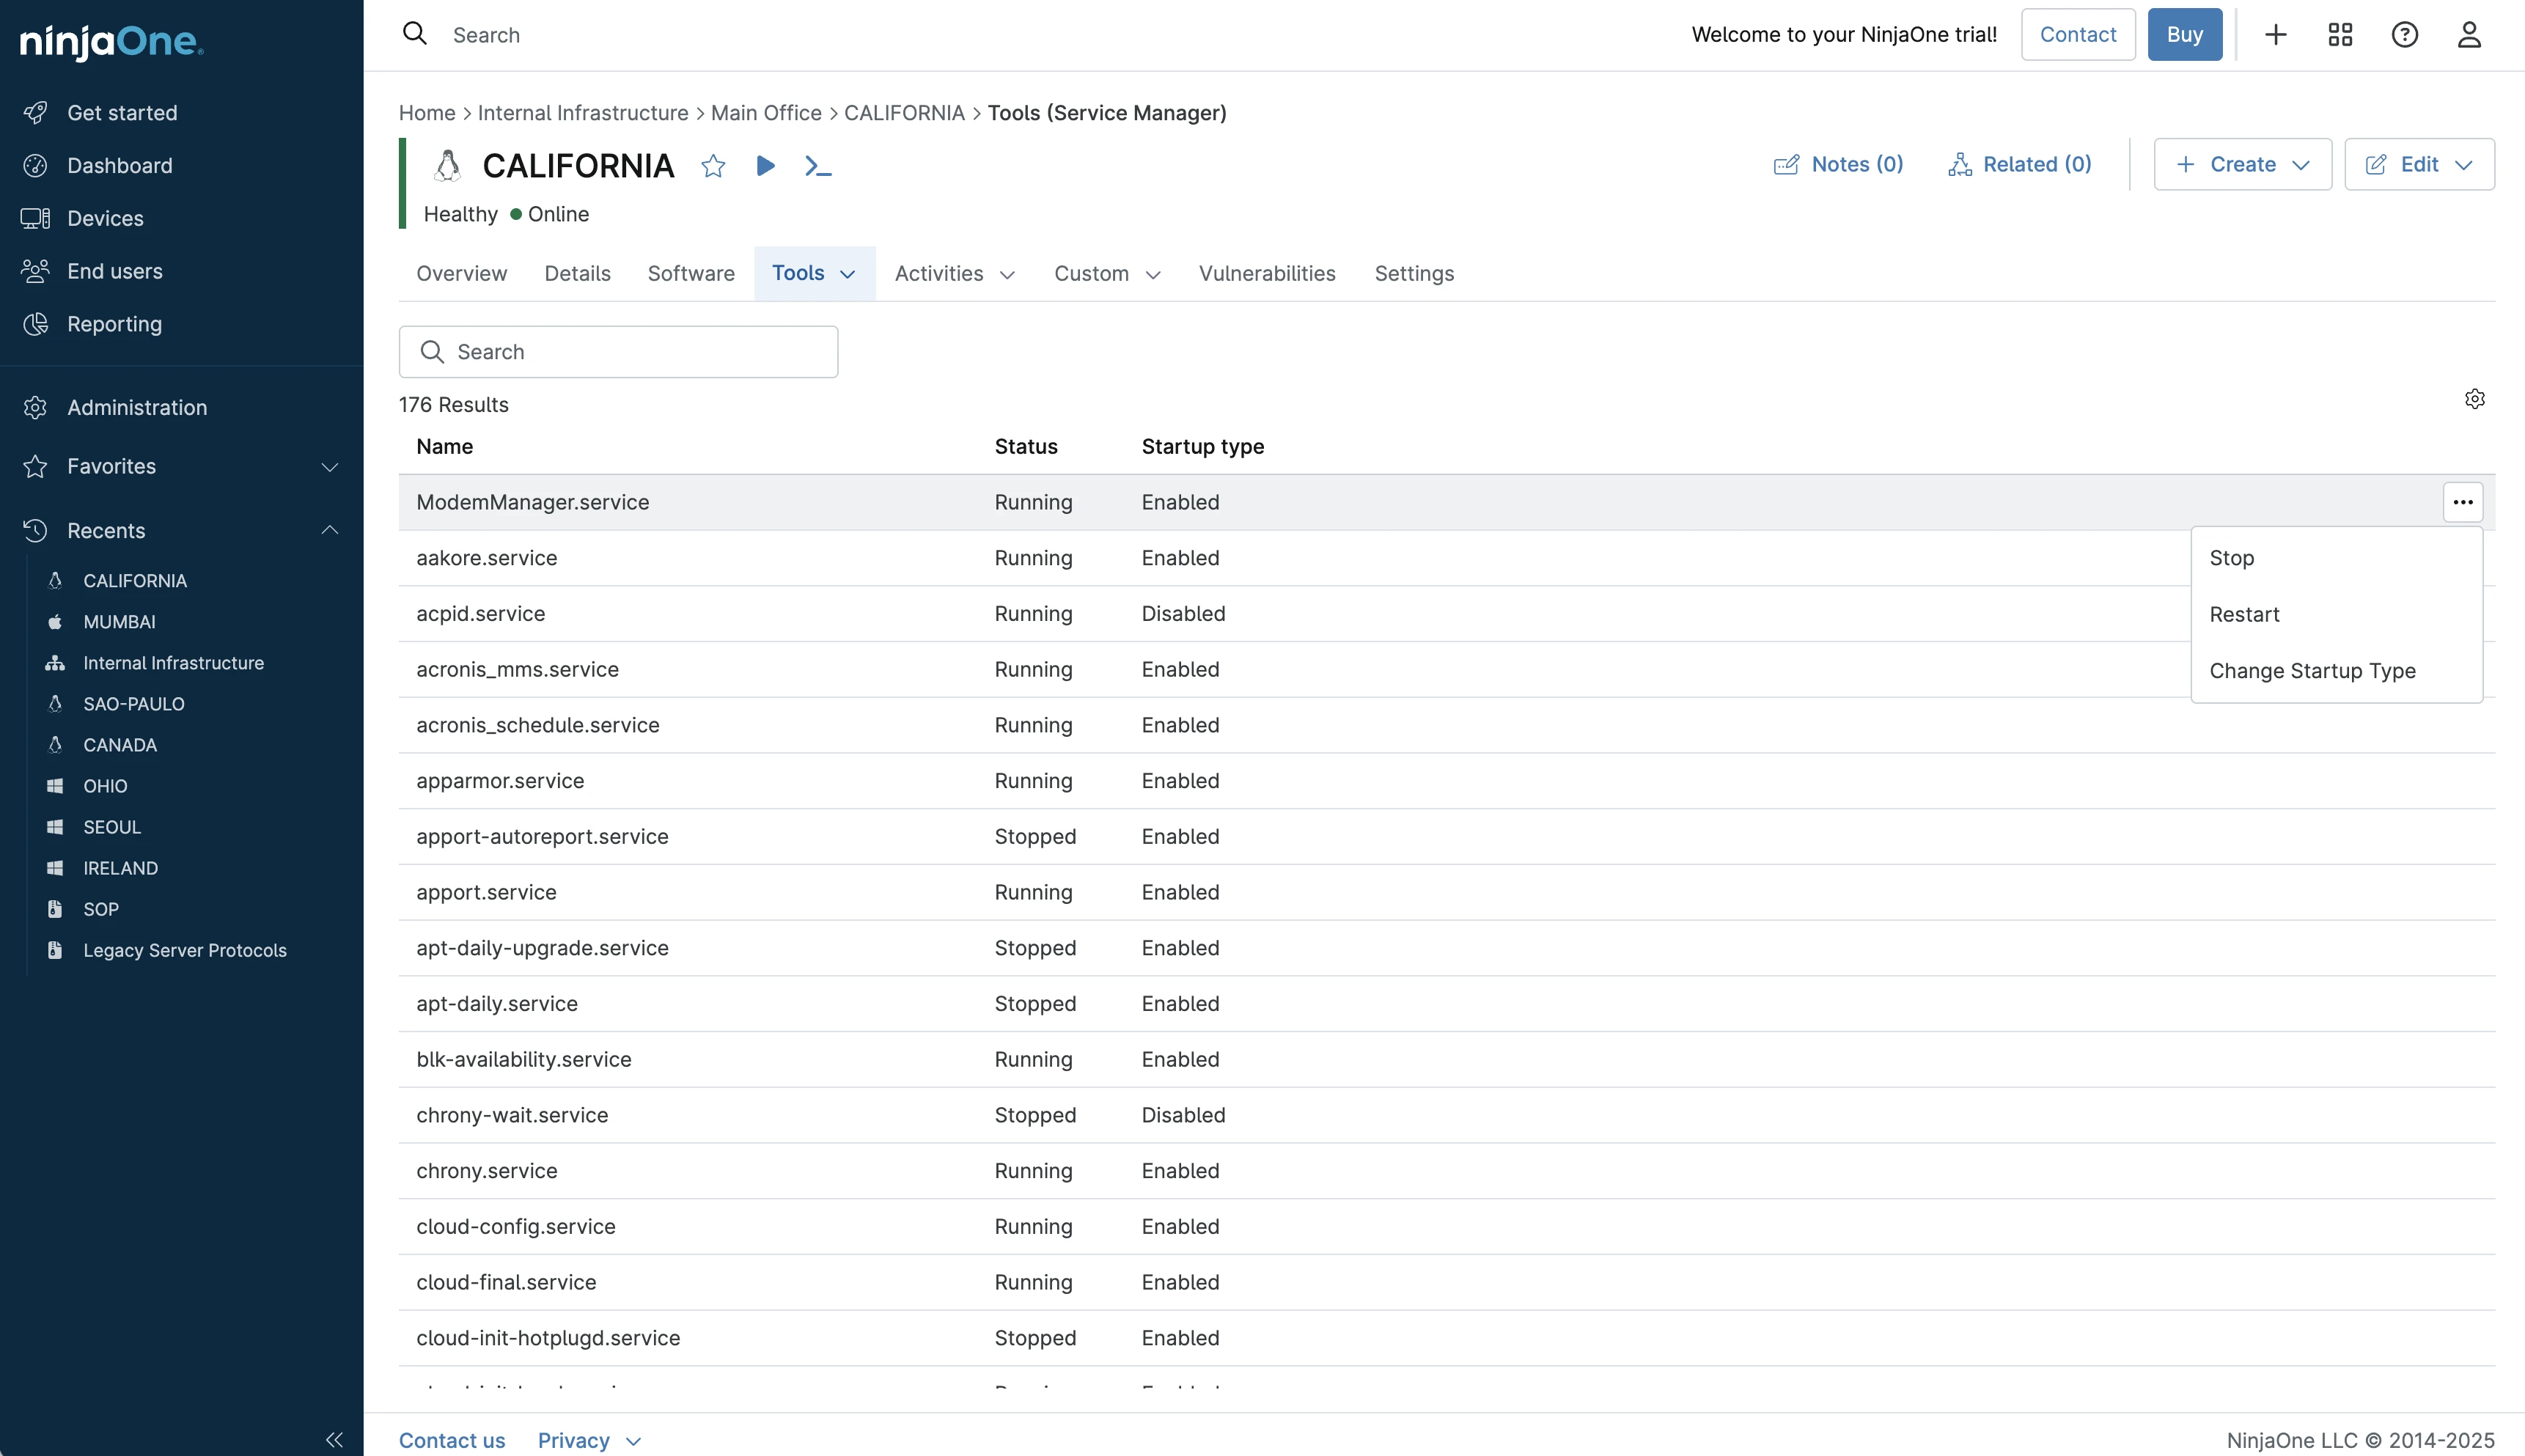
3. Service Manager
The Service Manager listed all 176 system services, including their current status and startup configuration. For each service:
- View current status (Running, Stopped)
- Start or stop services
- Restart services
- Change startup type (Automatic, Manual, Disabled)
We tested stopping and restarting a non-critical service. Changes are applied within seconds with status updates reflecting the new state.
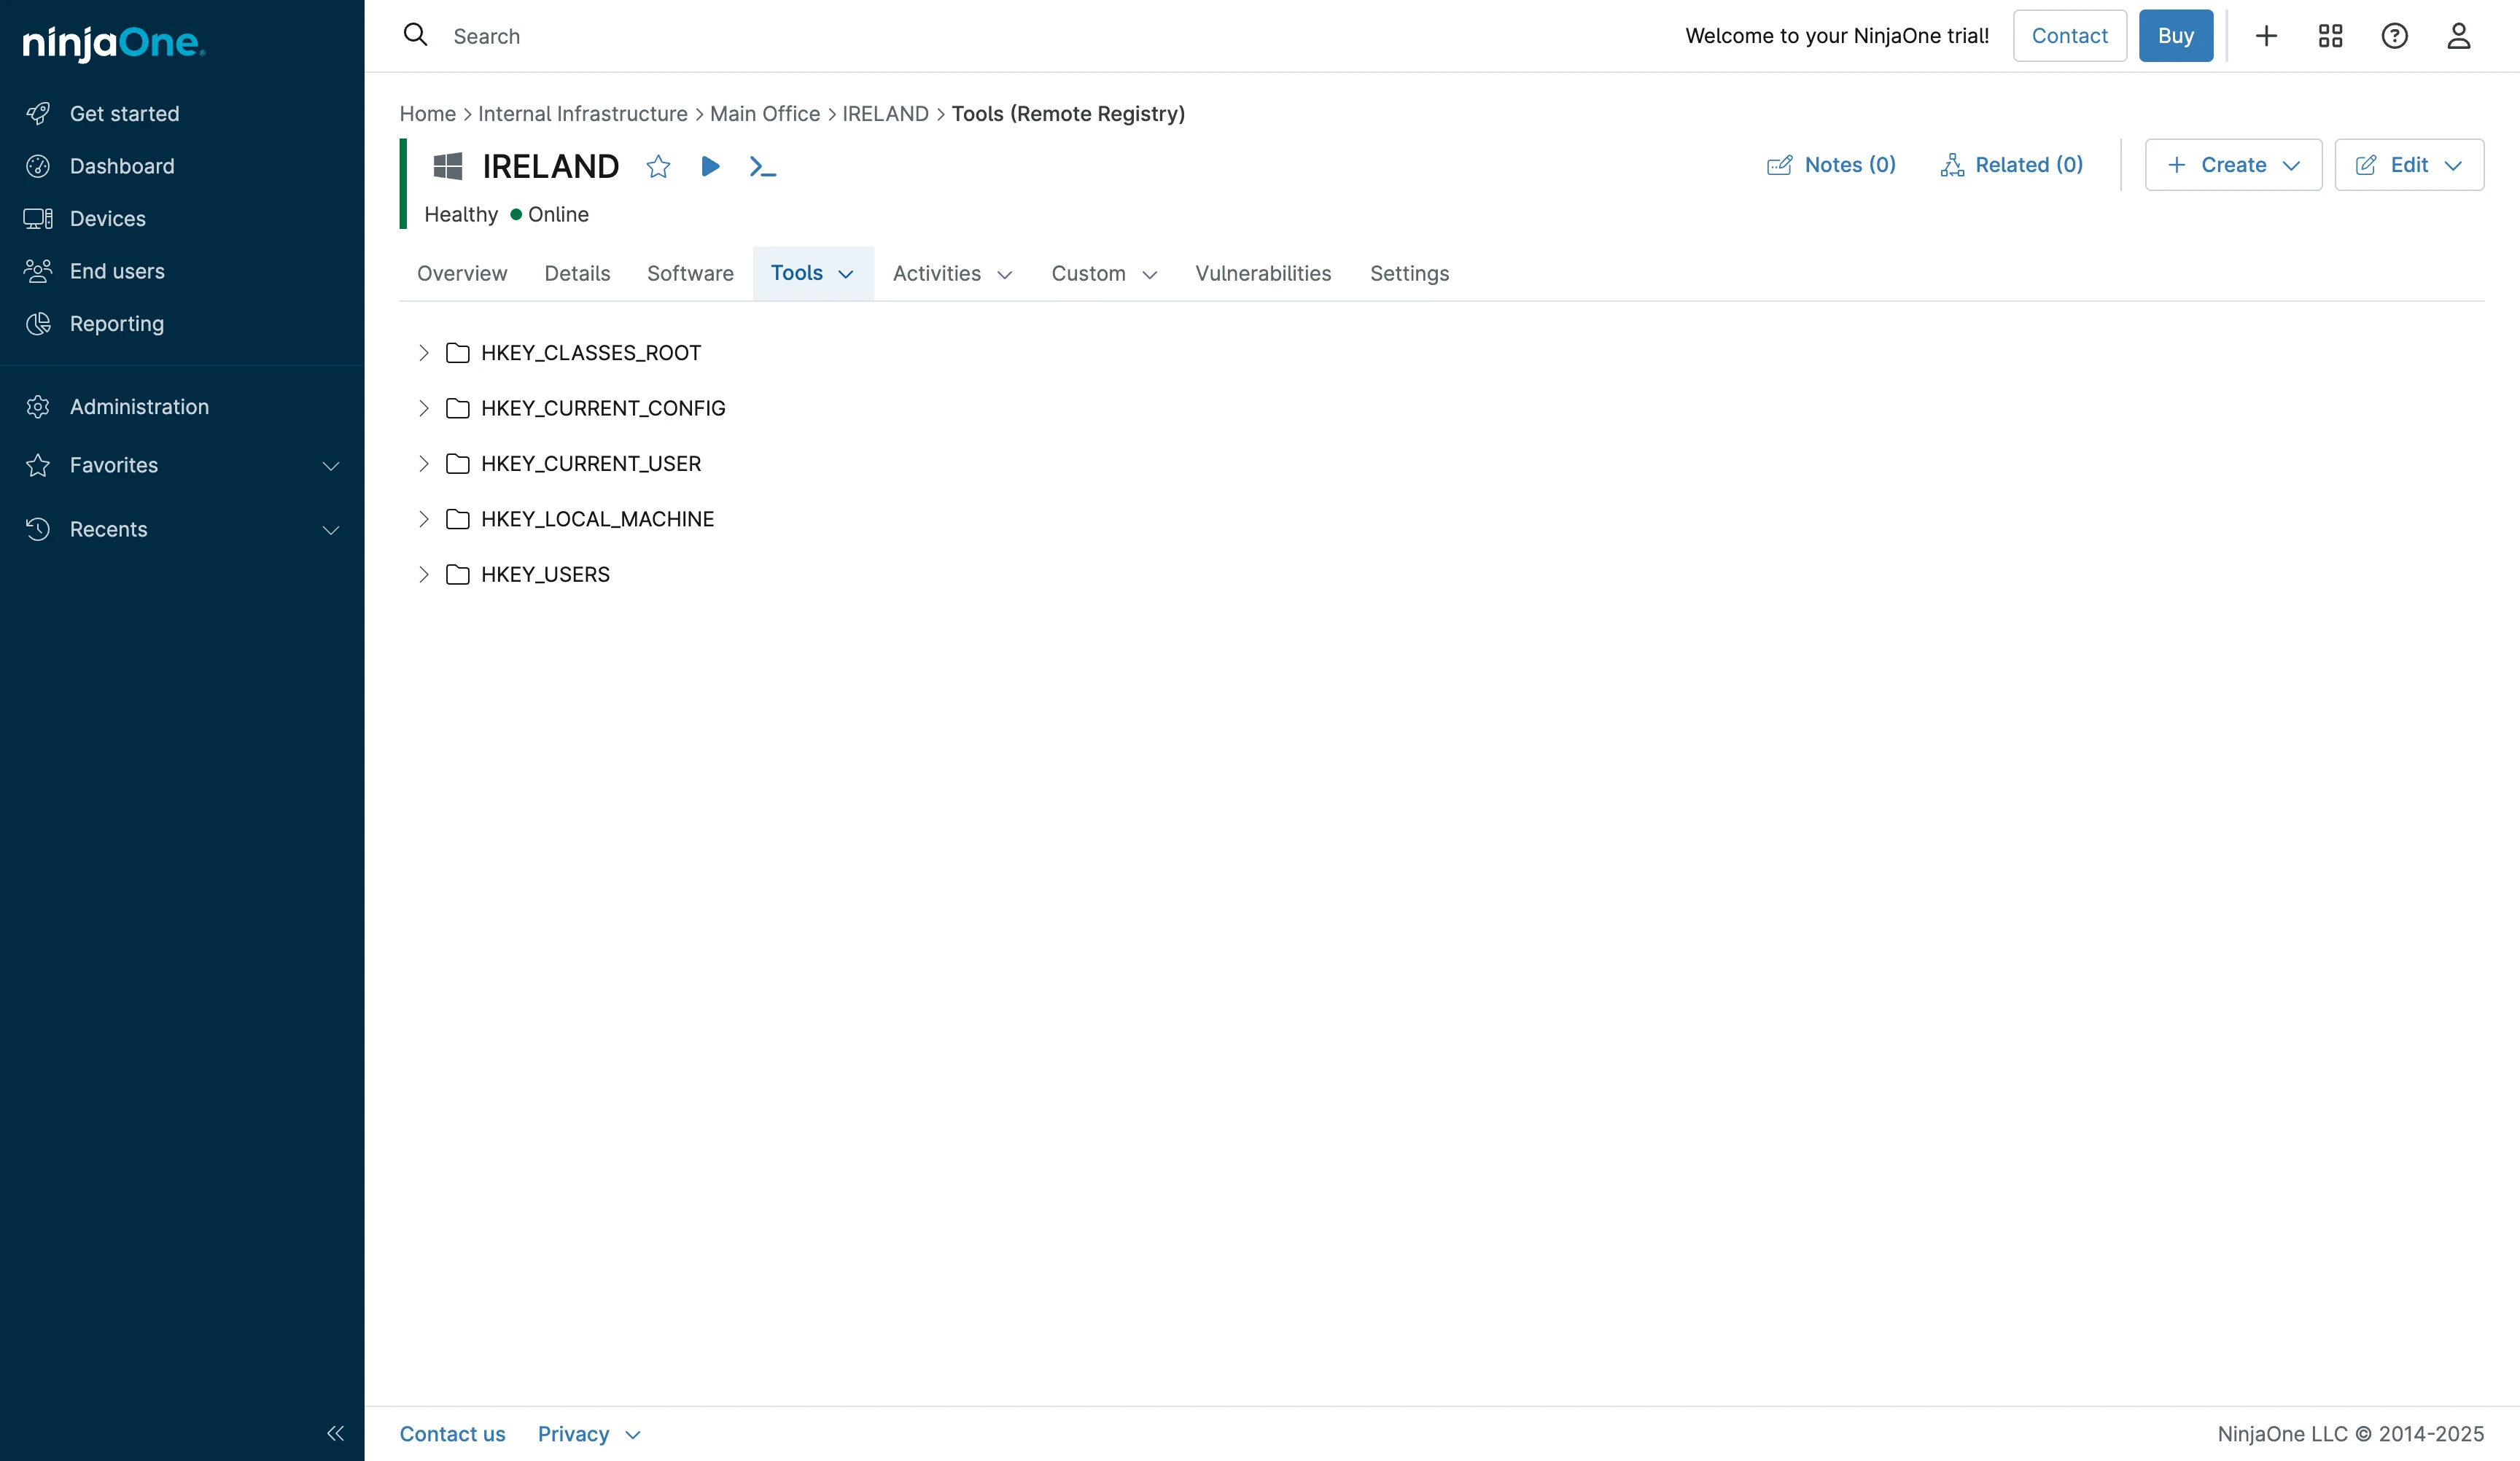
4. Remote Registry (Windows Only)
Windows devices showed a fourth tool: Remote Registry. This provided full registry access through the browser, we could navigate registry hives, add keys, modify values, and delete entries. Registry editing through a web interface feels risky, but the functionality matches local regedit exactly.
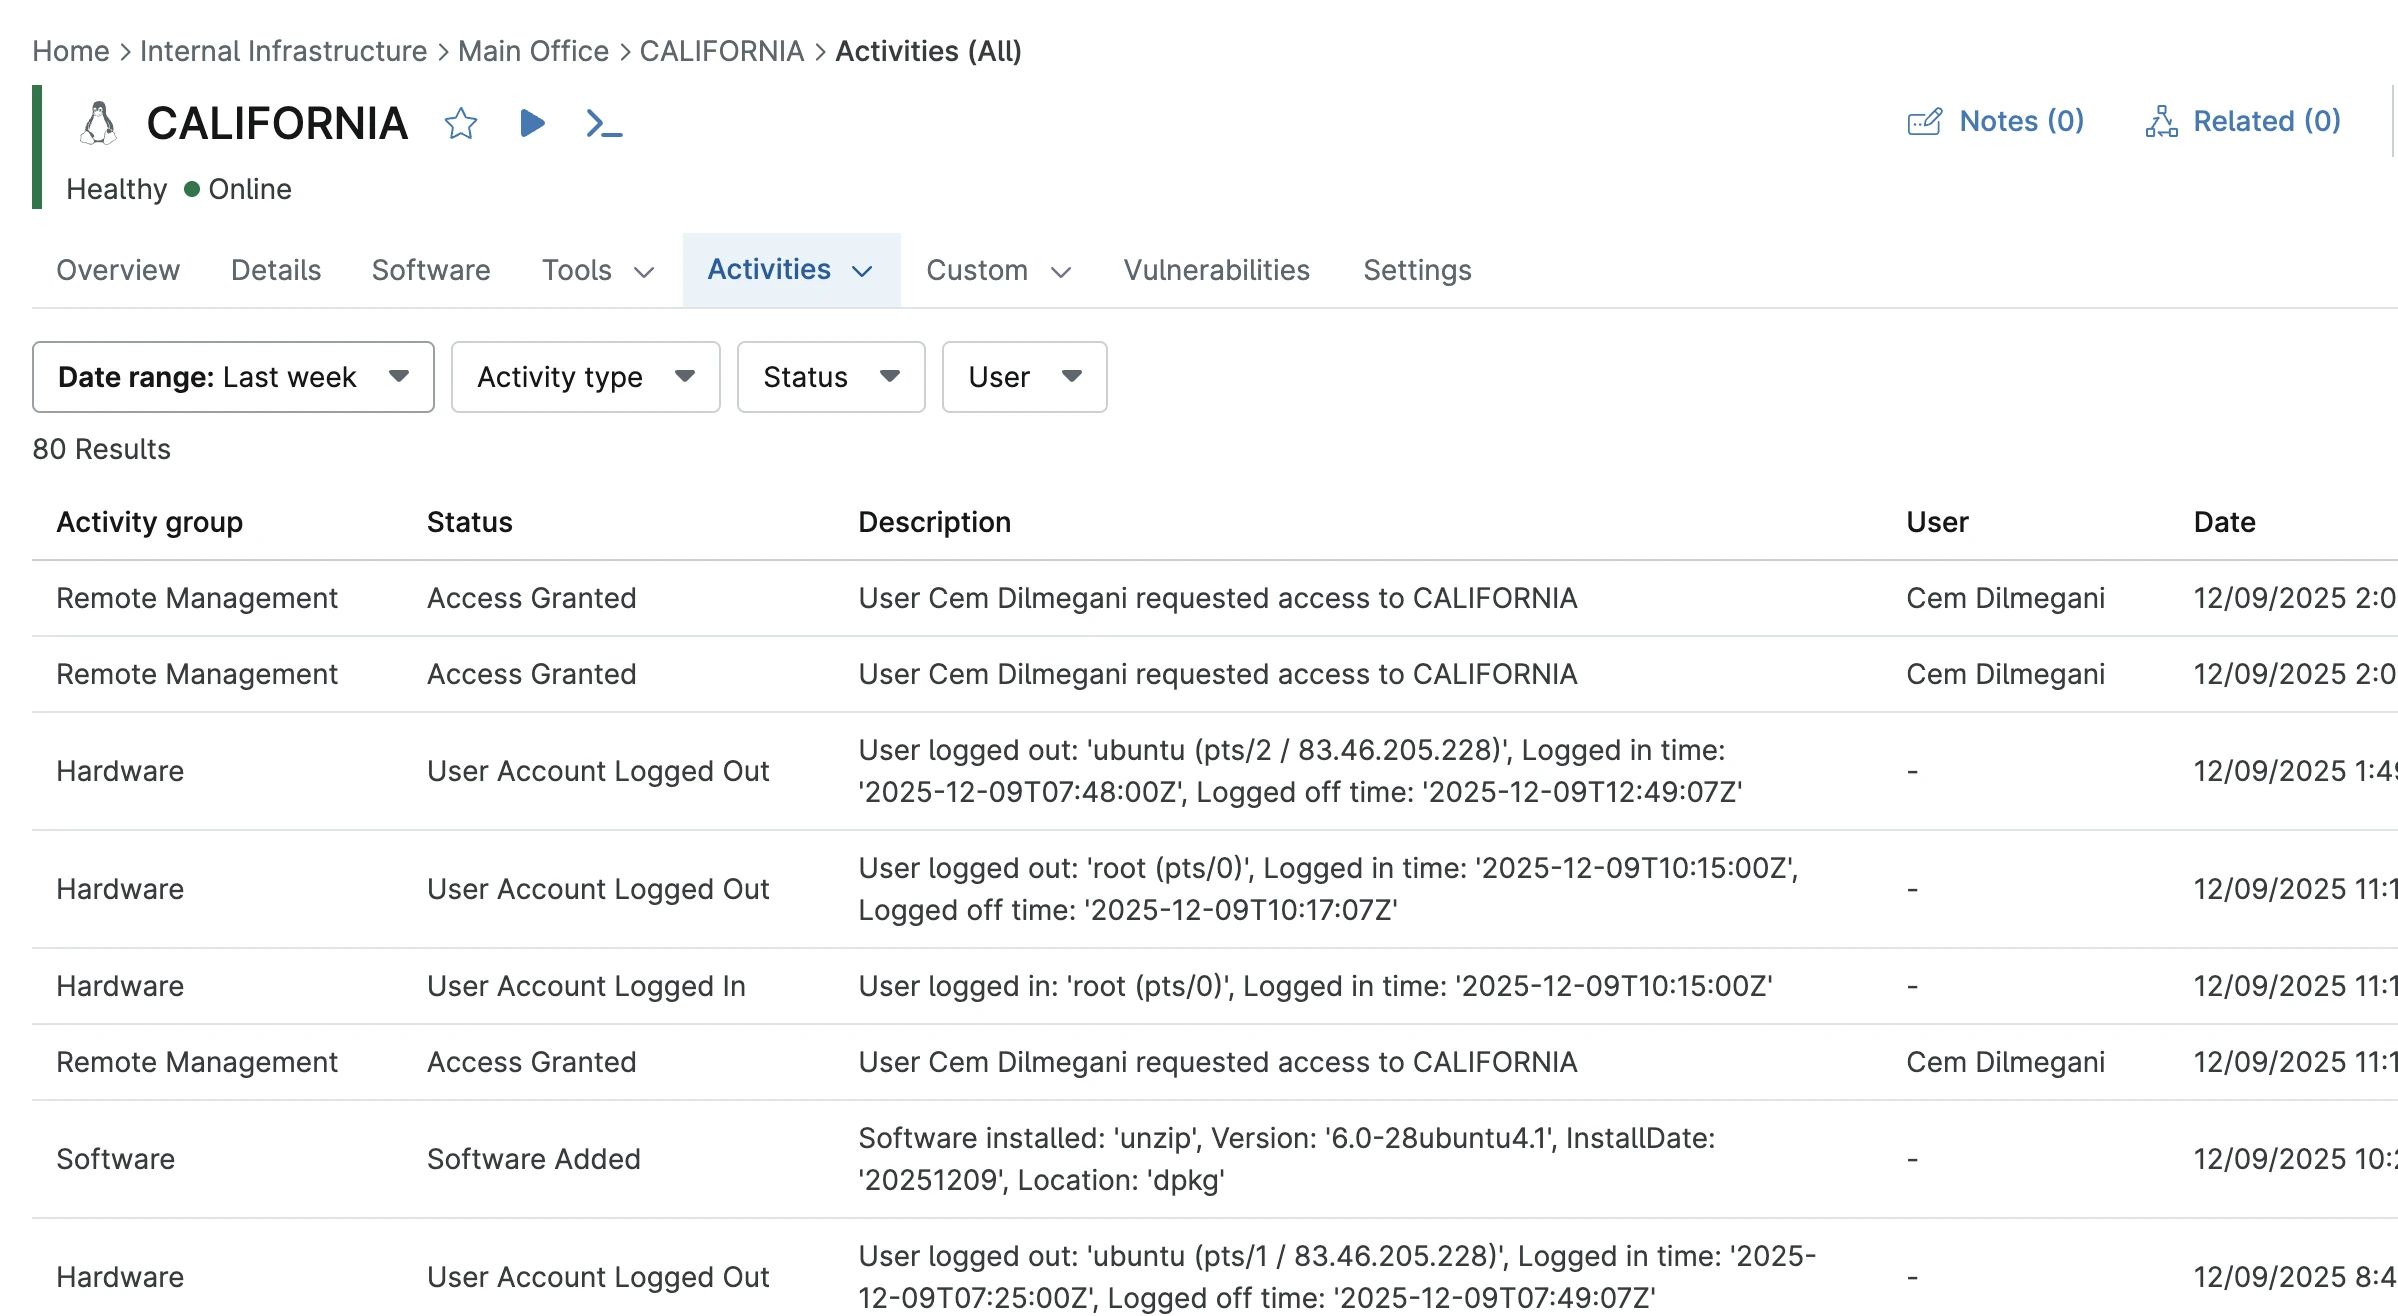
Activities Tab
The Activities tab provided comprehensive logging of all device events. Filter options included:
- Custom date ranges
- Specific users (show only one user’s actions)
- Action types
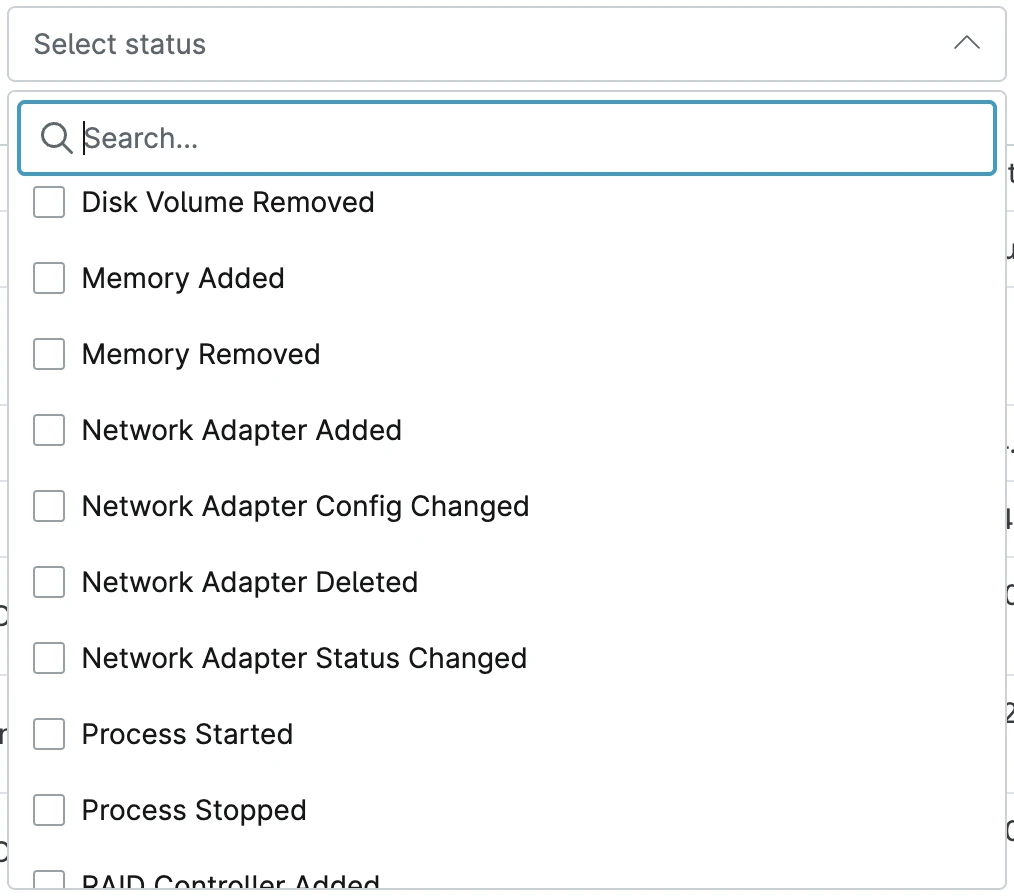
The action type filter revealed thousands of predefined categories:
Available action types included:
- Disk Volume Removed
- Memory Added/Removed
- Network Adapter Added/Config Changed/Deleted/Status Changed
- Process Started/Stopped
- RAID Controller Added
- Software installations/removals
- Hardware changes
- User logins/logouts
- Remote control sessions
- File modifications
- Service changes
- Network configuration changes
- Security events
This logging granularity exceeded Windows Event Viewer. We could quickly answer “who installed what software on which date” without parsing cryptic event IDs.
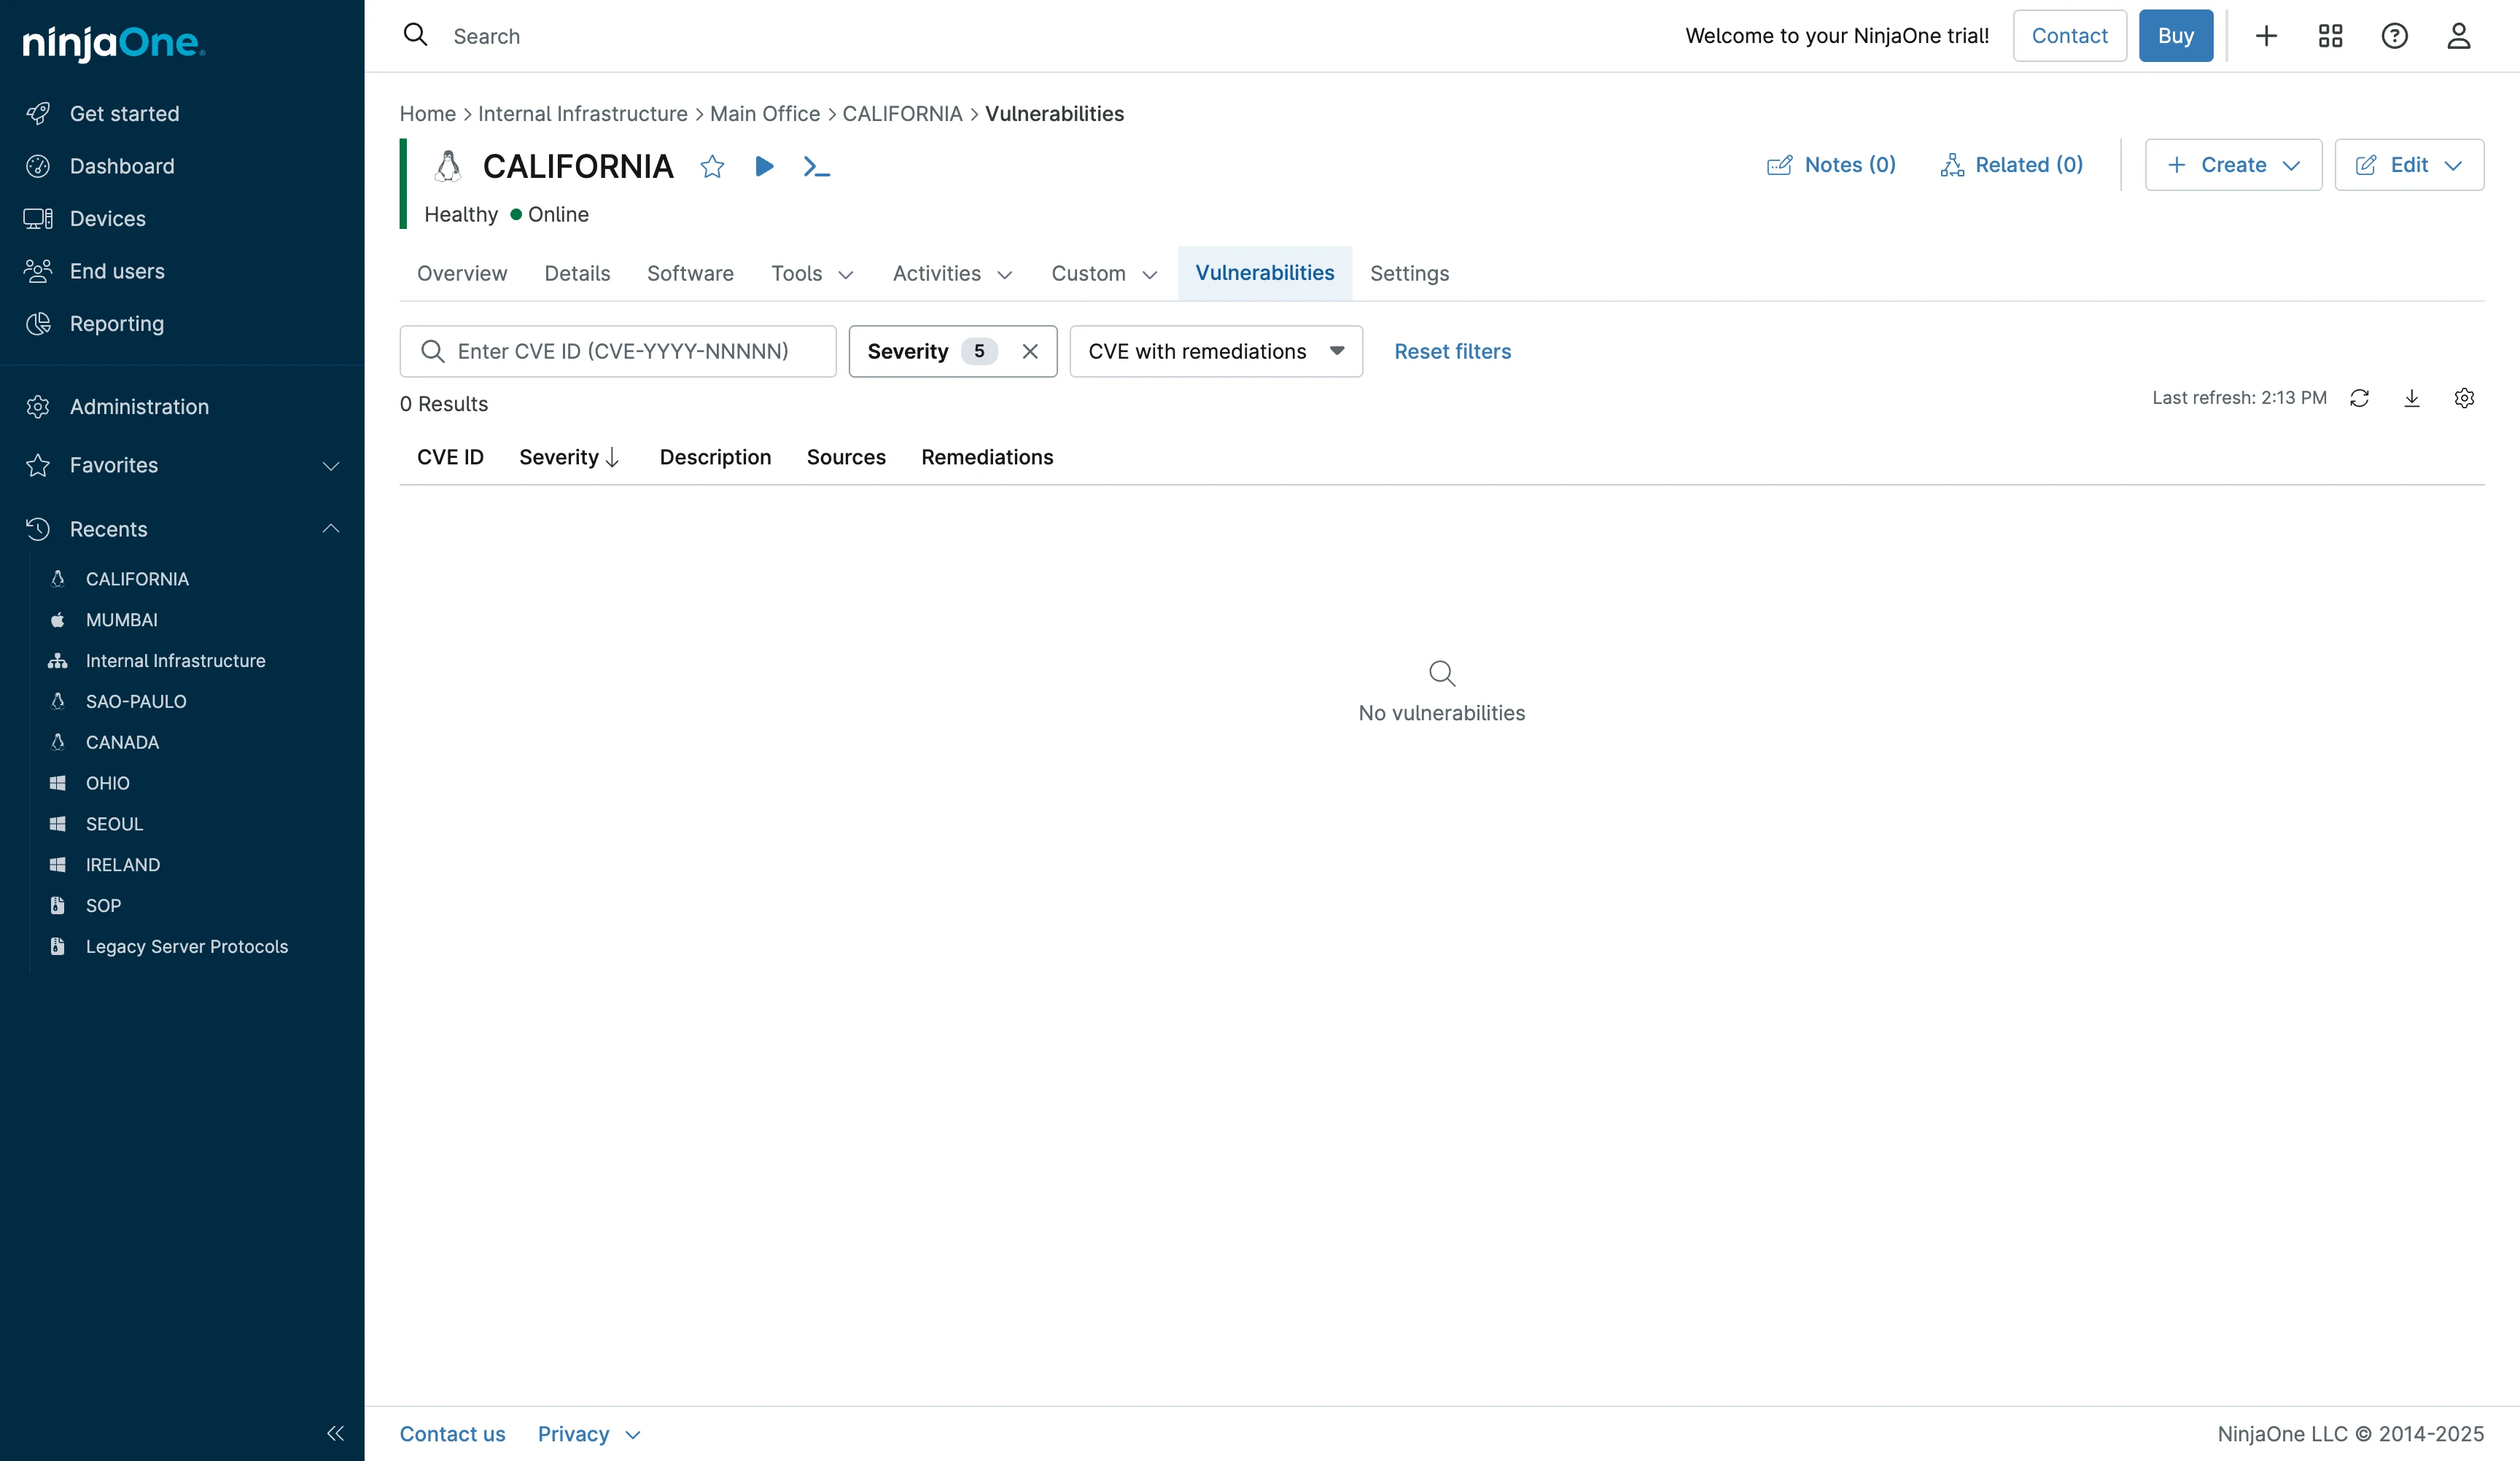
Vulnerabilities Tab
The Vulnerabilities tab lists security issues in the operating system and installed software. Our fresh servers showed no vulnerabilities (0 Results). This section would populate with CVE identifiers and patch recommendations as the system ages and new vulnerabilities are discovered.
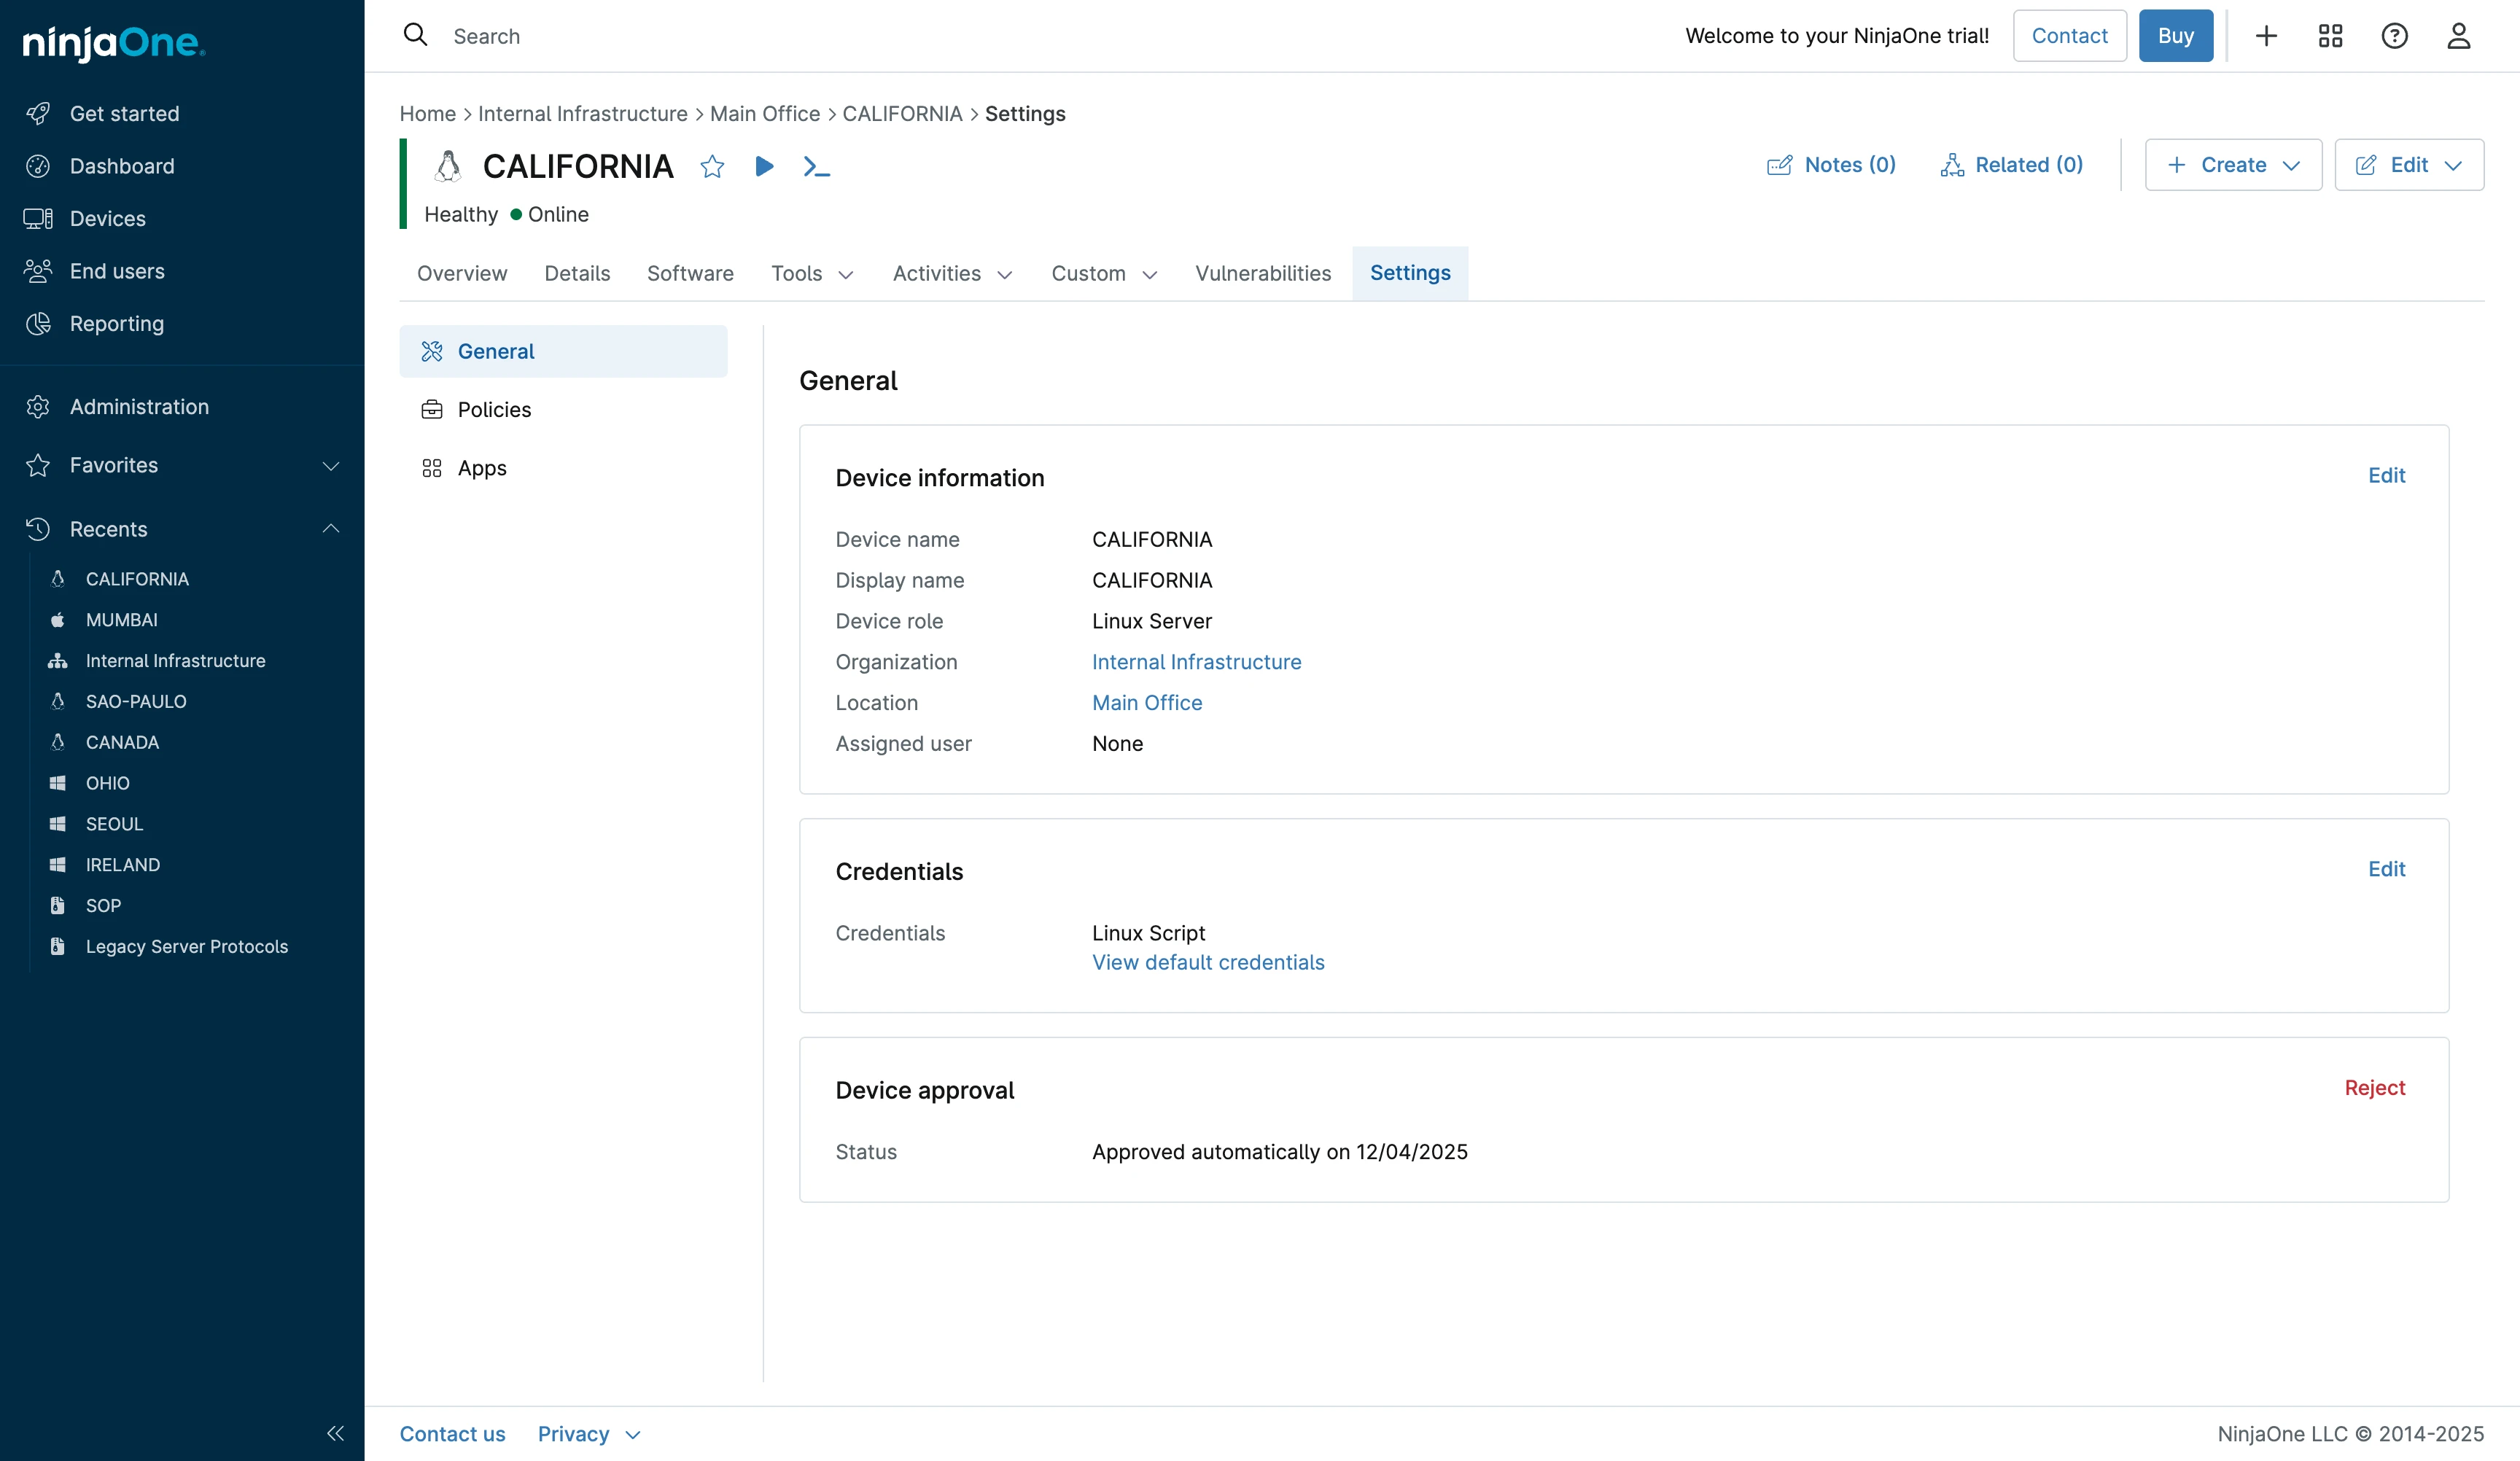
Settings Tab
The Settings tab contained device configuration and policy assignments organized into three sections:
General: Device information (name, display name, role, organization, location, assigned user)
Policies: Applied configuration policies
Apps: Installed NinjaOne applications or extensions
Scheduled Tasks & Automation
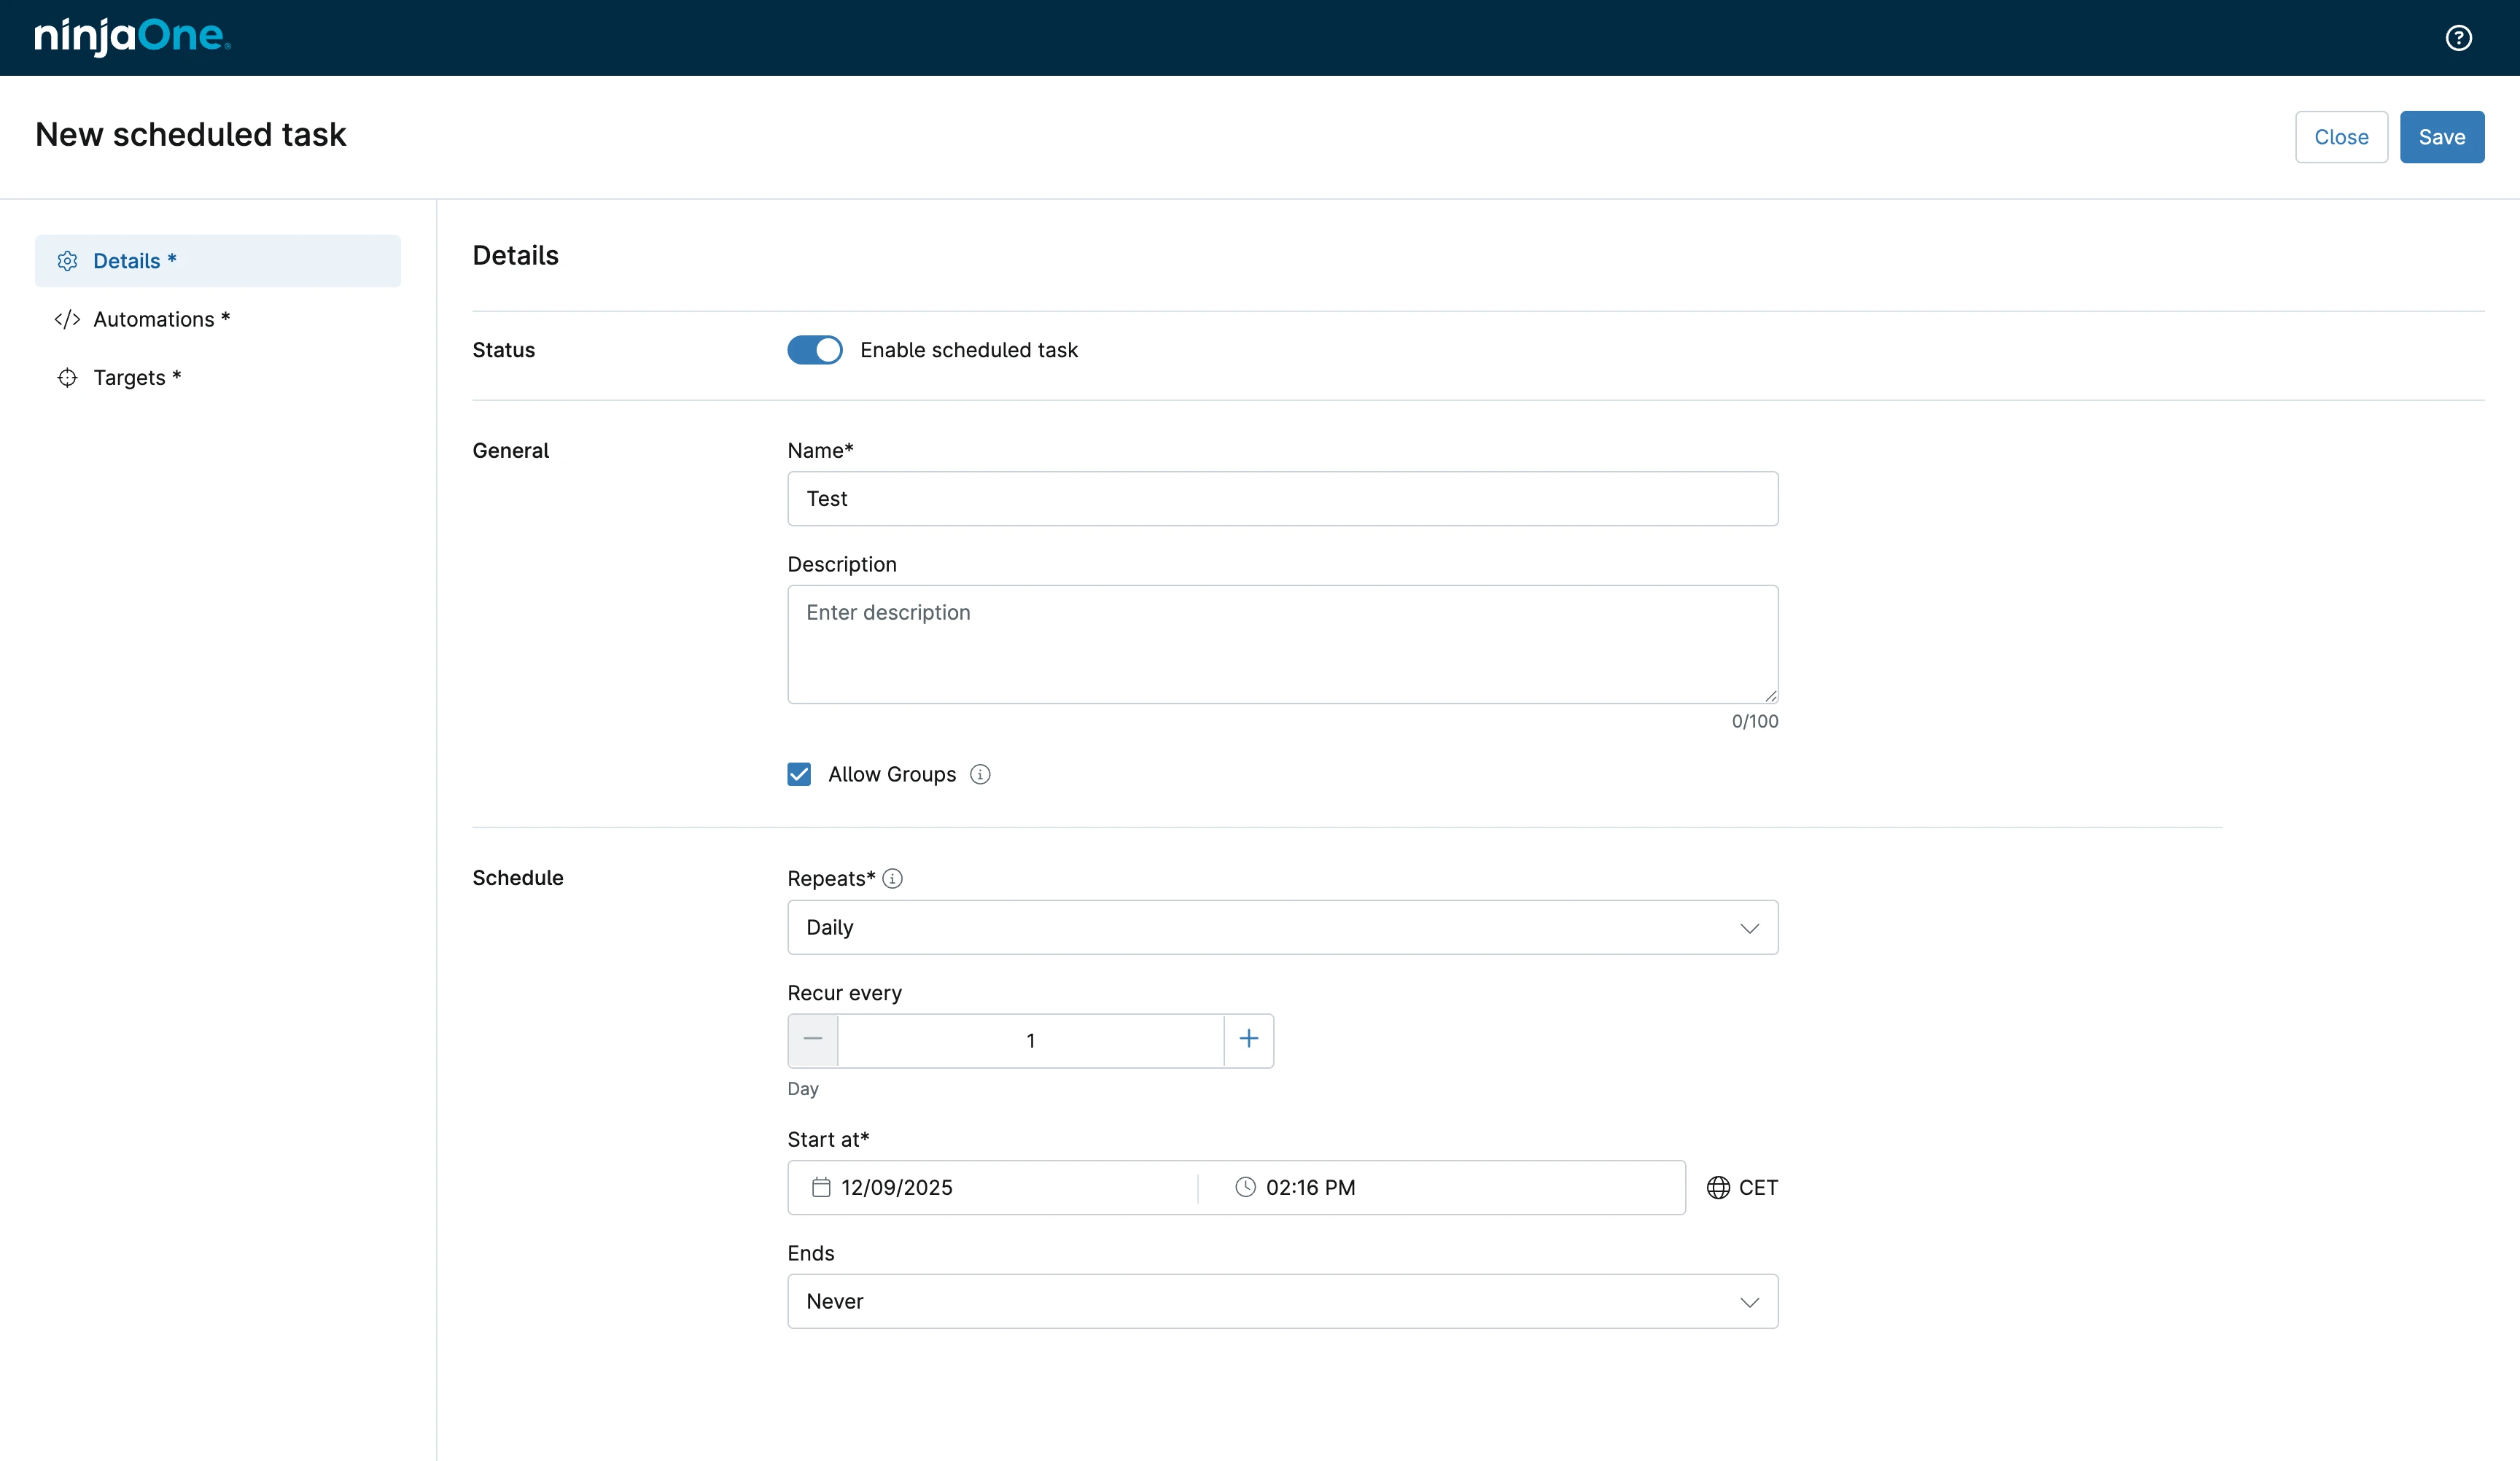
From the Overview page, we clicked the “Create” button and selected “Scheduled task.”
The scheduler interface included:
- Task name and description
- Repeat frequency (Daily, Weekly, Monthly, Custom)
- Recurrence interval
- Start date and time with timezone
- End date (or Never)
- Enable/disable toggle
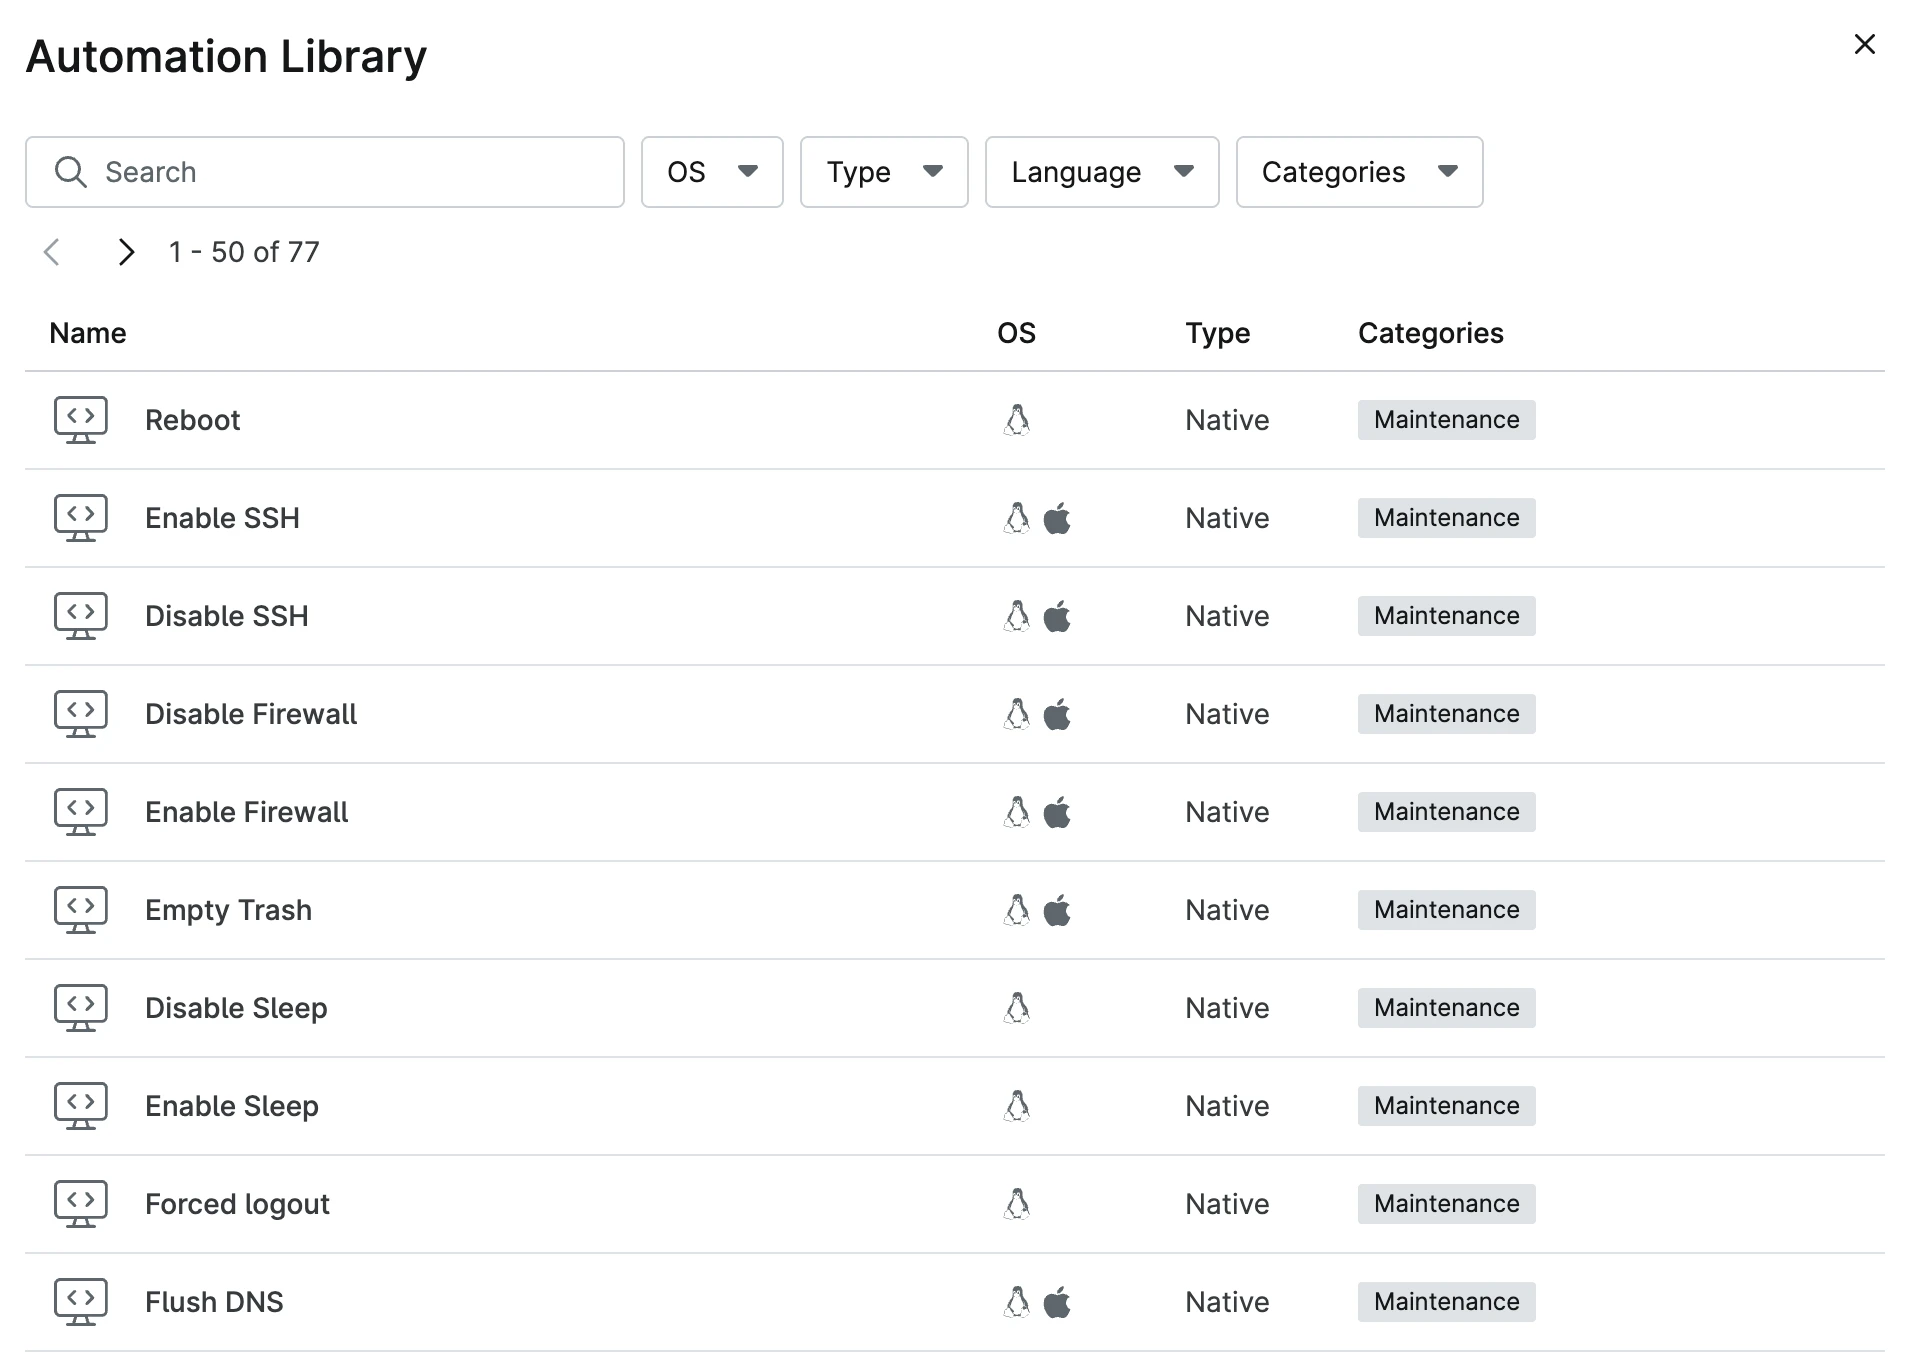
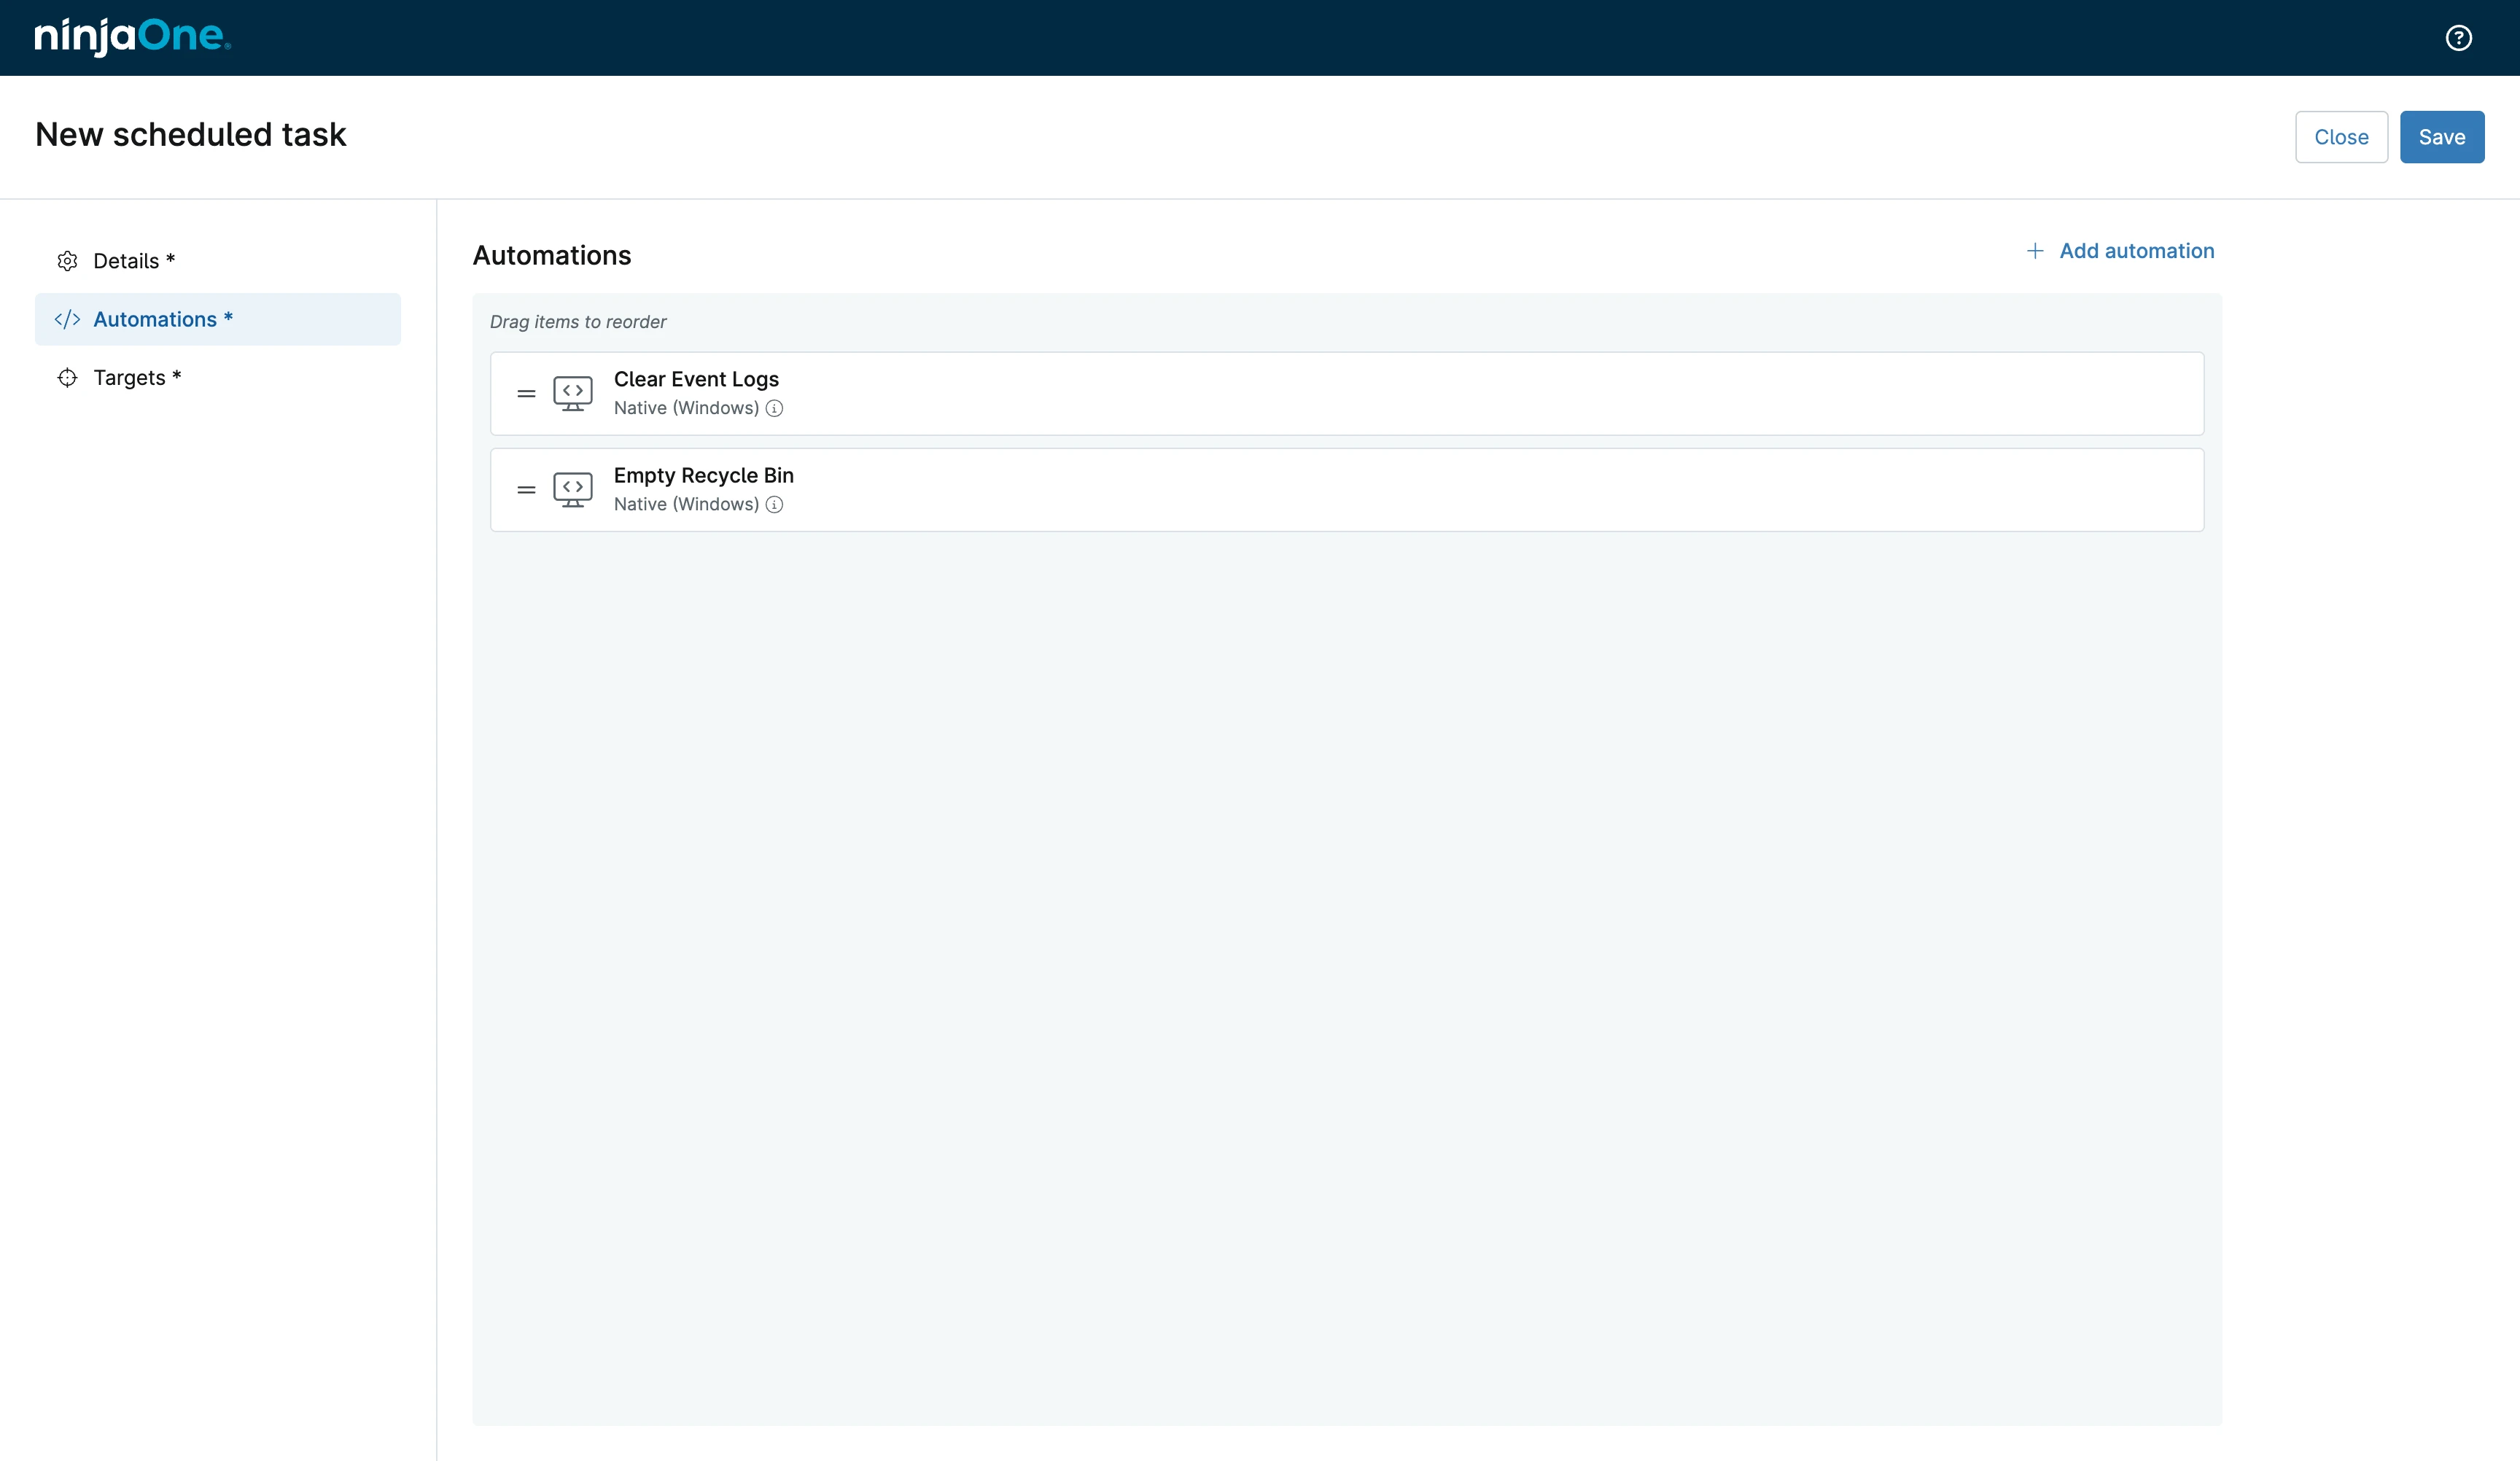
Automation Library
We clicked into the Automations tab and selected “Add automation” to explore available actions.
The library contained extensive pre-built automations filterable by:
- Operating system
- Type (Native, Script, etc.)
- Language
- Categories
We selected “Clear Event Logs” and “Empty Recycle Bin” as examples.
Tasks appeared in drag-and-drop order, allowing us to sequence operations.
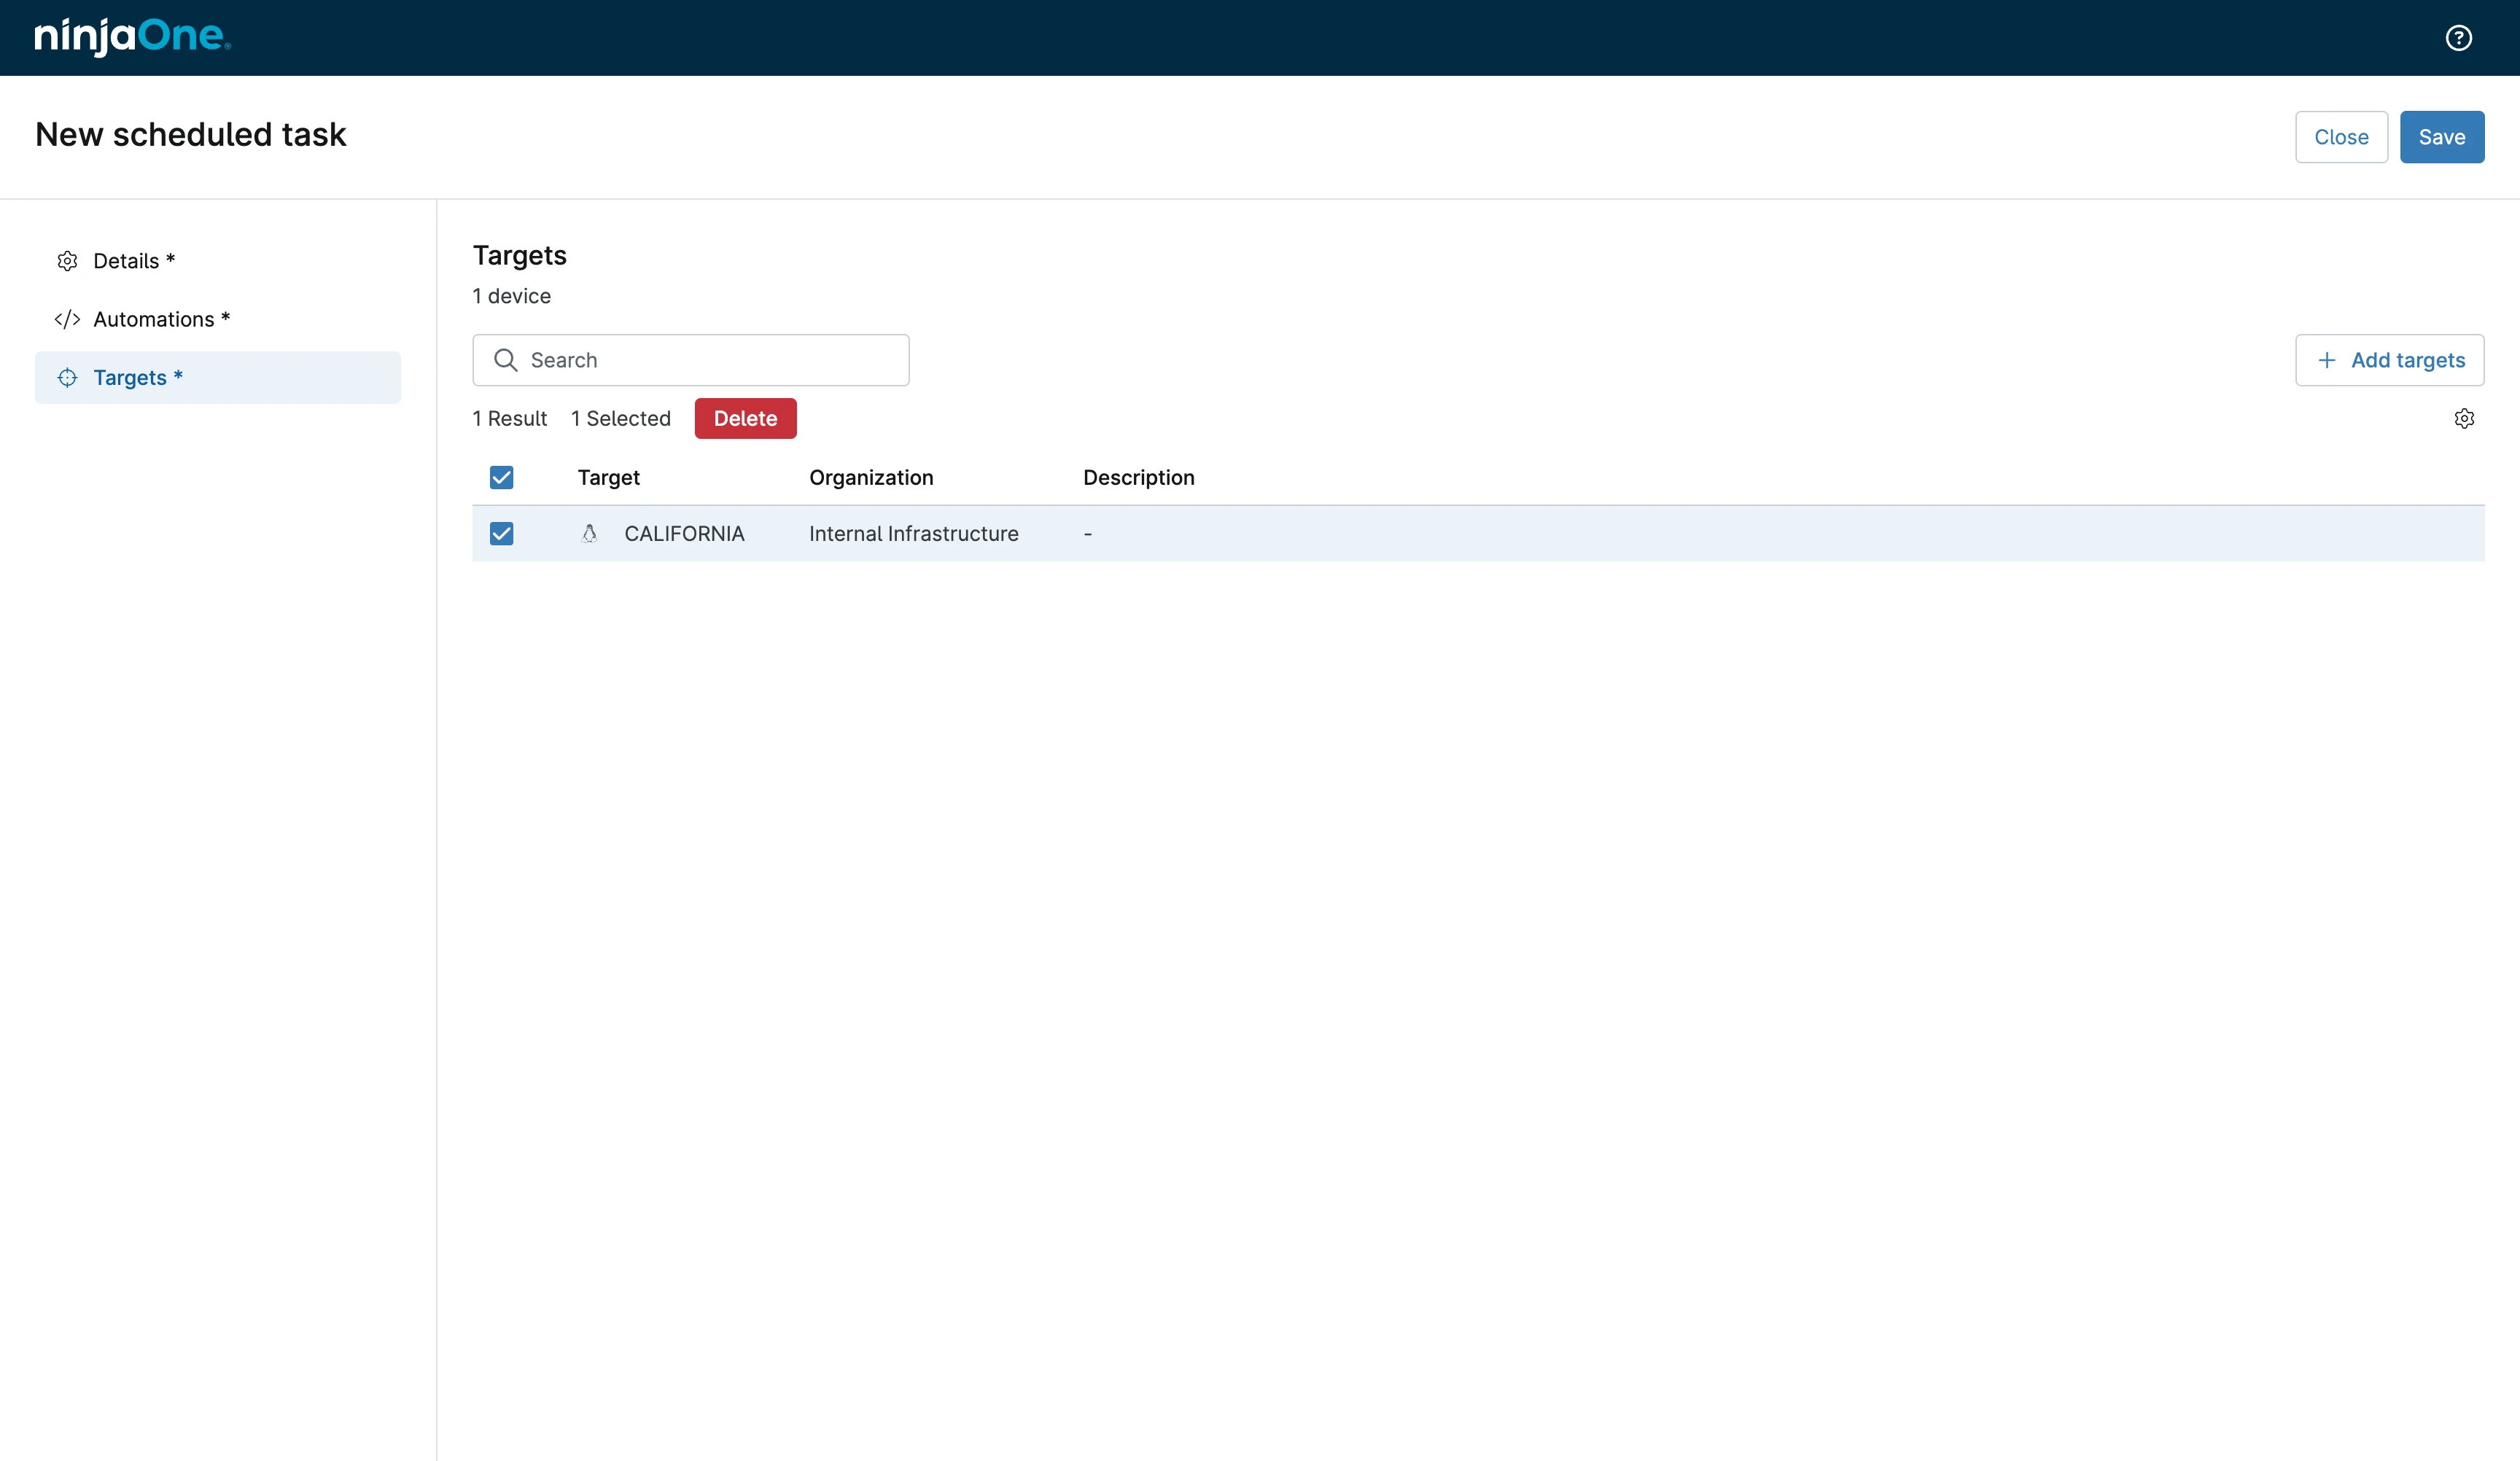
Target Selection
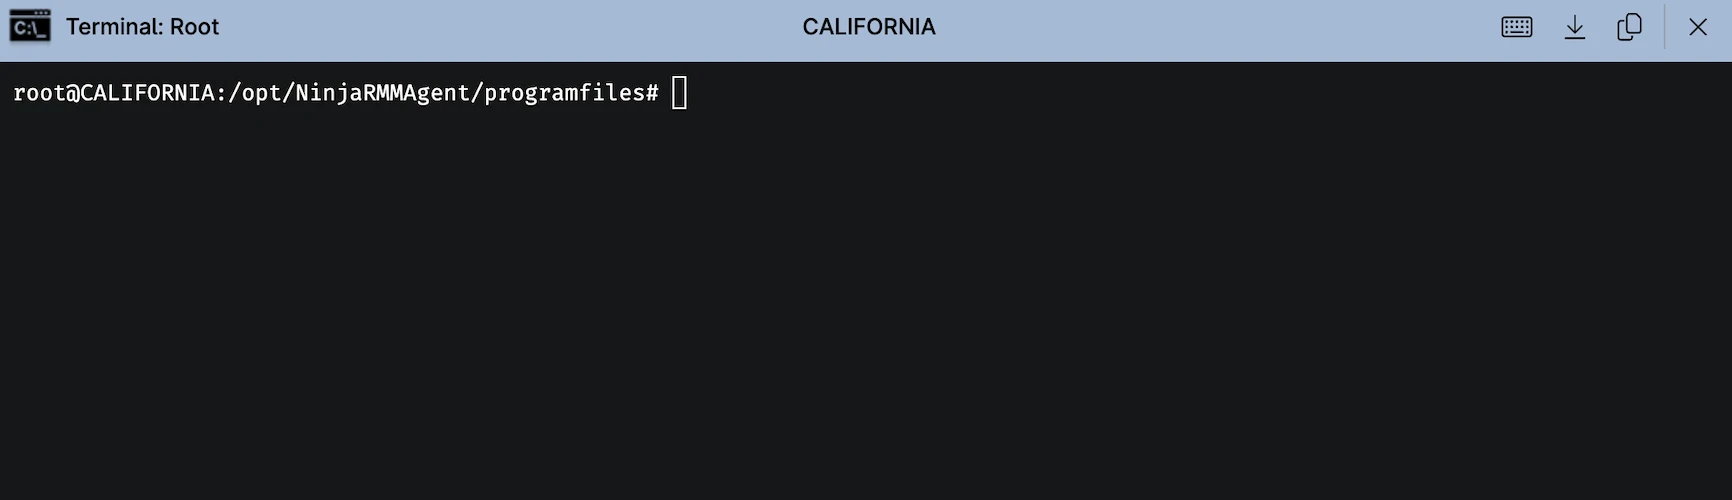
The Targets tab lets us select which devices receive the scheduled task. We selected the CALIFORNIA machine. Multi-device deployment works the same way; check multiple devices to deploy simultaneously.
When we clicked Save, NinjaOne requested 2FA verification. Scheduled tasks can perform system-critical operations (like clearing event logs), so two-factor authentication for task creation makes sense.
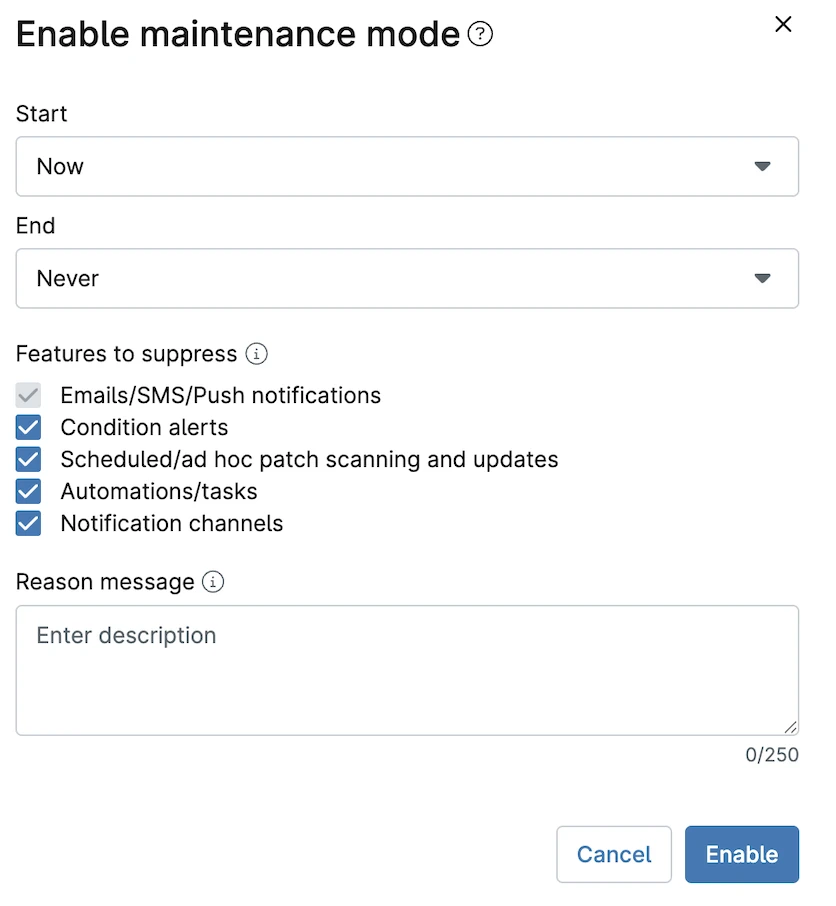
Maintenance Mode
The dashboard included a “maintenance mode” feature. We could specify date/time ranges to suspend:
- Alerts
- Scheduled tasks
- Monitoring checks
This prevents false alarms during planned maintenance windows.
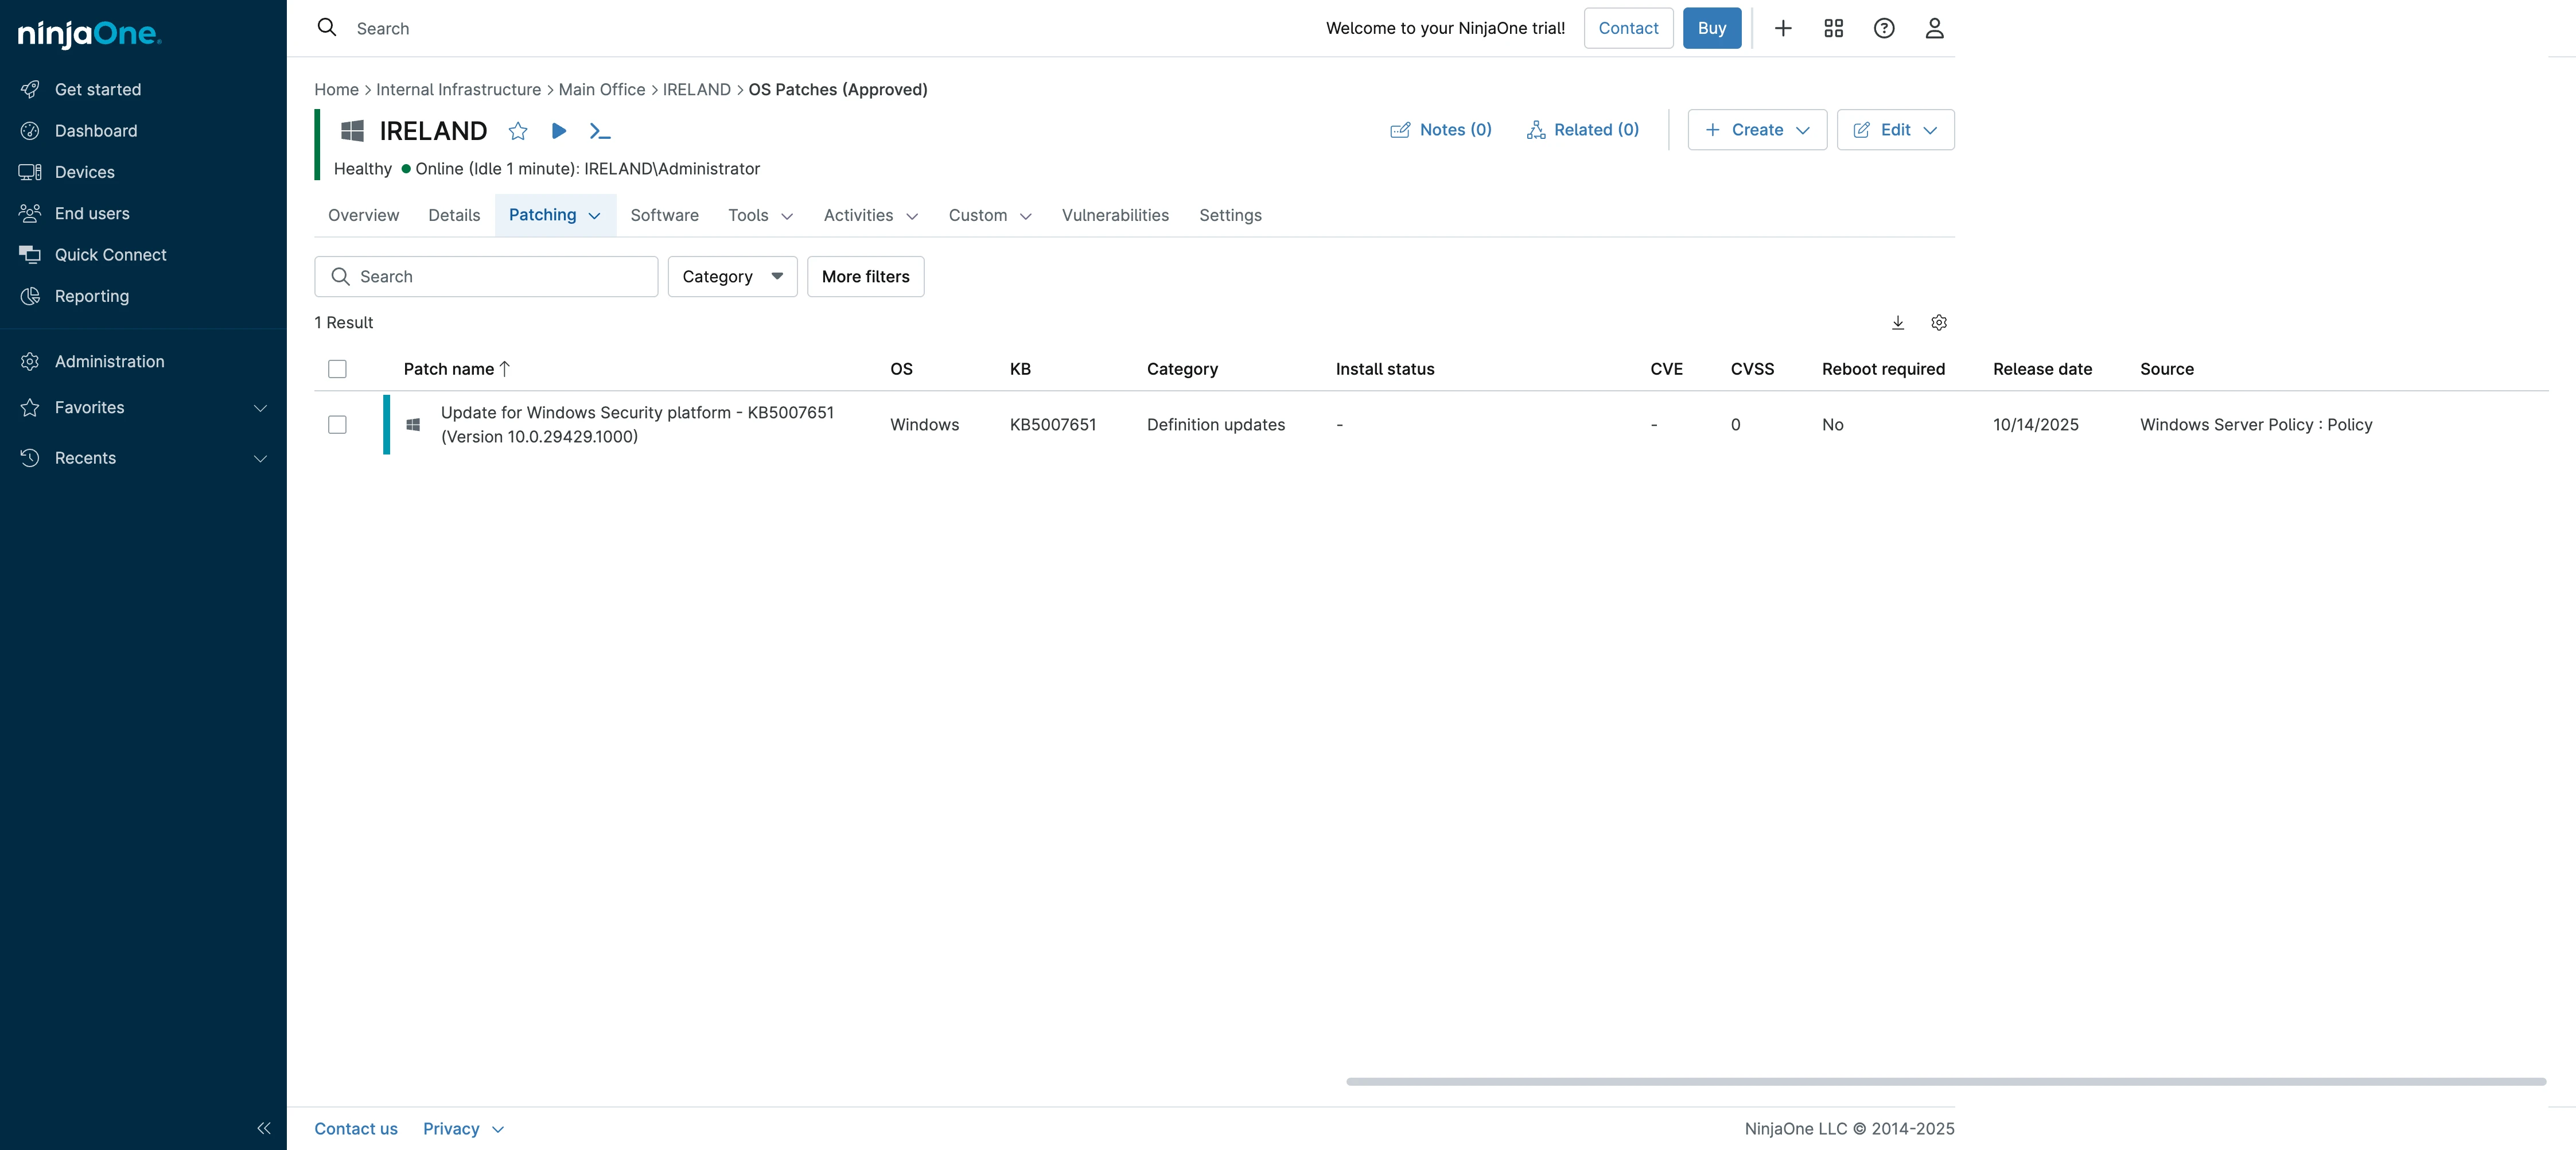
OS and Software Patching
While exploring the dashboard, we noticed “OS patching” was disabled by default. After enabling it, a new “Patching” tab appeared in the device navigation.
We clicked the Patching tab and immediately saw available OS patches. Selecting a patch displayed two options: Apply Now and Reject.
We tested patch application on one of our servers. The patch deployed successfully.
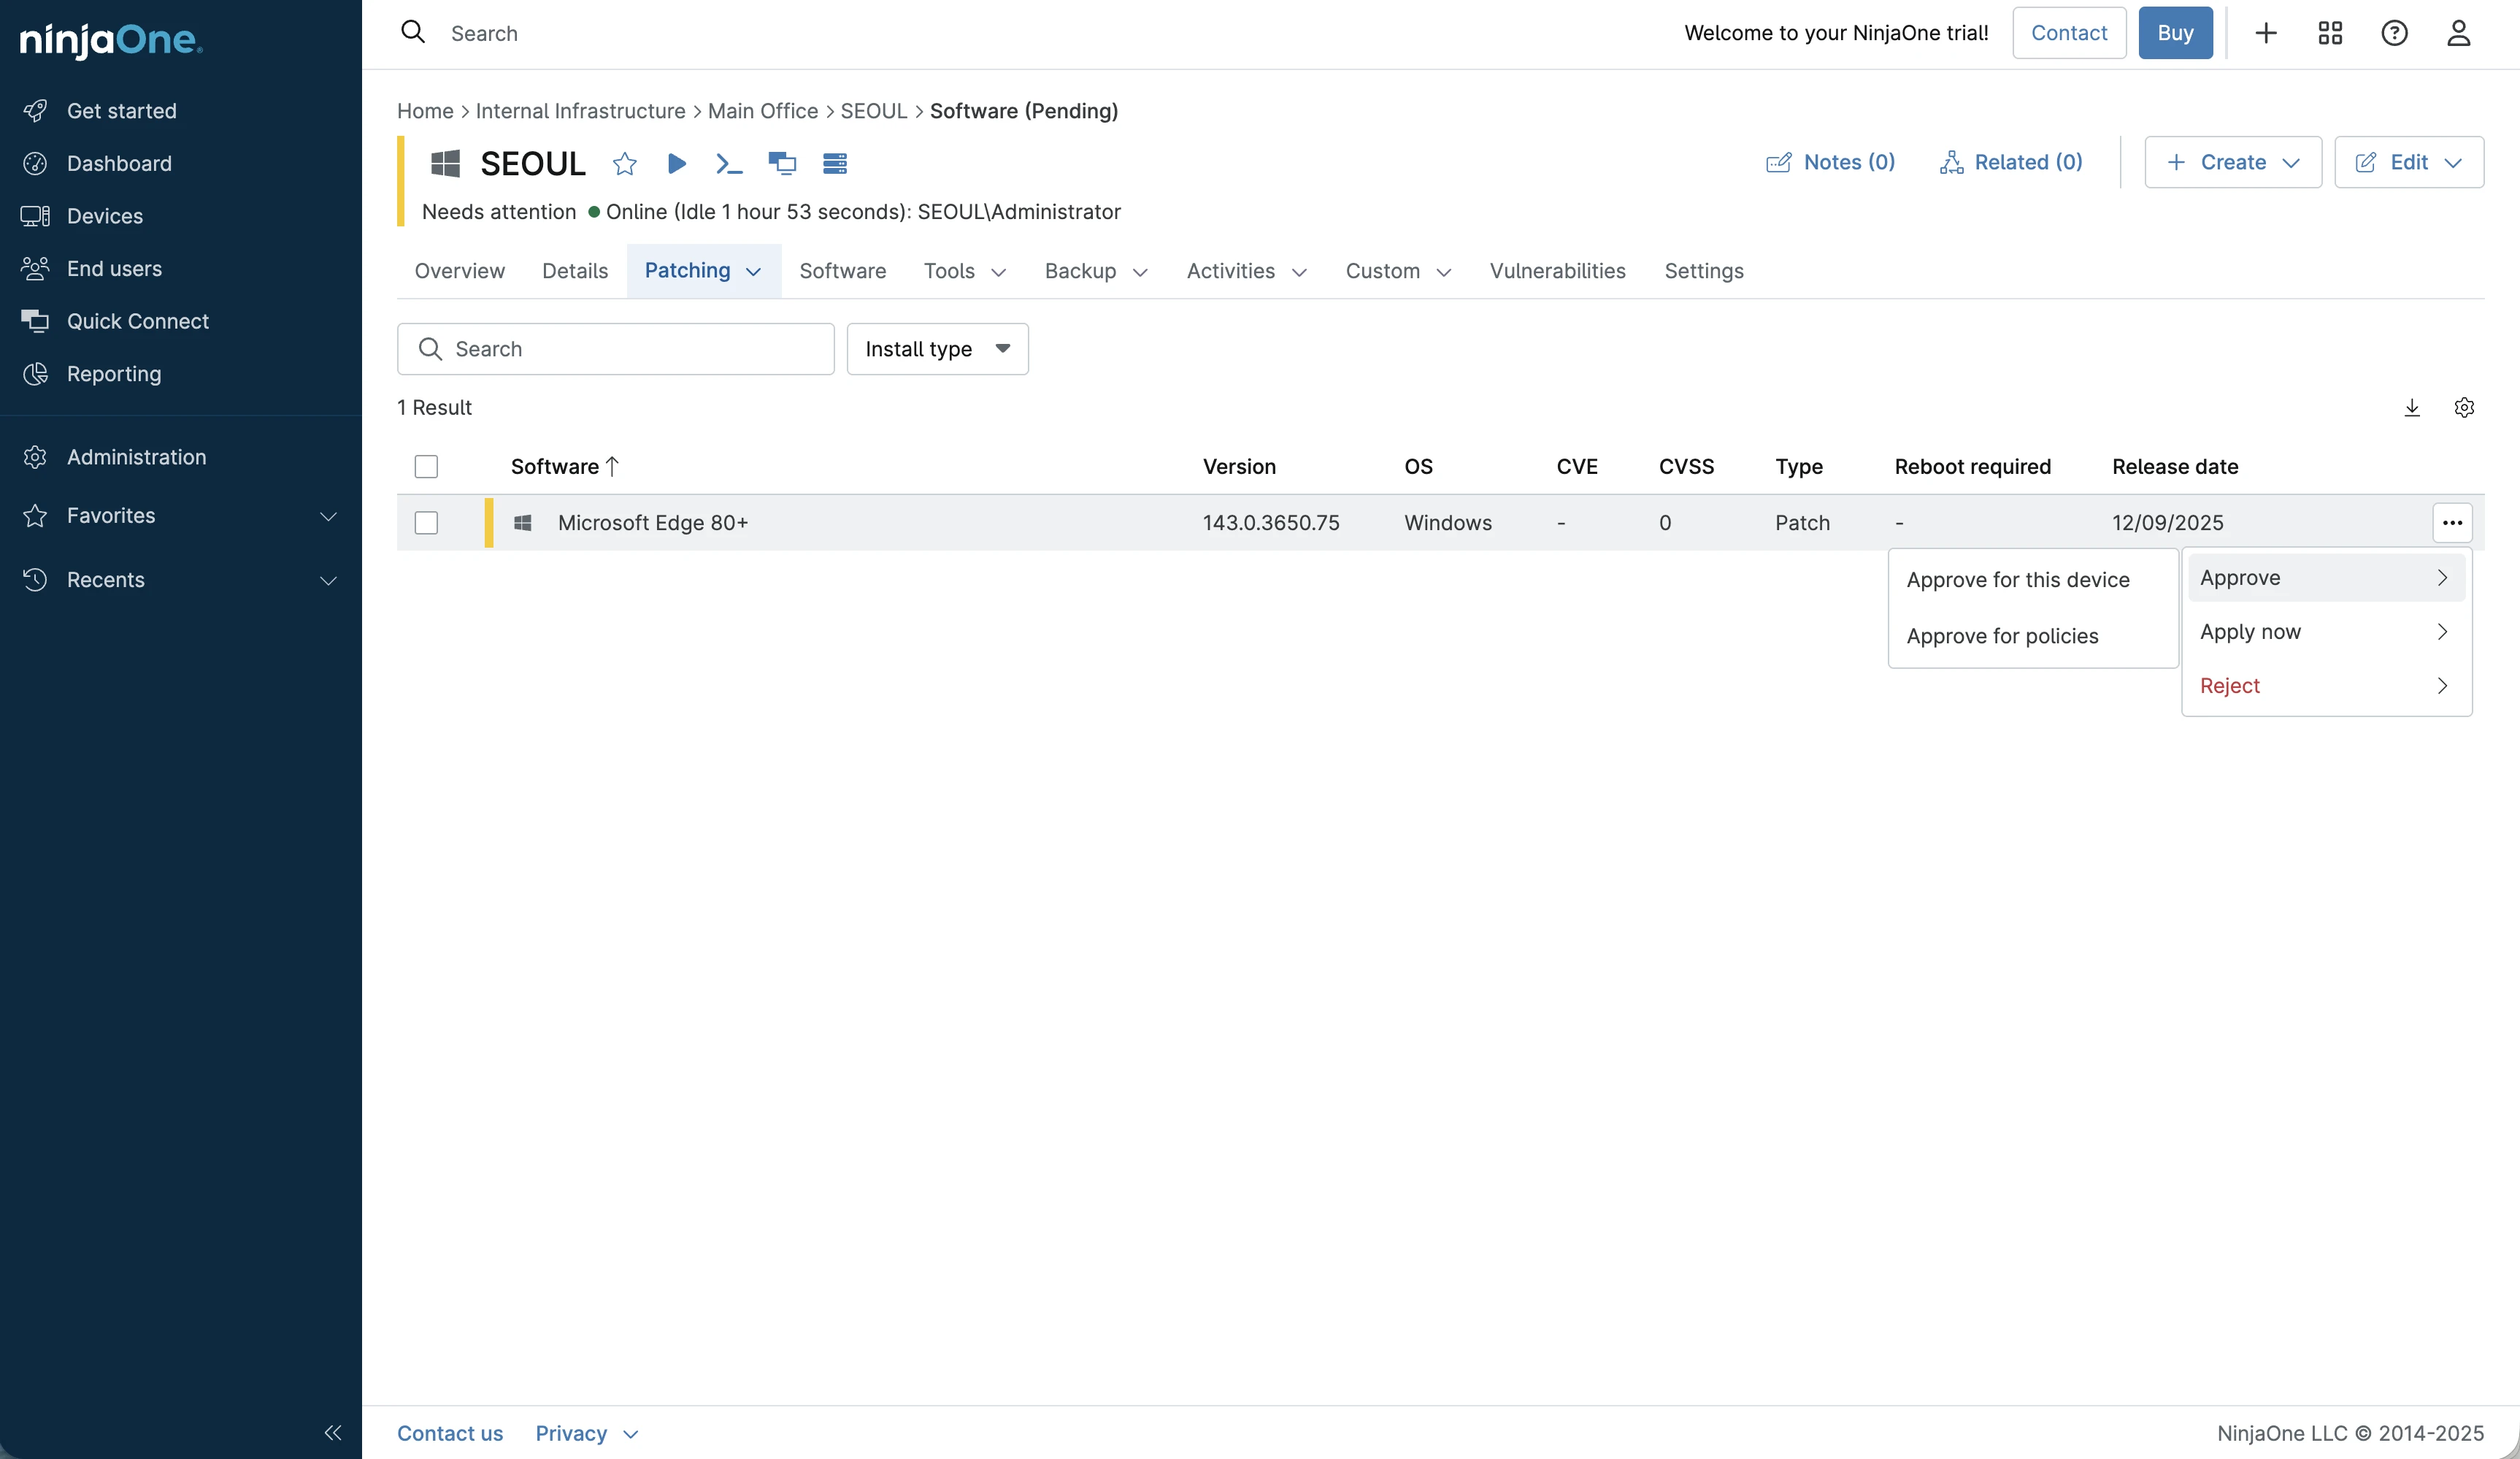
Software patching worked similarly. When new software patches became available, NinjaOne displayed notifications in two places:
- Alert in the main dashboard
- Patch list in the Patching section
The deployment options provided flexibility:
- Apply to this device only
- Apply the policy to all devices using that policy
We applied a patch only to the SEOUL server to test individual device patching. This dual deployment method, personal device or policy-based fleet-wide, gives administrators precise control over patch rollout strategies.
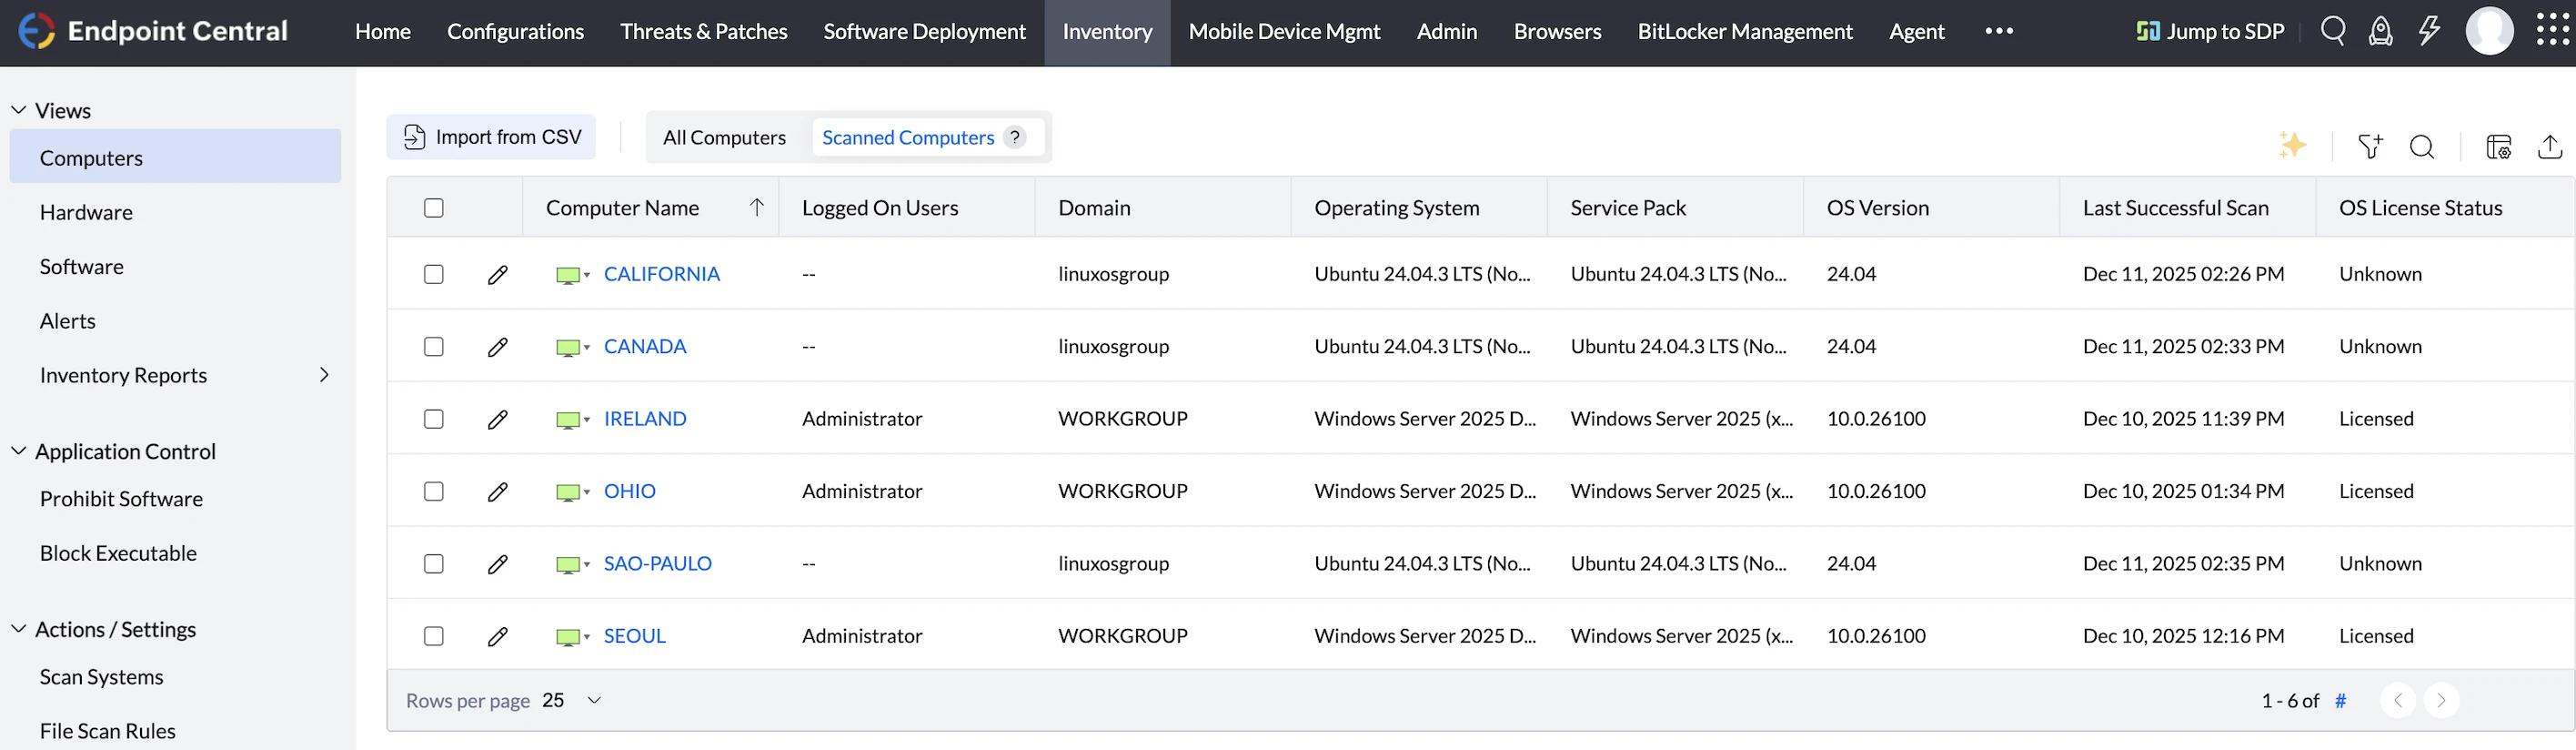
2. ManageEngine
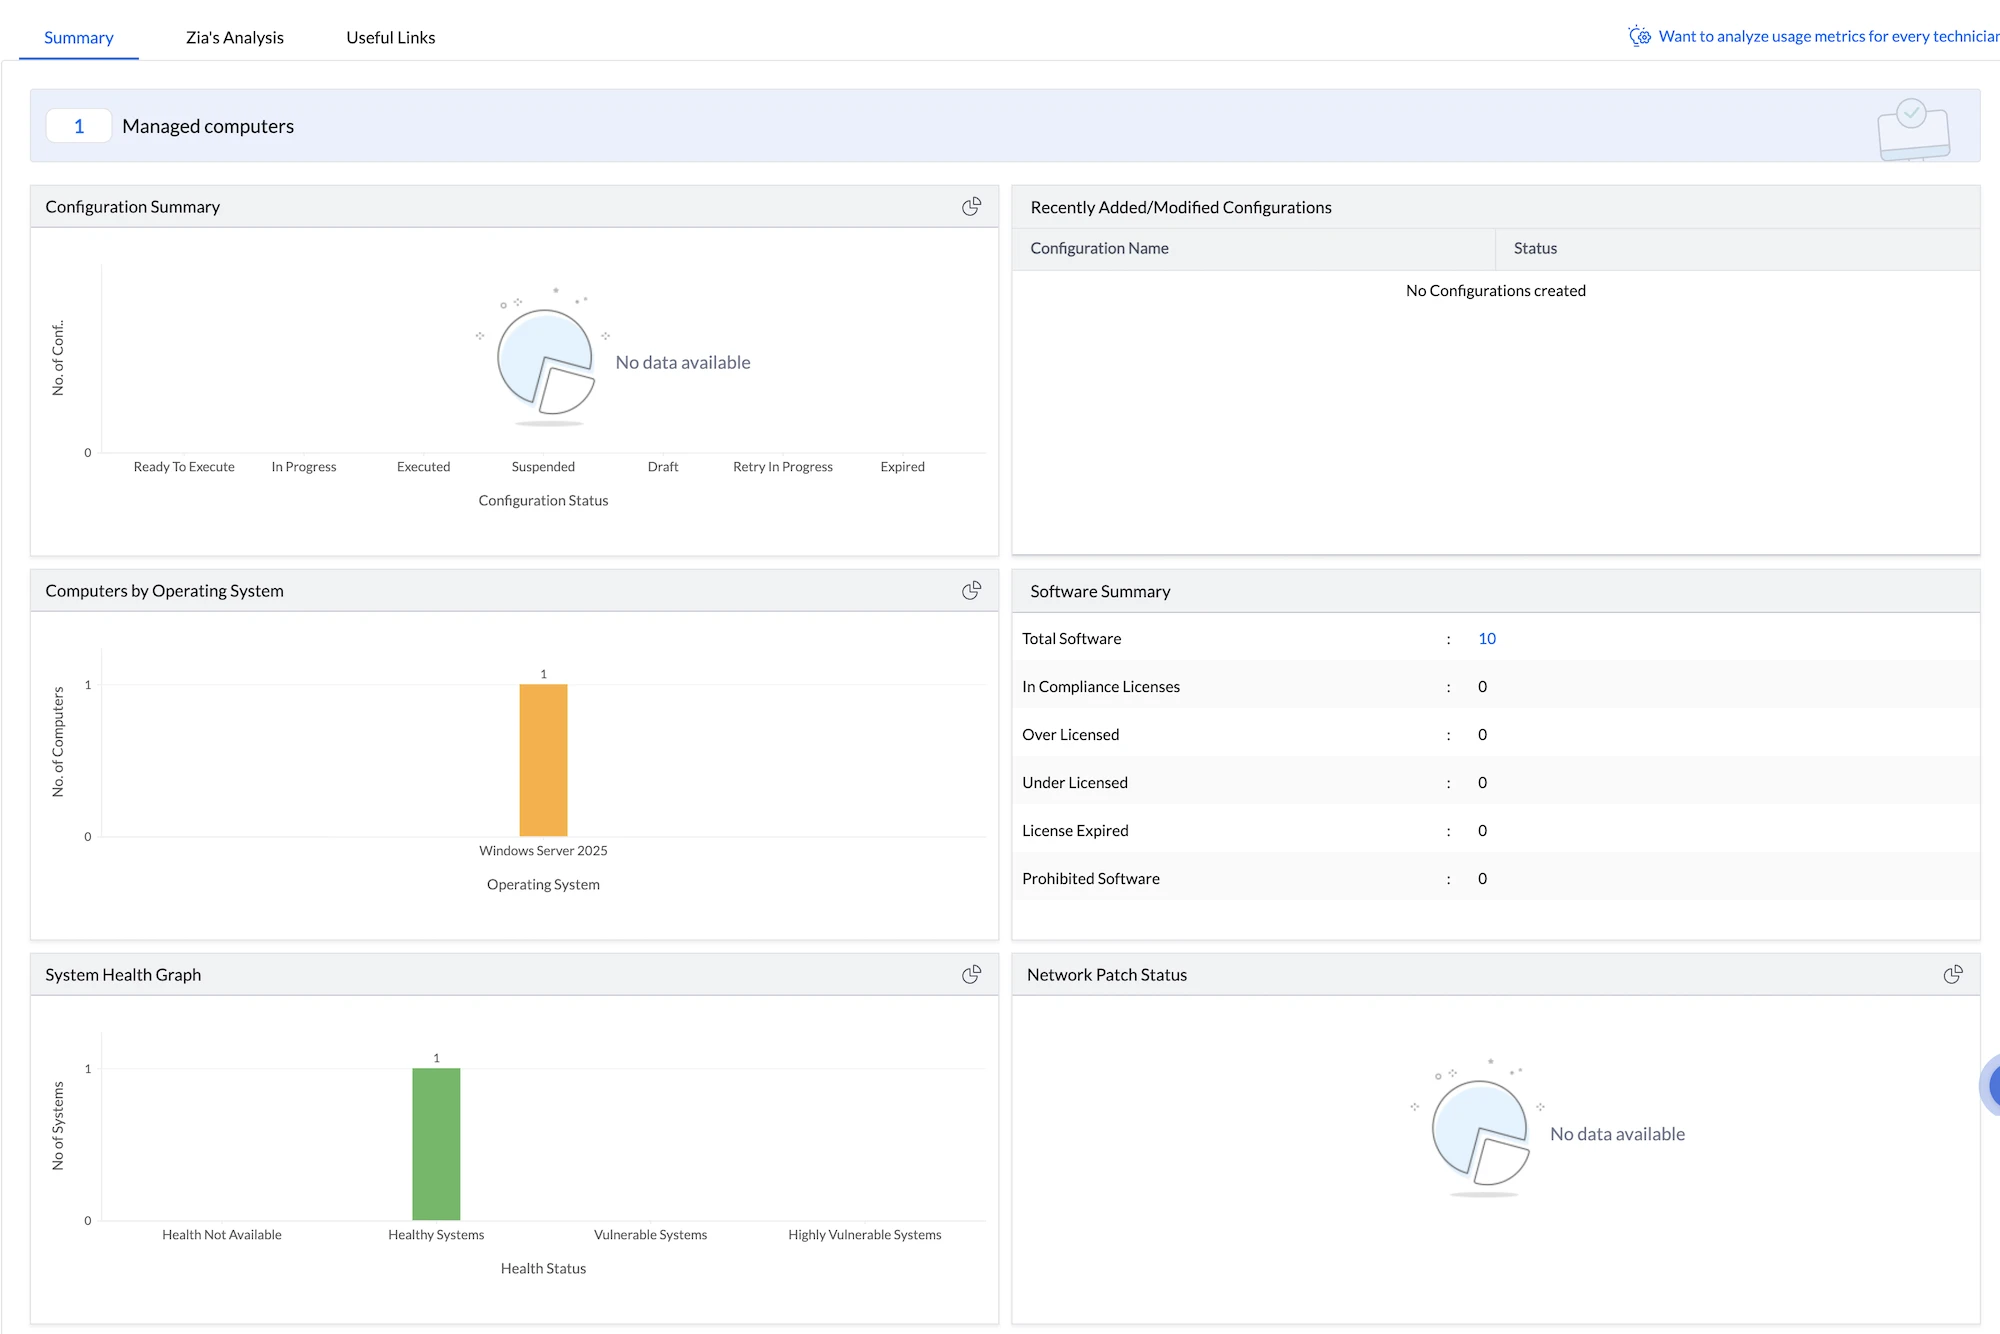
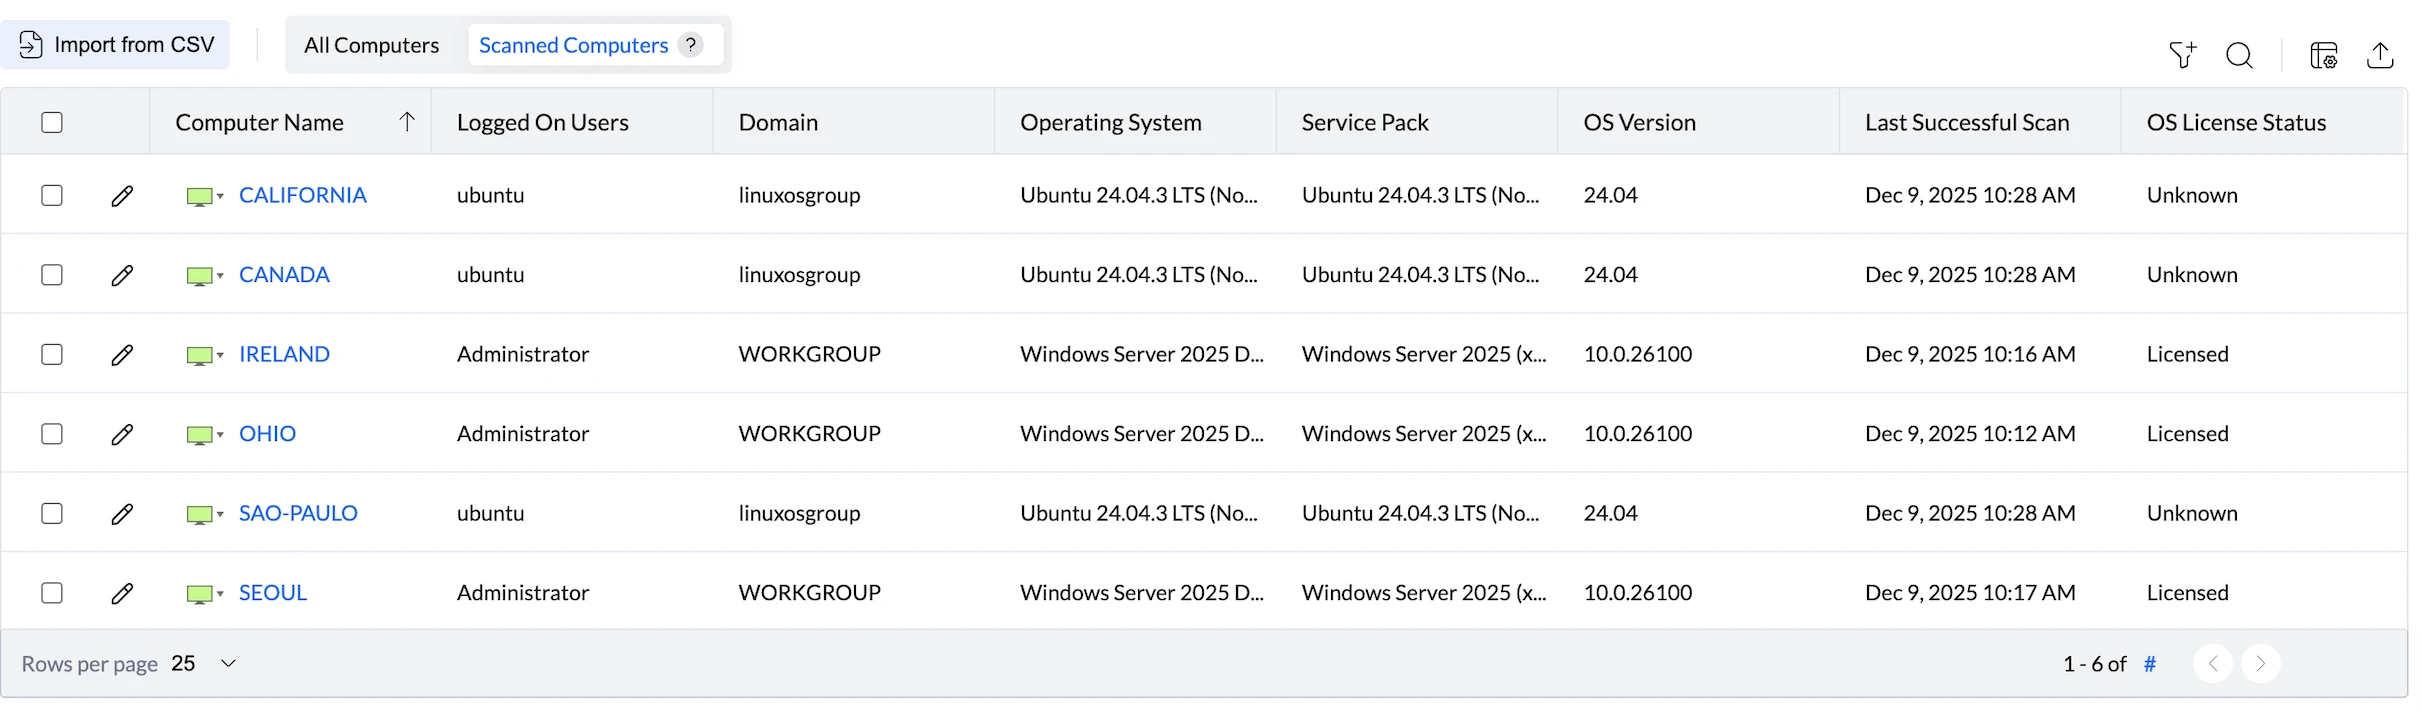
The ManageEngine dashboard opened with an inventory list showing all registered computers.
The top navigation bar contained module links:
- Configurations
- Threats & Patches
- Software Deployment
- Inventory (current view)
- Mobile Device Mgmt
- Admin
- Browsers
- BitLocker Management
- Agent
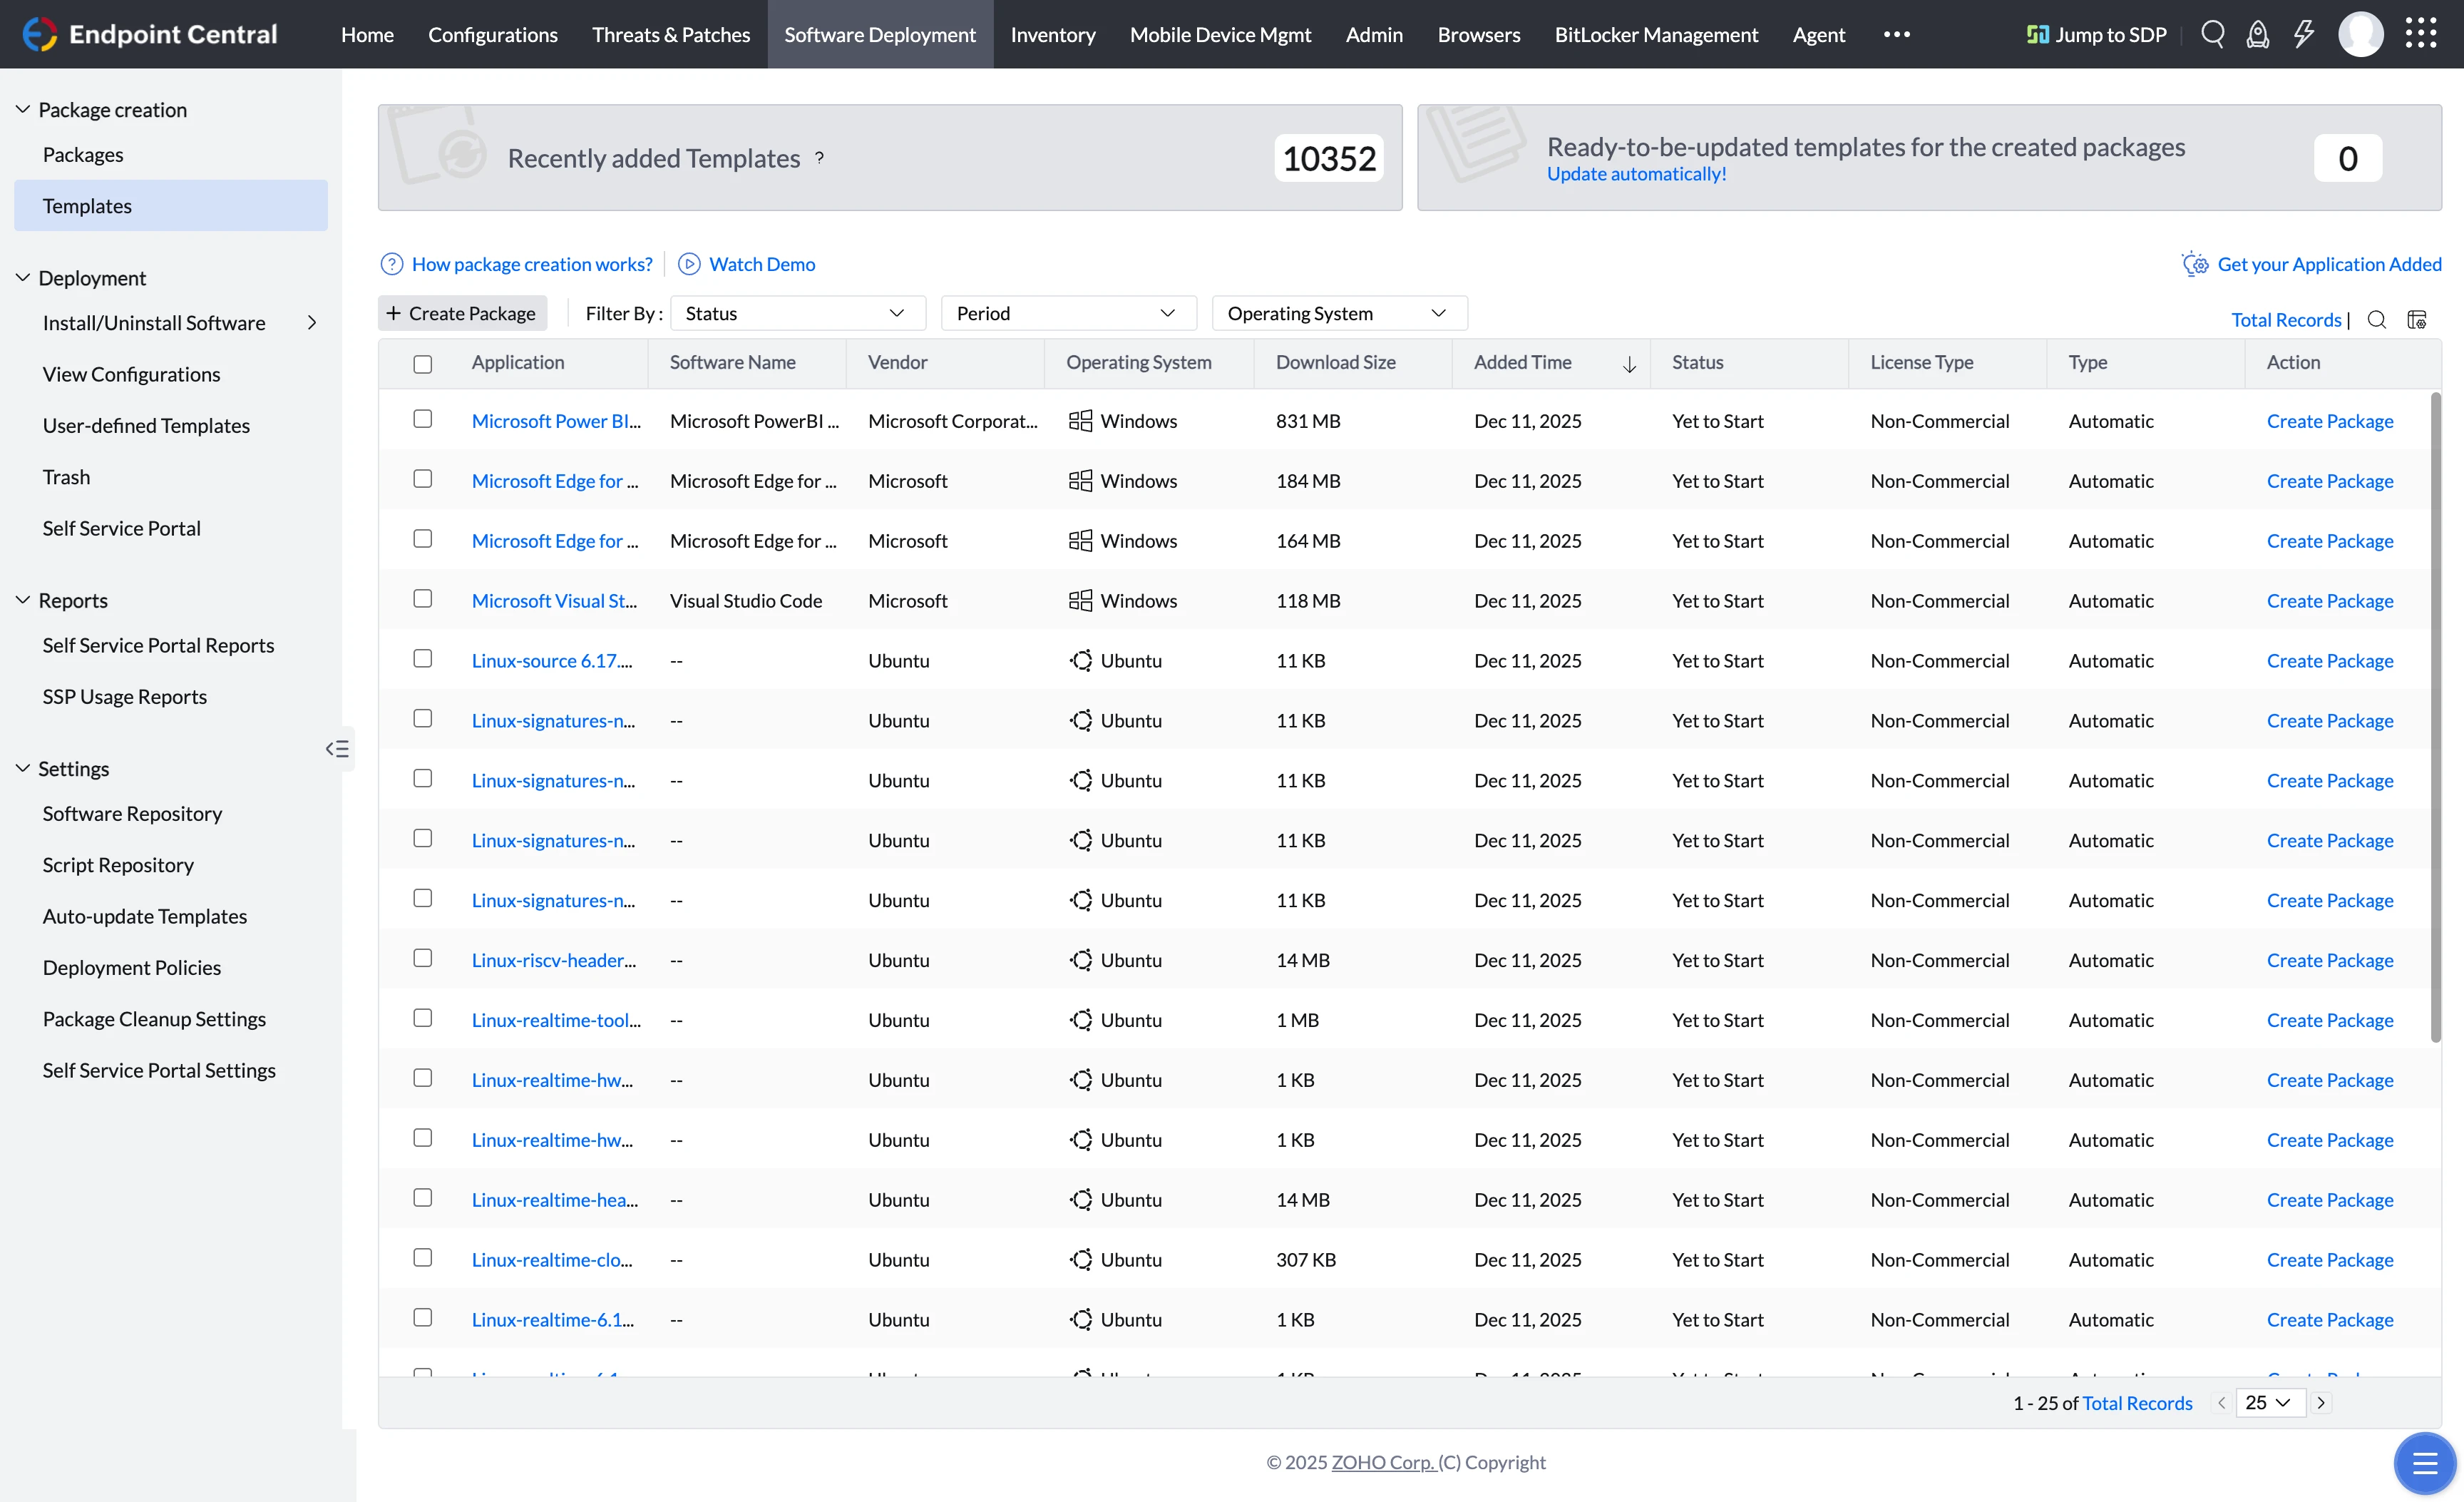
These modules provided fleet-wide views when accessed from the main menu. For example, clicking Software Deployment showed deployment statistics across all devices:
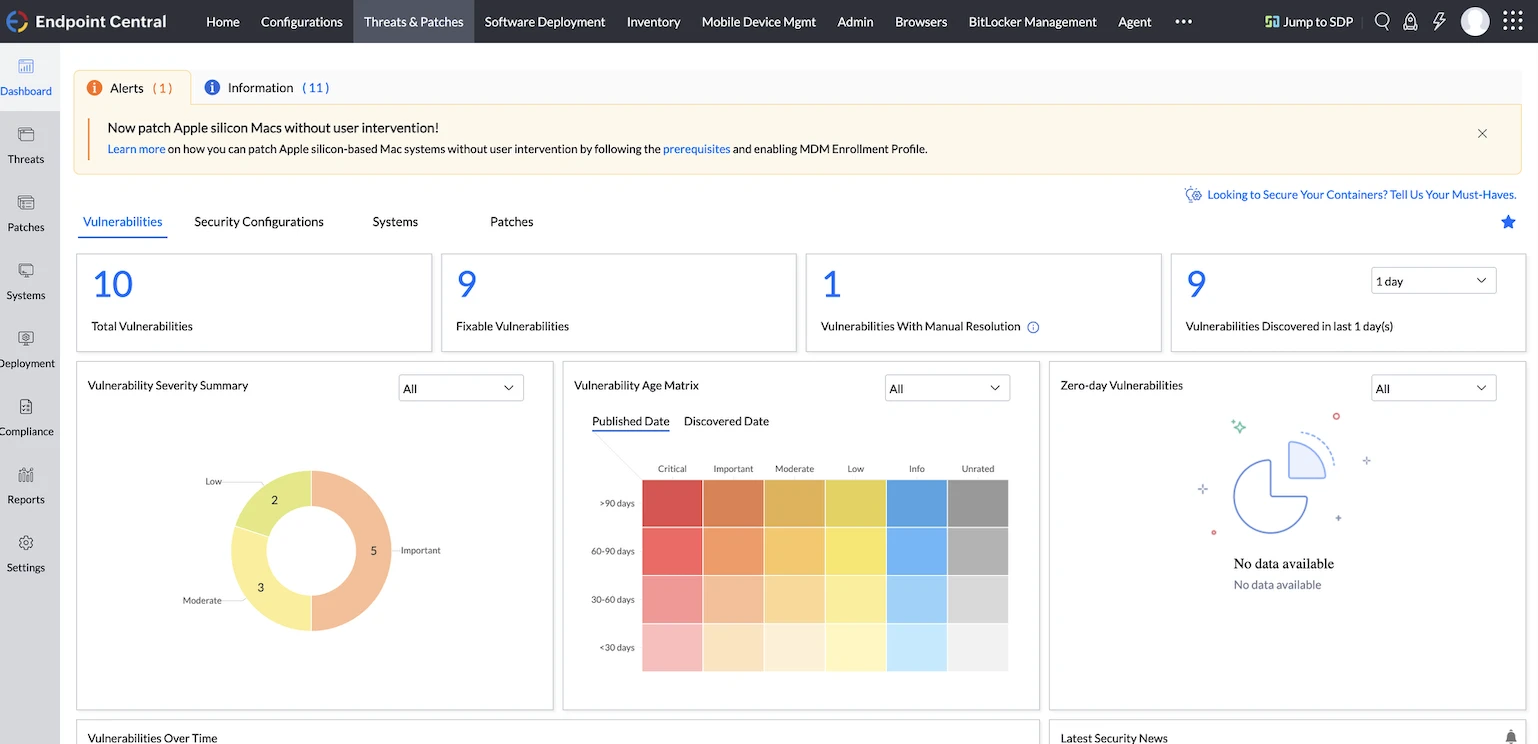
The Threats & Patches module displayed vulnerability summaries and patch status across the entire infrastructure:
These fleet-wide dashboards exist in all three RMM platforms. We focused on individual device management capabilities for this comparison.
Device Detail View
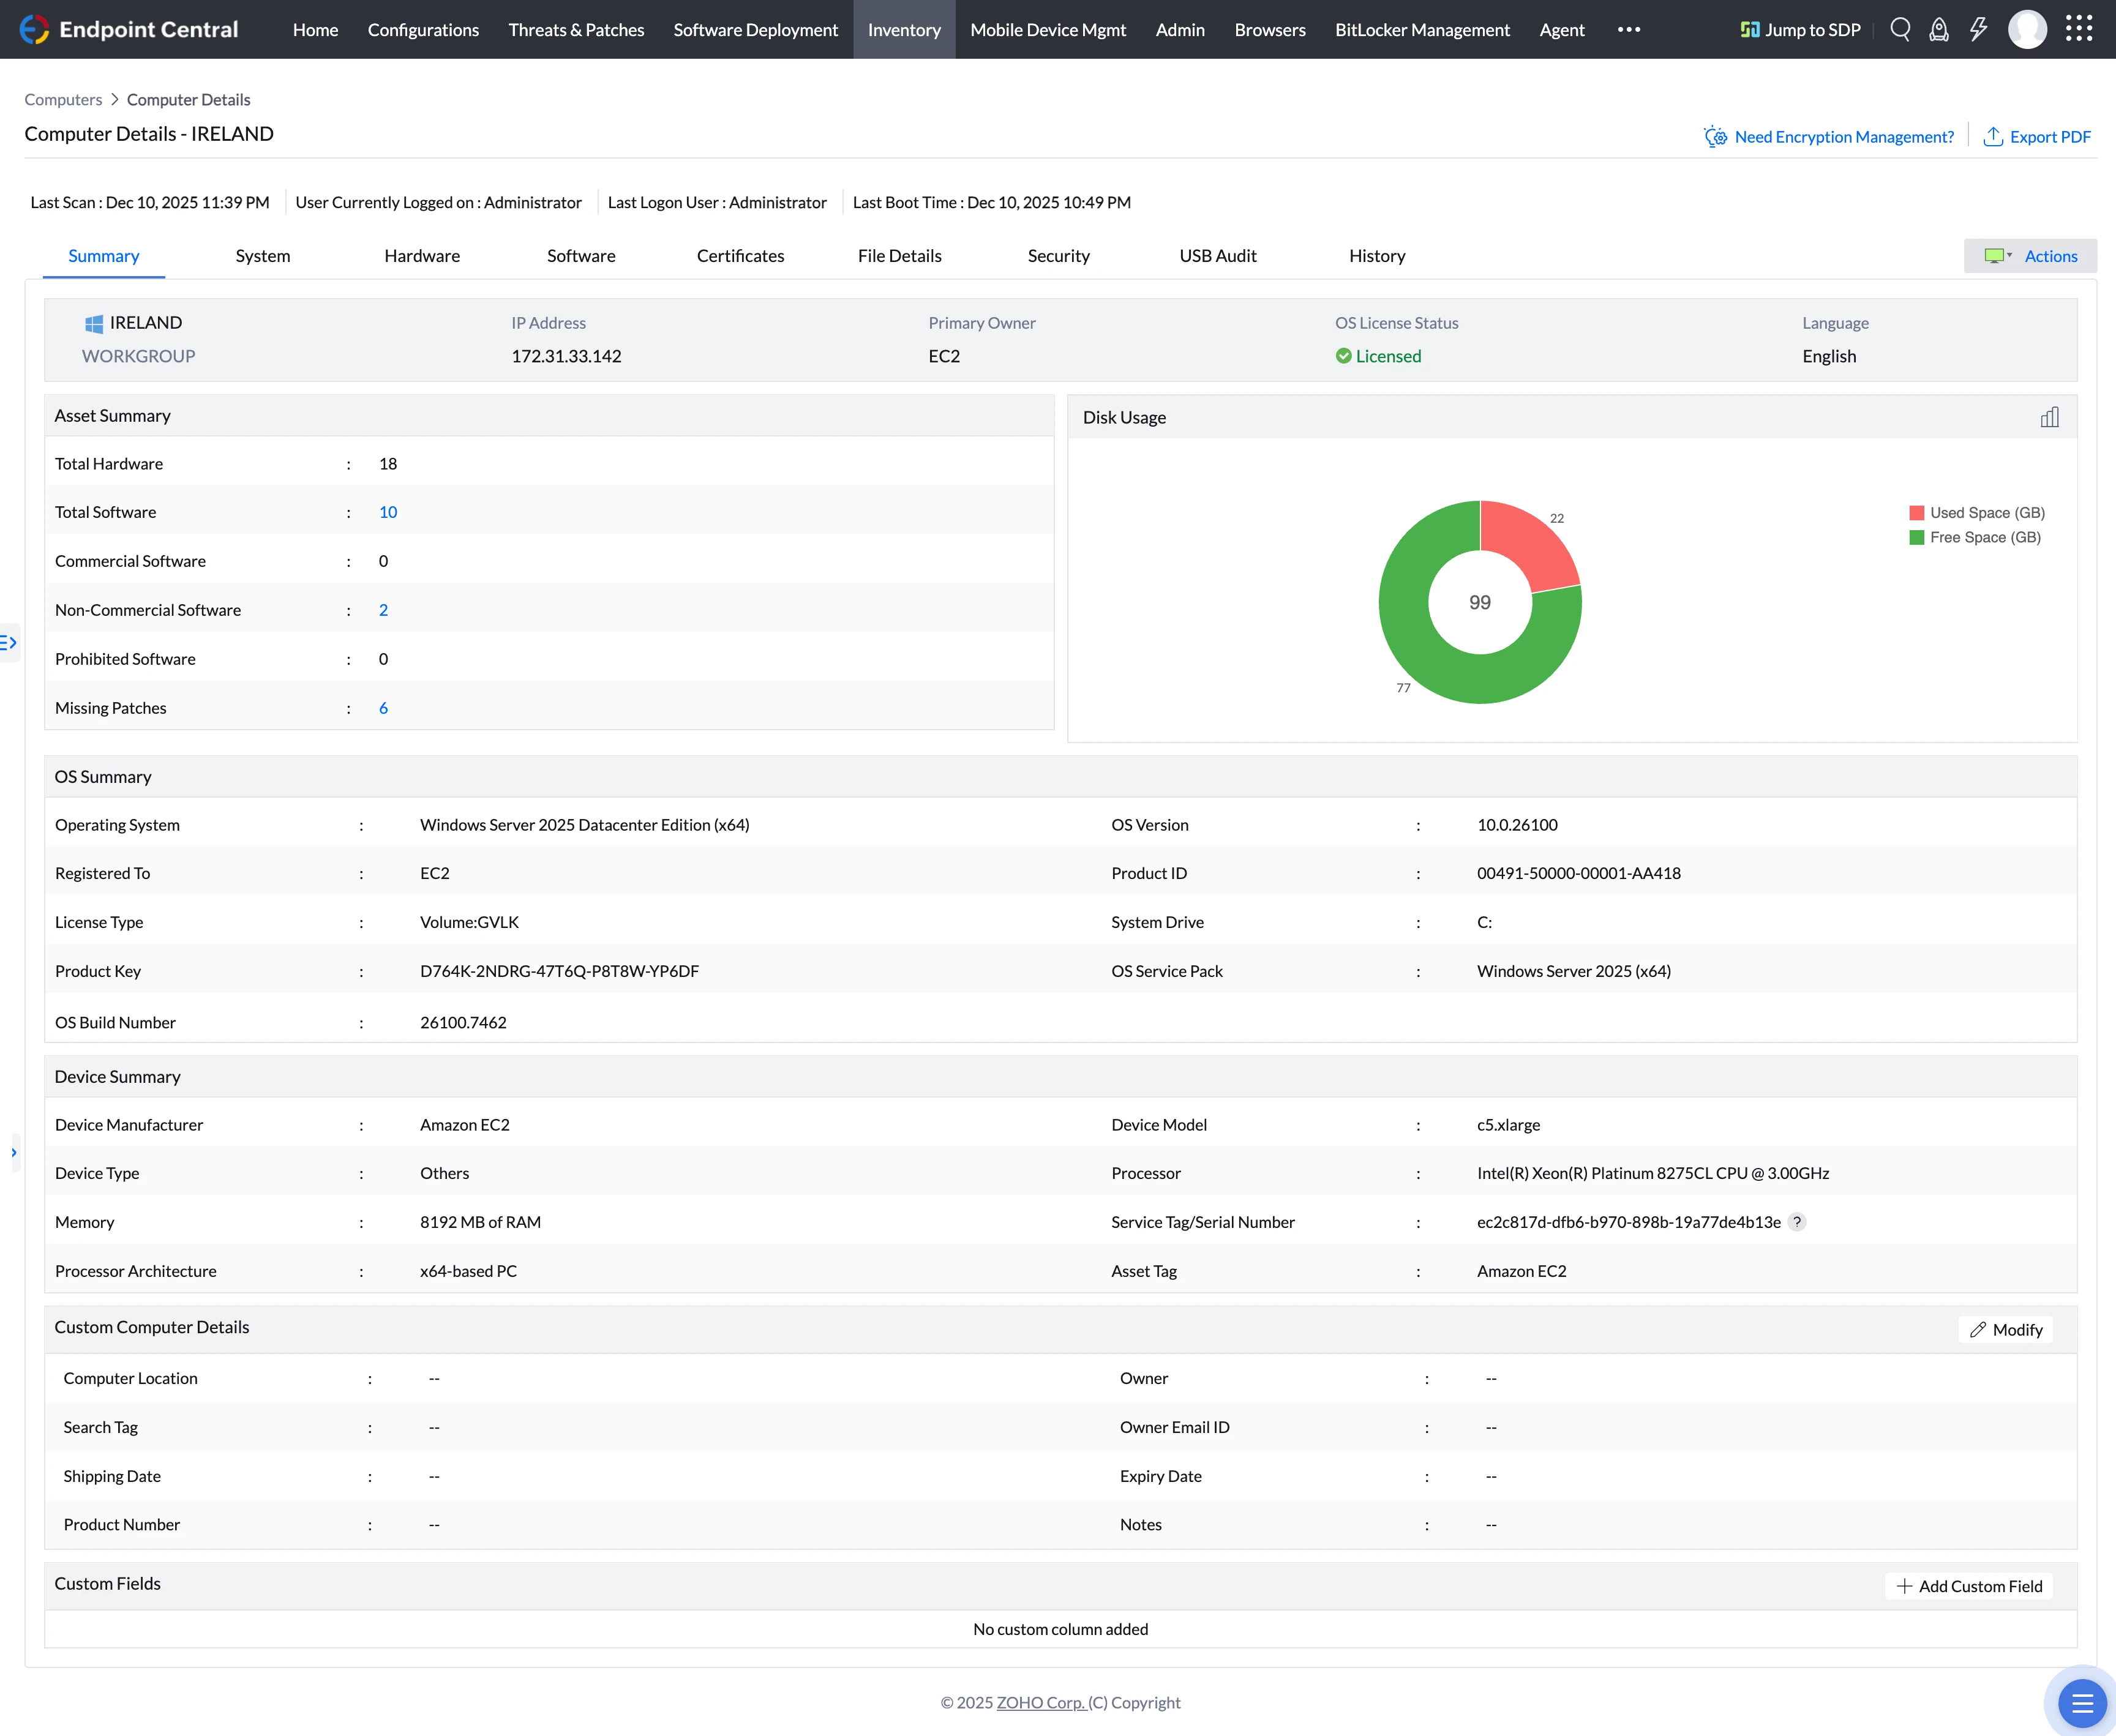
We clicked the IRELAND server from the computer list. The device page opened with multiple tabs: Summary, System, Hardware, Software, Certificates, File Details, Security, USB Audit, and History.
The Summary tab displayed.
Disk Usage (center): A donut chart showed used space (2 GB) vs free space (99 GB) with the C: drive label.
Quick Actions Menu
The top-right Actions button revealed a dropdown menu:
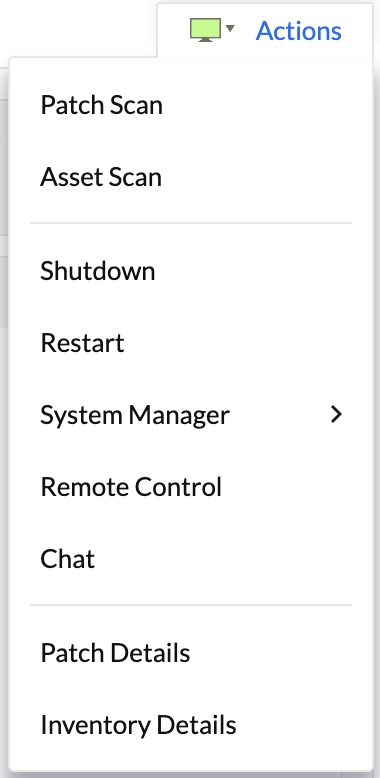
We could trigger scans, reboot the server, or access management tools with single clicks.
Testing Quick Actions
We returned to the Actions dropdown menu to test the available operations. We clicked “Patch Scan.” The system immediately confirmed the scan had started. Similarly, clicking “Asset Scan” triggered an immediate asset inventory scan.
We skipped testing Shutdown and Restart since their functionality seemed straightforward.
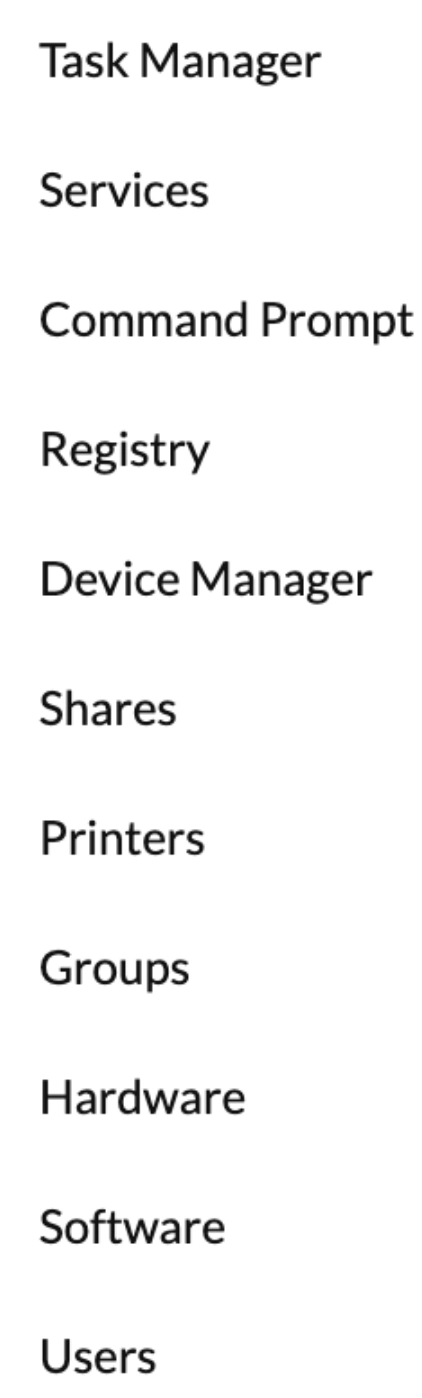
The System Manager submenu contained several remote administration tools. We explored each one.
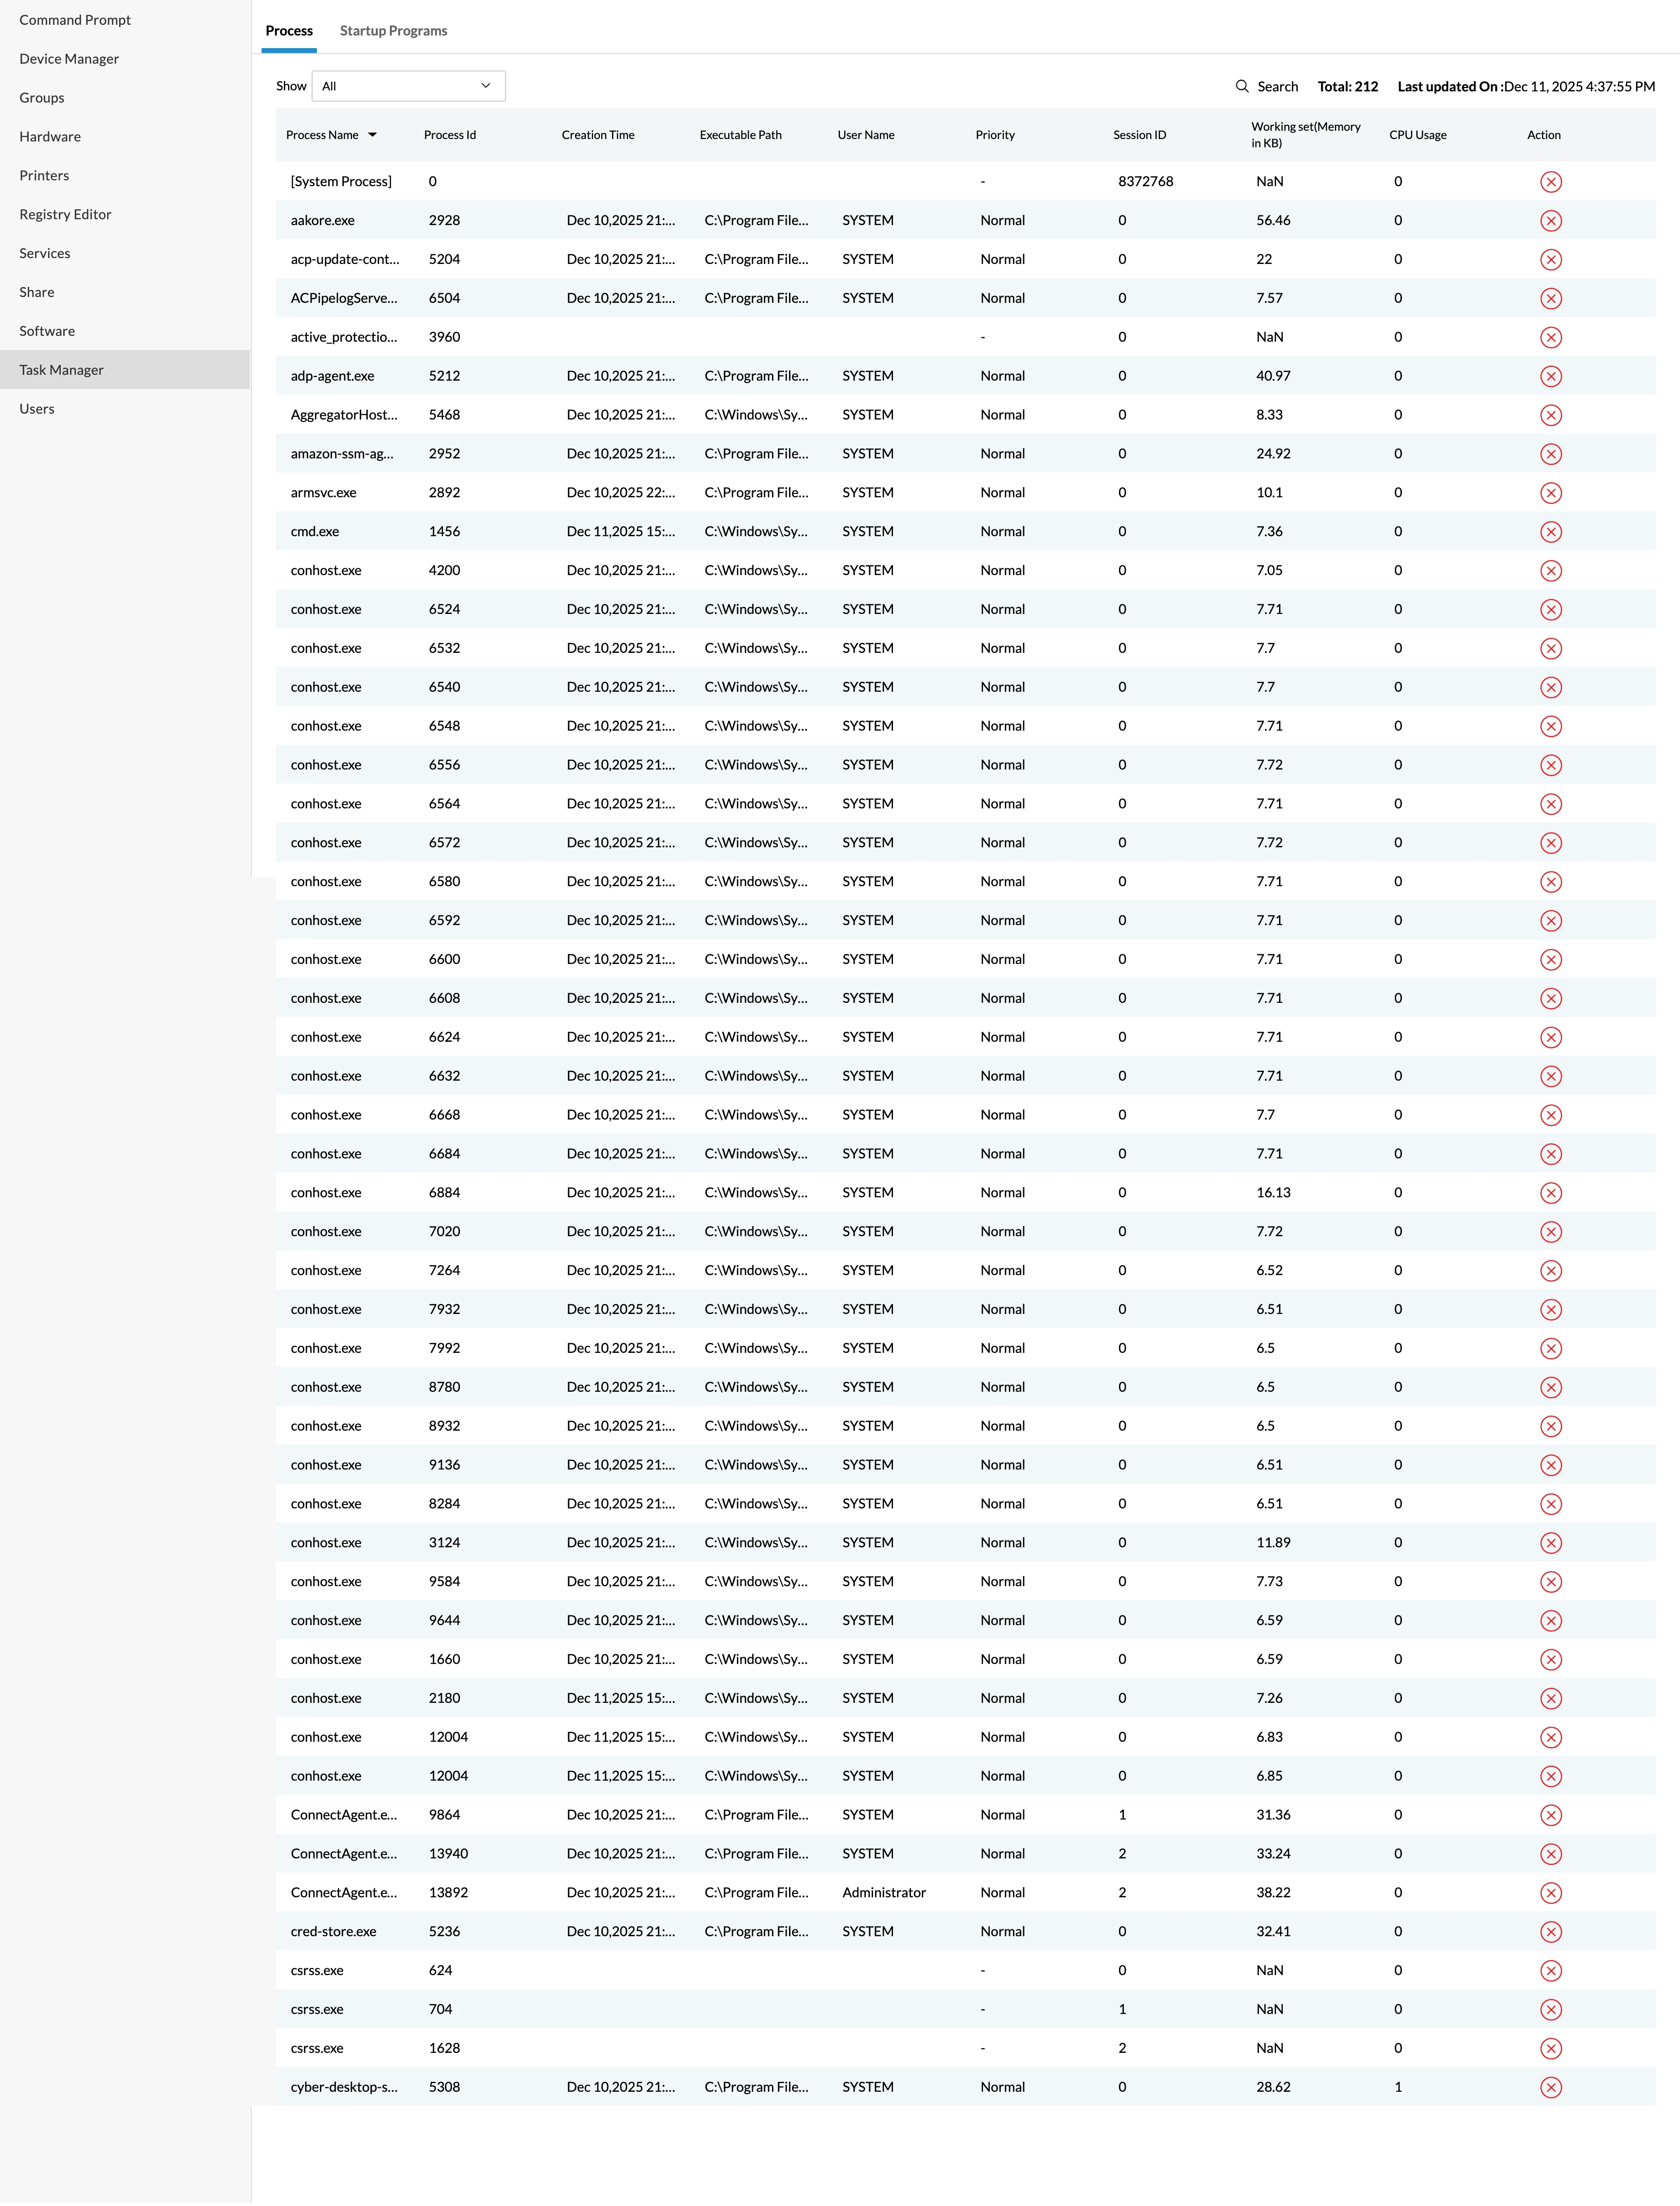
Clicking Task Manager opened a new page displaying all running processes.
We could:
- Search for specific processes
- Sort by any column
- View detailed information (PID, path, resource usage)
- Terminate any process using the stop button on the right
The Task Manager also had a “Startup Programs” tab, but it returned no results, which is unusual for a Windows Server installation.
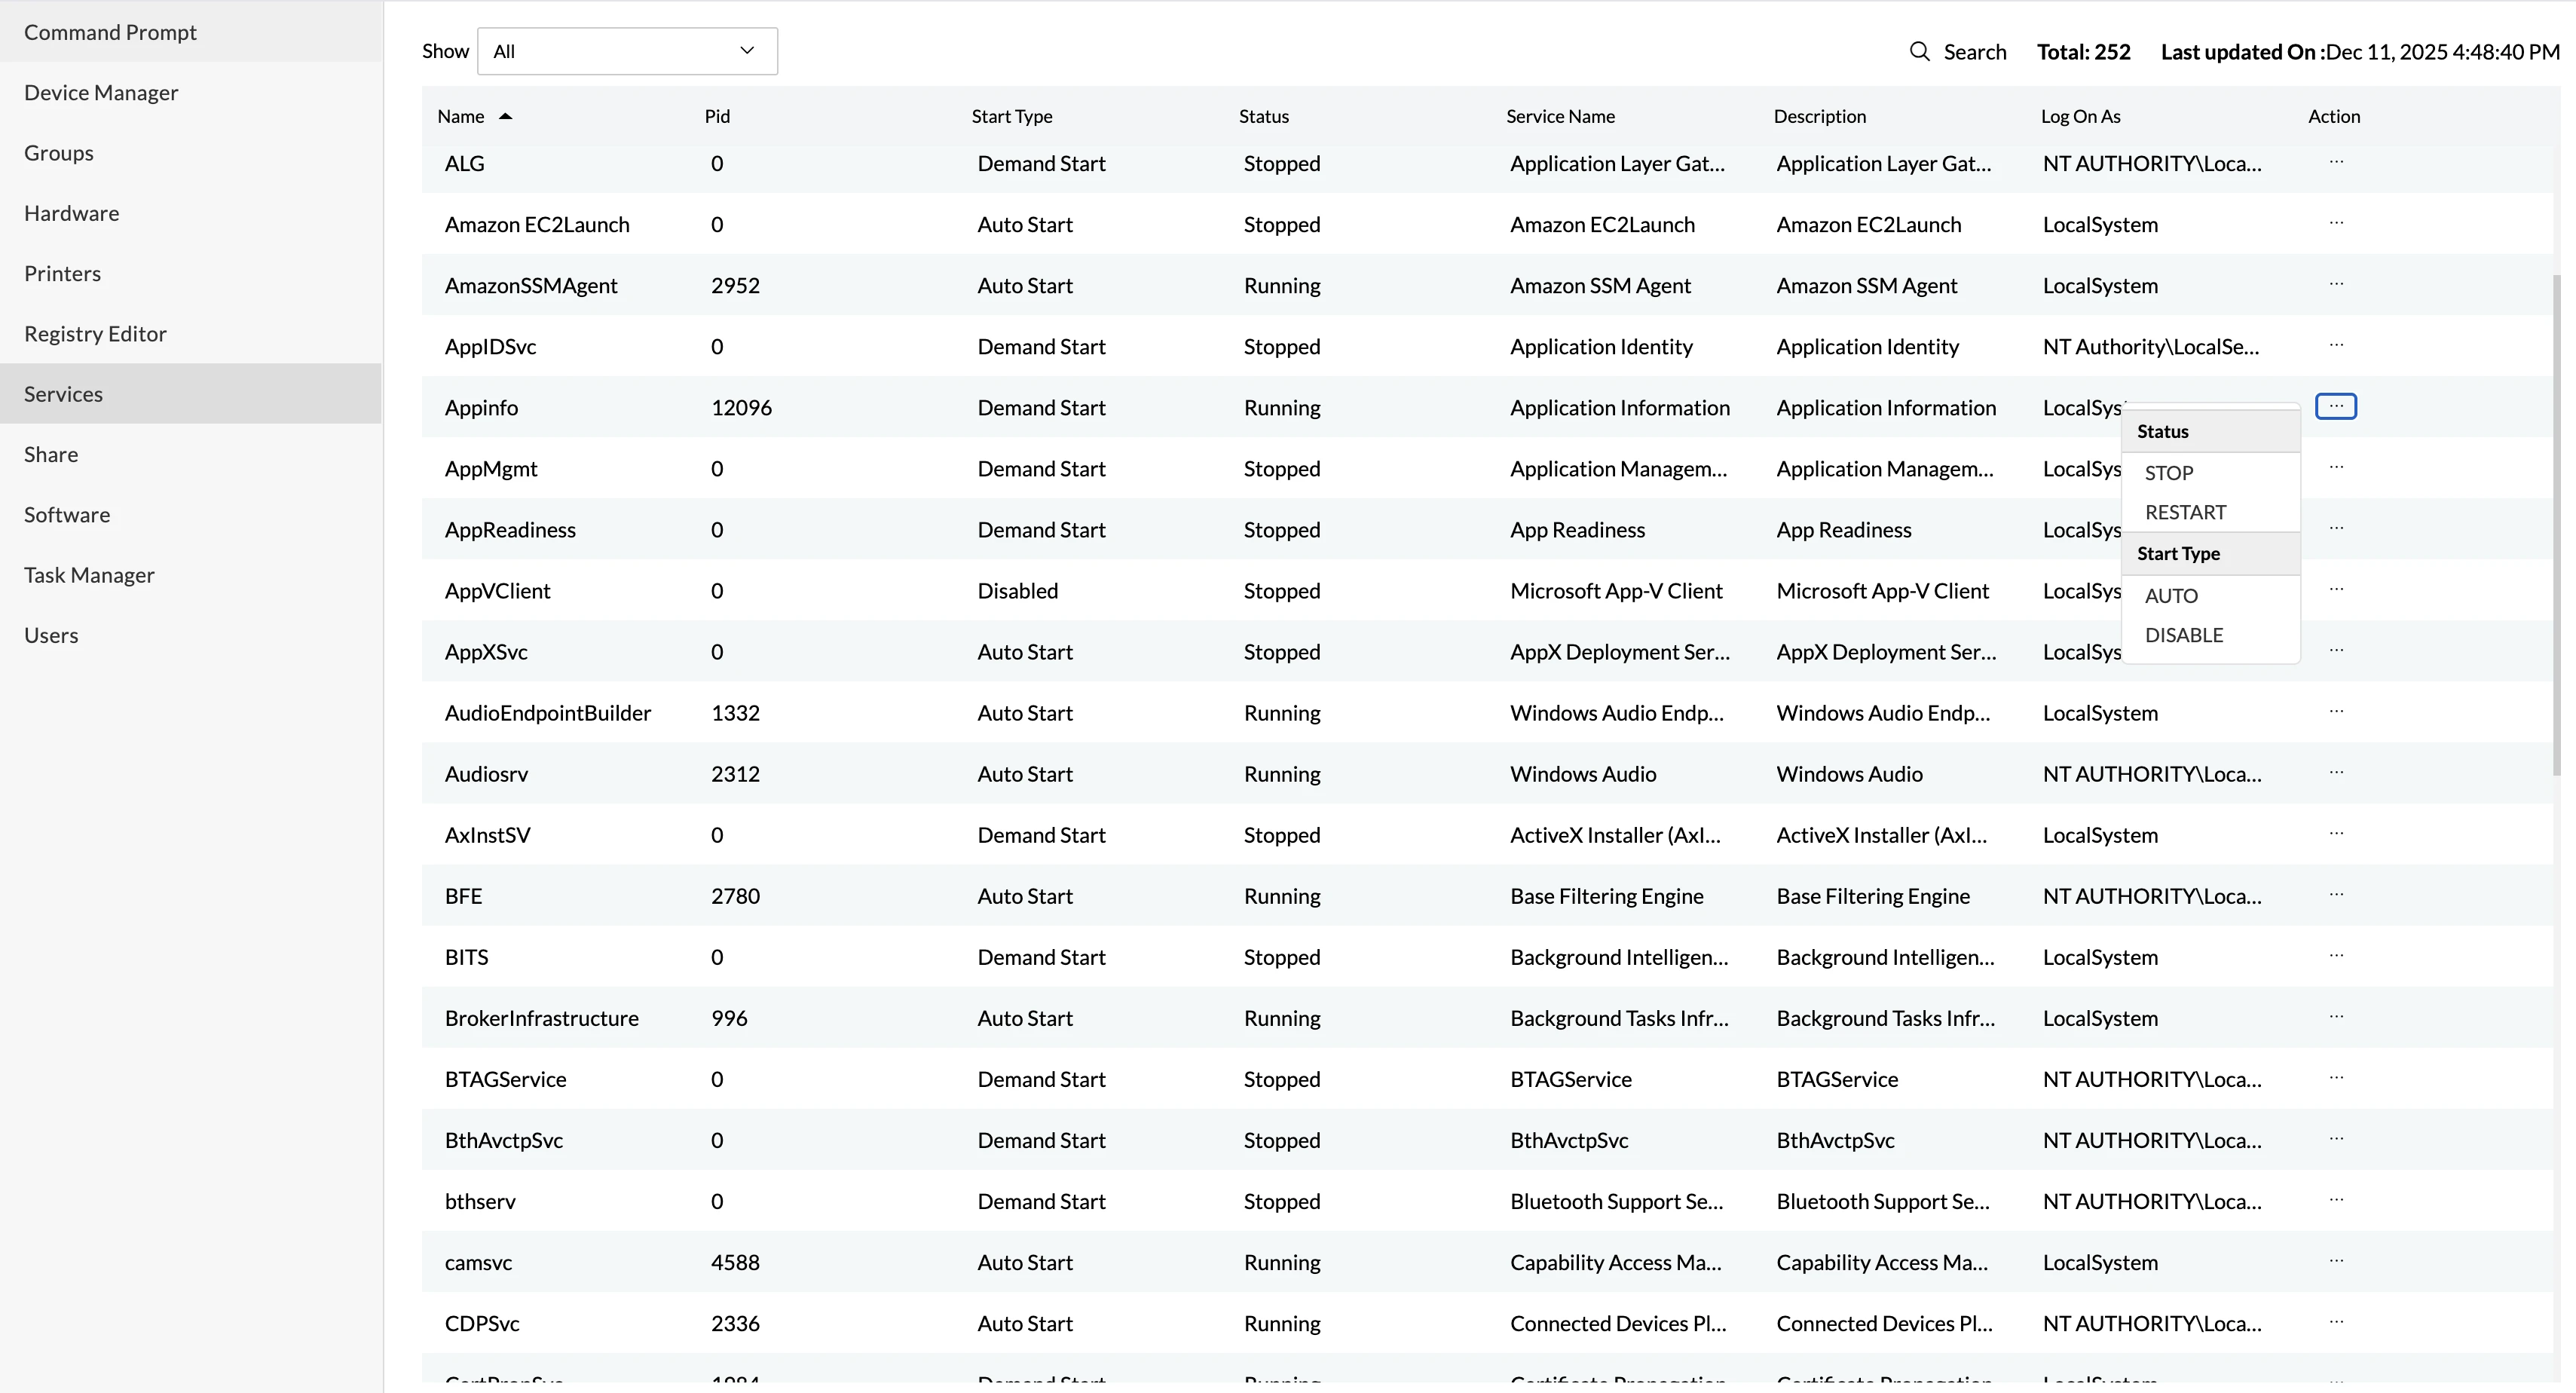
Services
The Services tool displayed all 252 system services with full management capabilities.
Clicking the action menu for any service revealed options:
- Status
- STOP
- RESTART
- Start Type
- AUTO
- DISABLE
This provided the service management functionality missing from the System tab’s Services view. We could start, stop, and restart services, and change their startup configuration, which is essential for troubleshooting and maintenance.
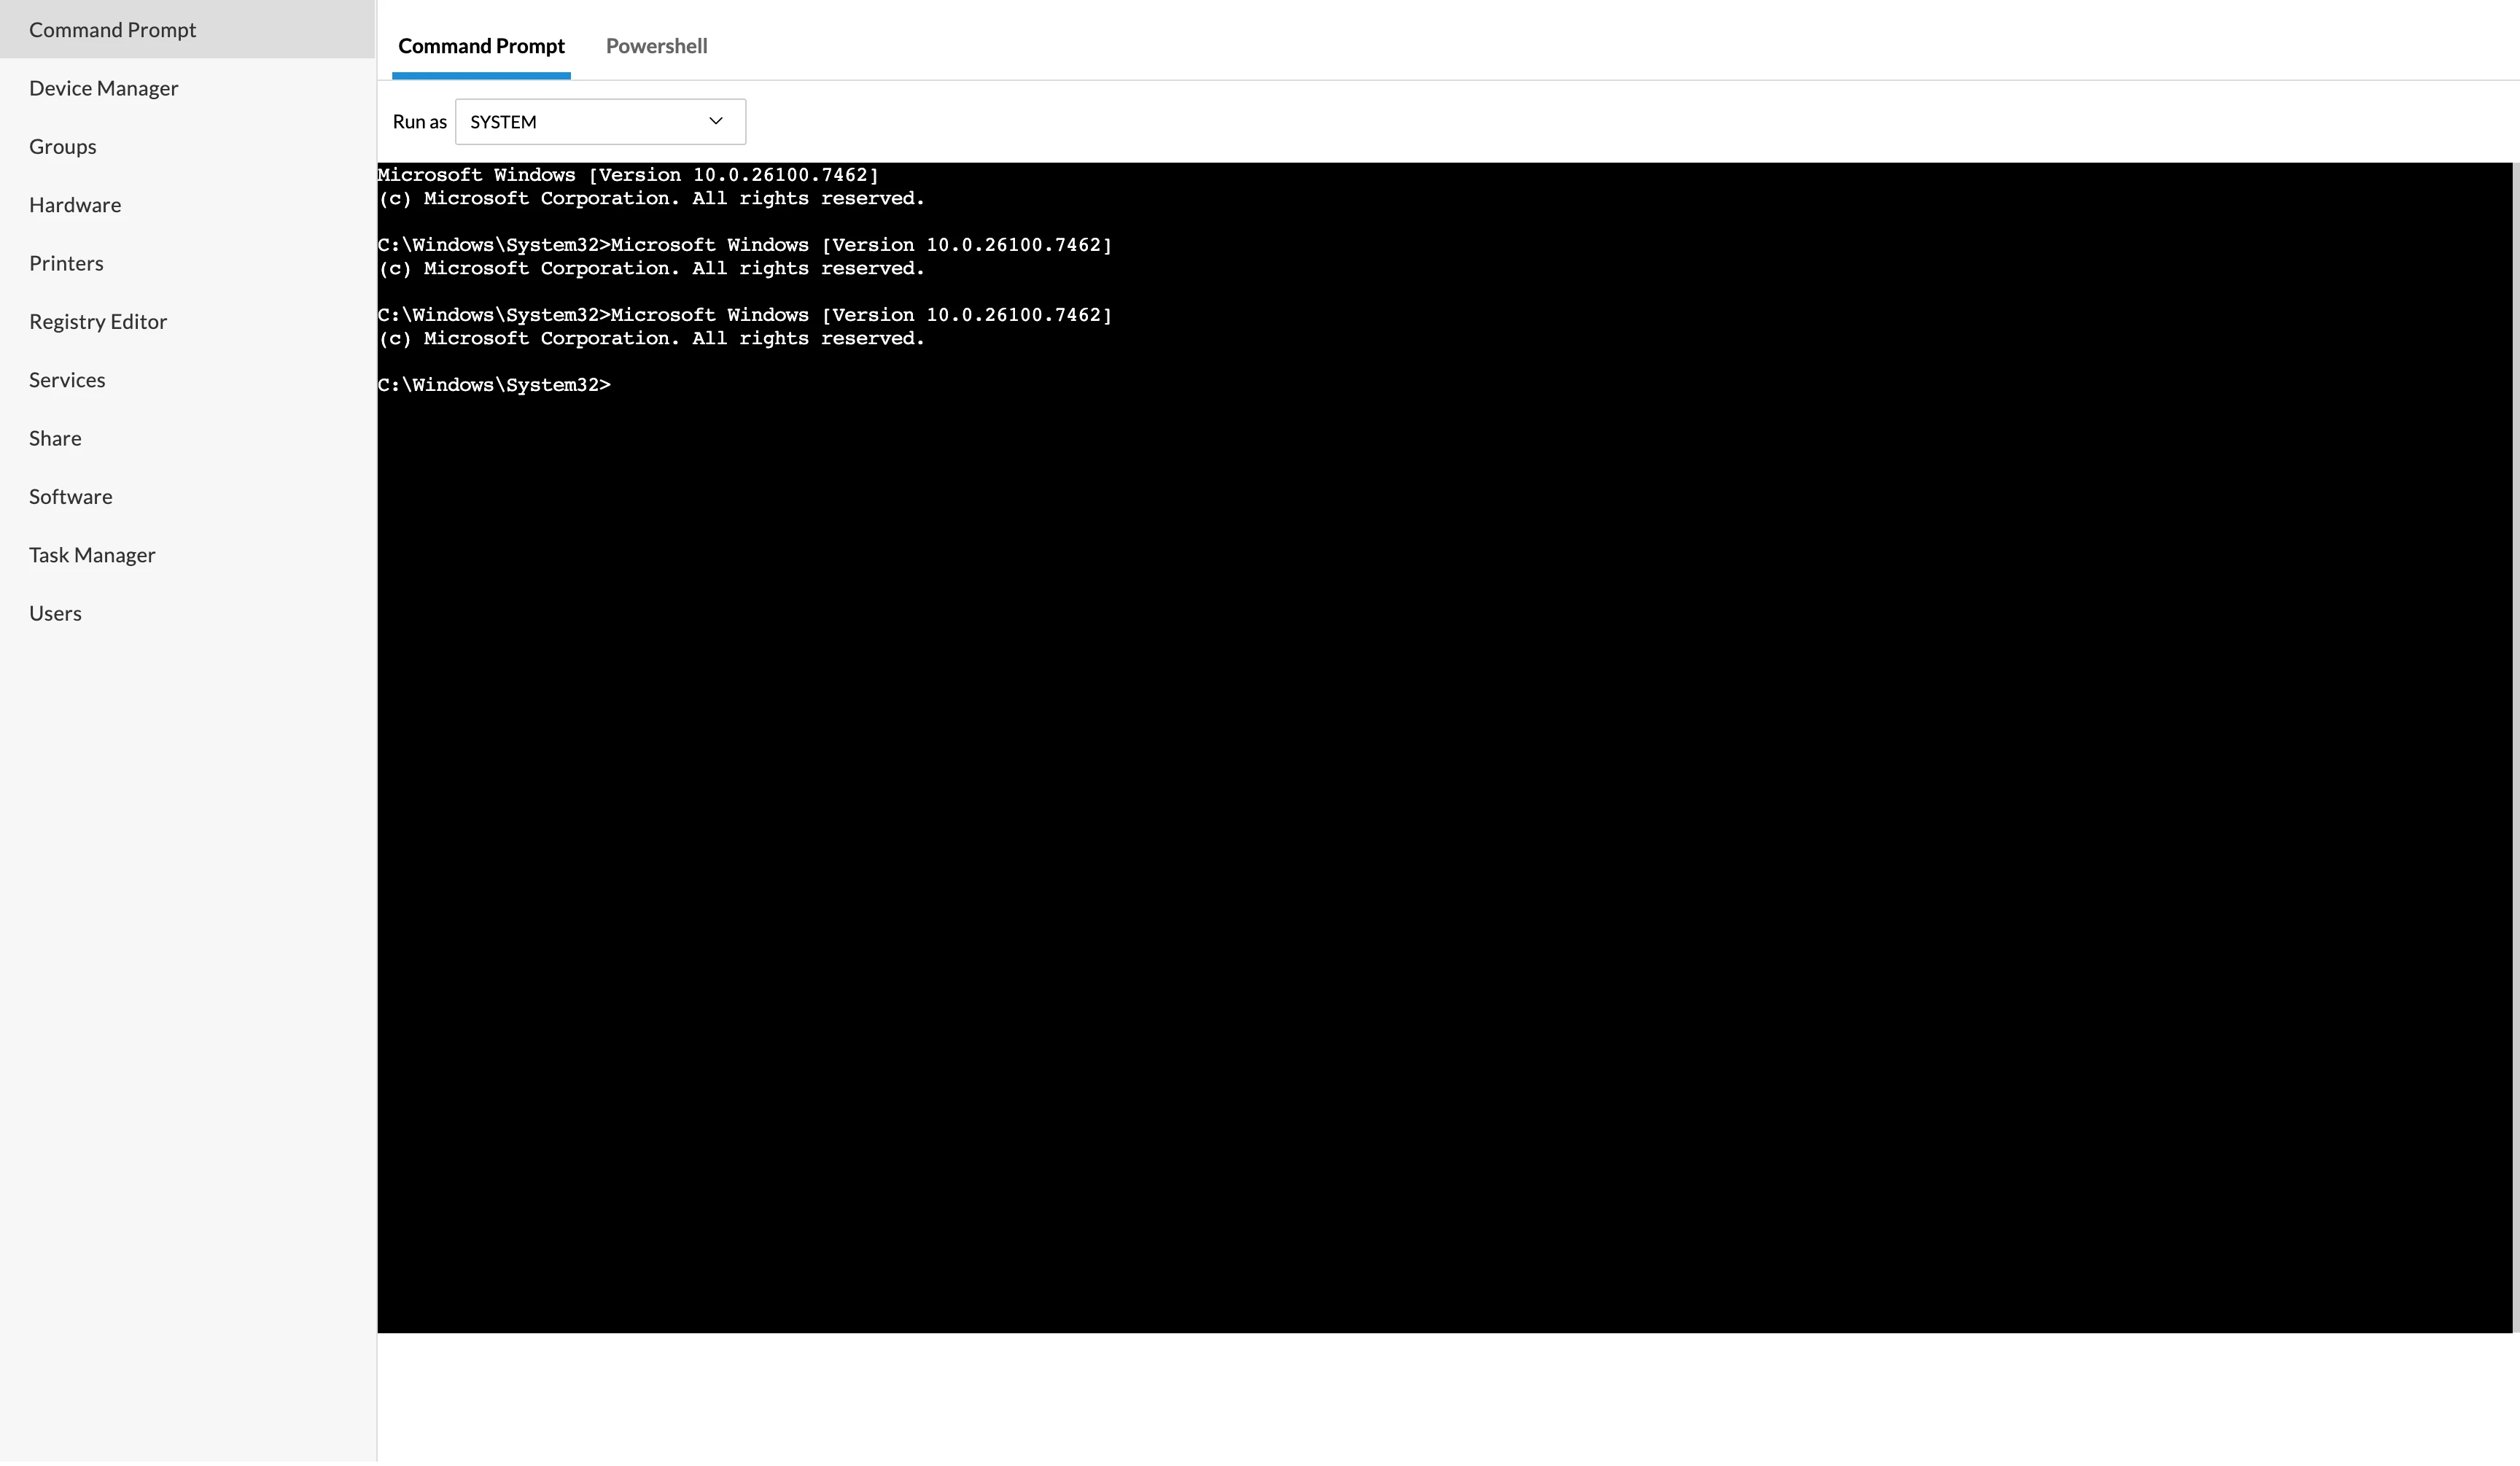
Command Prompt
The Command Prompt tool opened a browser-based terminal with two tabs: Command Prompt and PowerShell.
We could choose between:
- Command Prompt or PowerShell (tabs)
- SYSTEM user or Administrator (dropdown)
This flexibility matched NinjaOne’s terminal offering, though NinjaOne also provided 32-bit/64-bit options for Windows.
Registry Editor
The Registry tool opened a web-based registry editor. Remote registry editing through a browser eliminates the need for RDP access when modifying system configurations. NinjaOne also offered this feature for Windows devices.
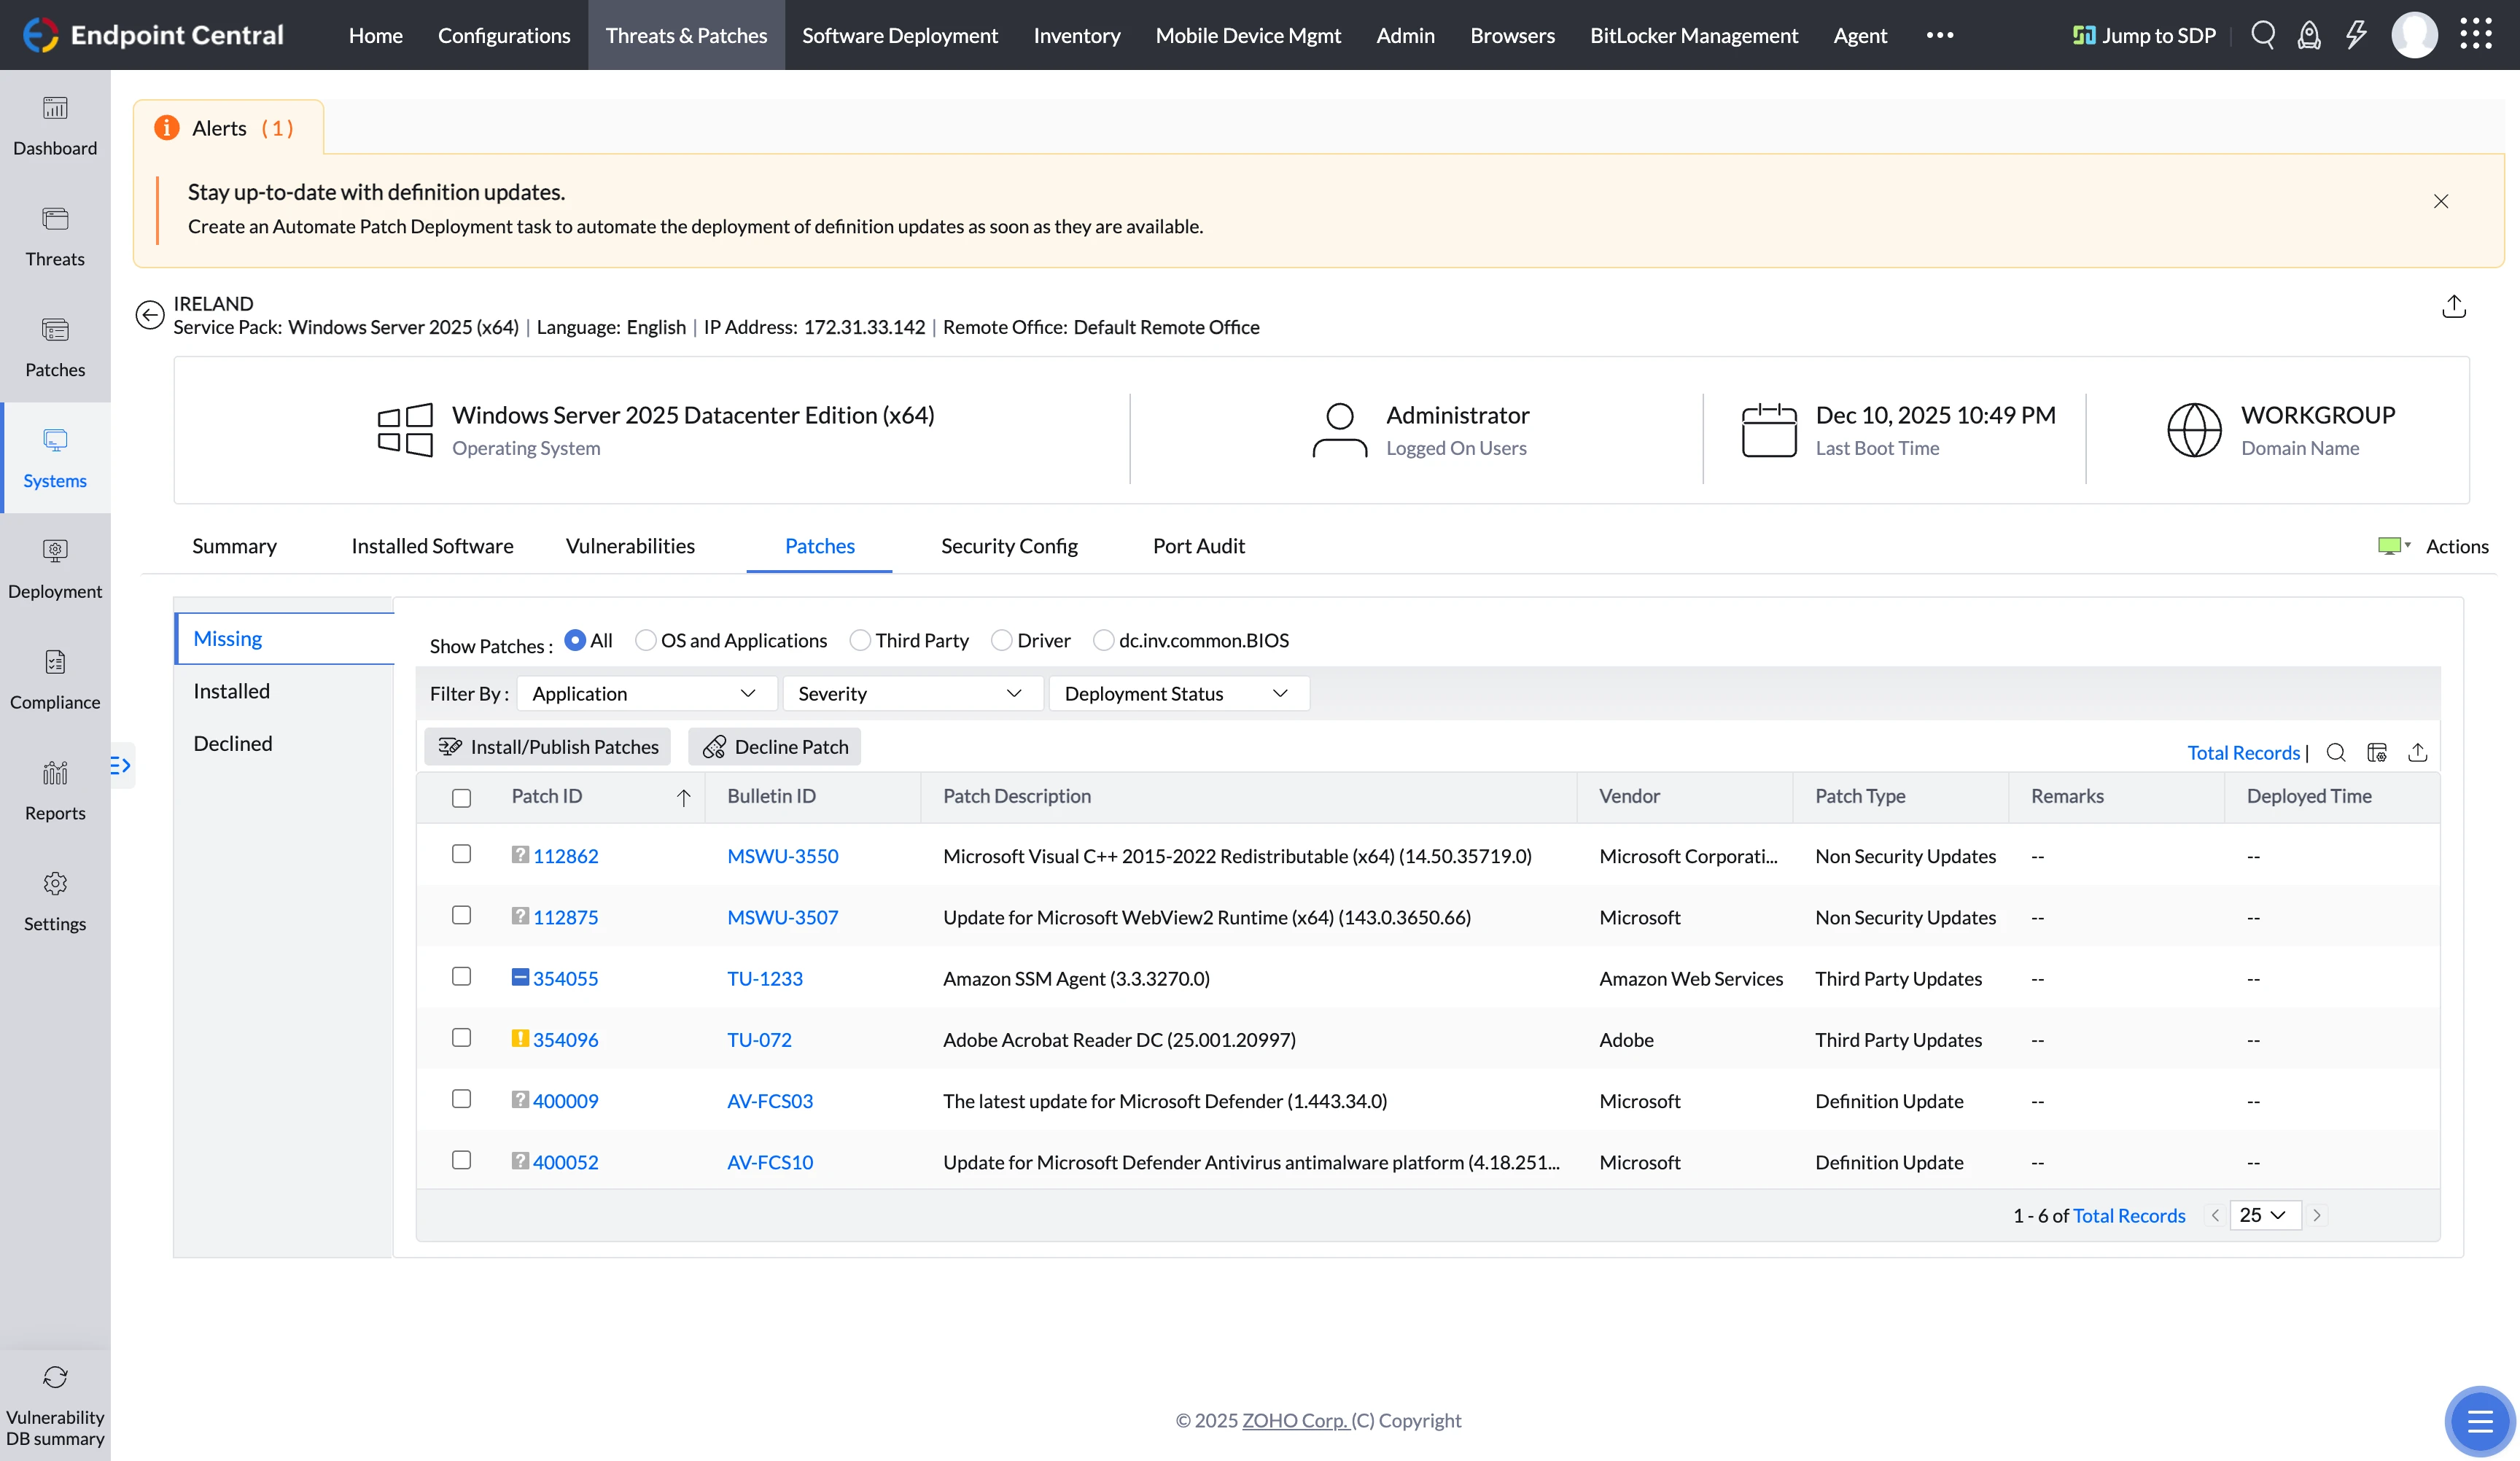
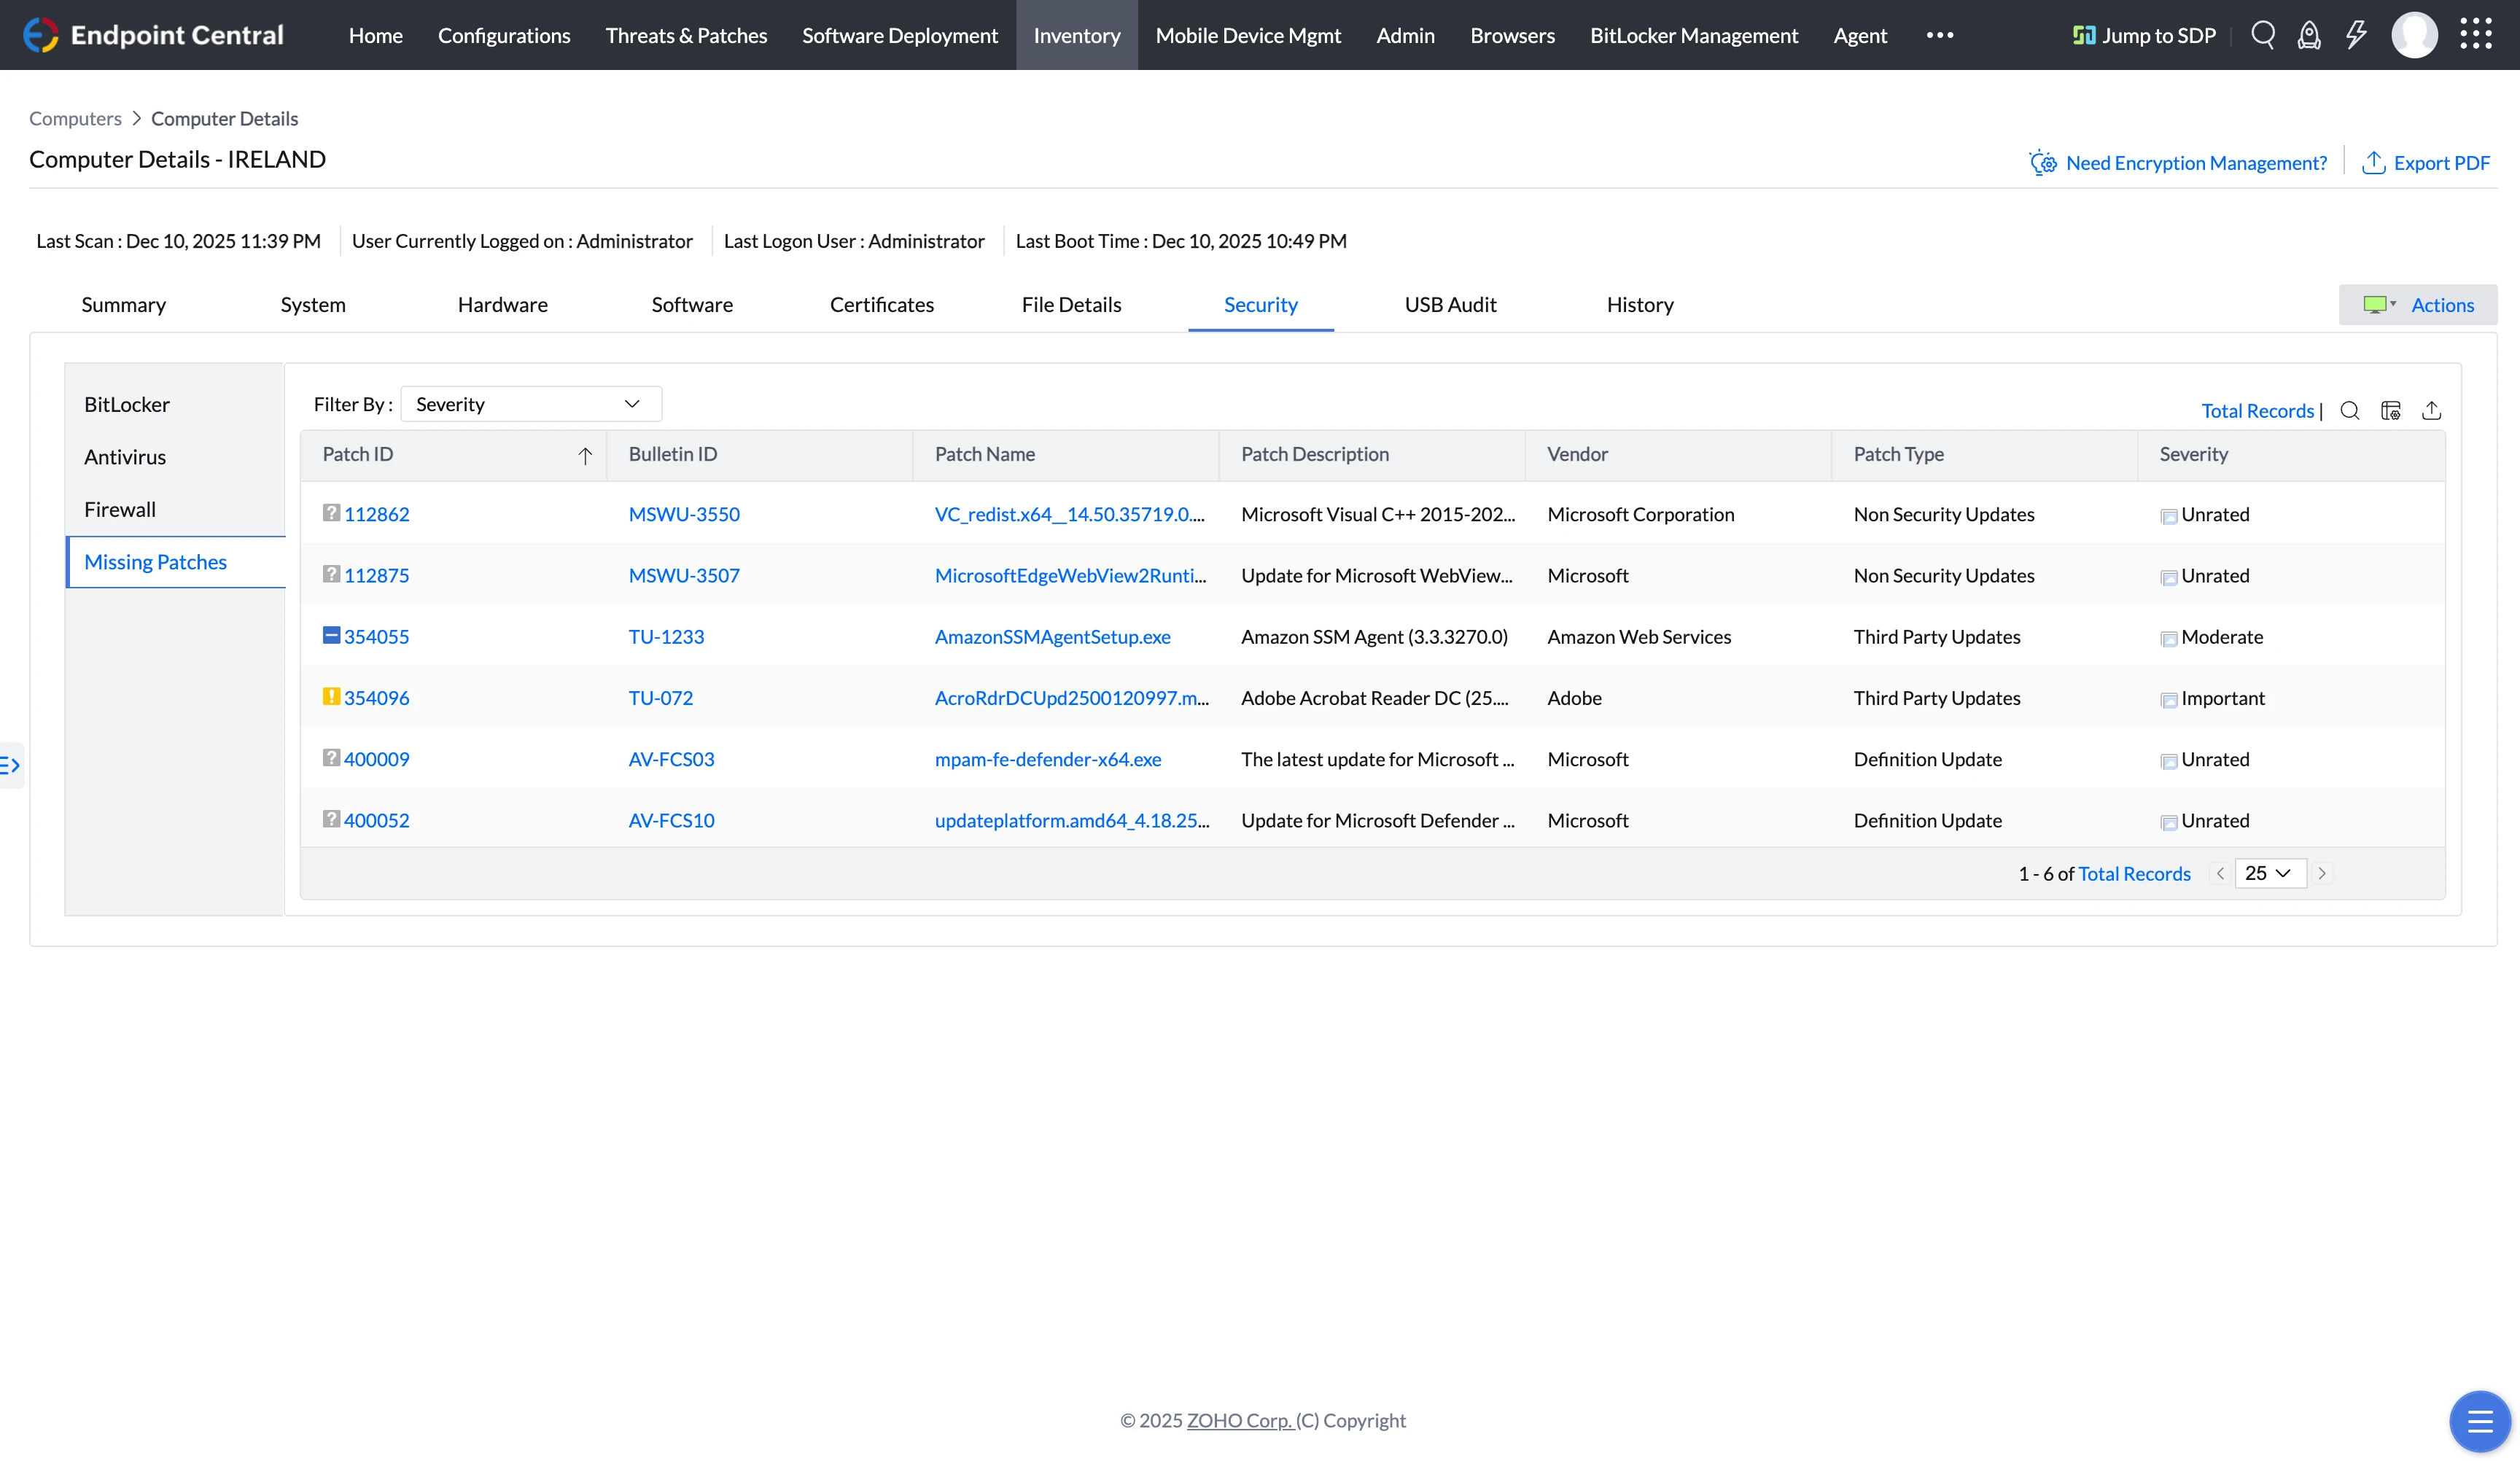
Patch Details
Clicking Patch Details brought us back to the patching interface we’d seen earlier. Remember, we’d triggered a patch scan from the Actions menu.
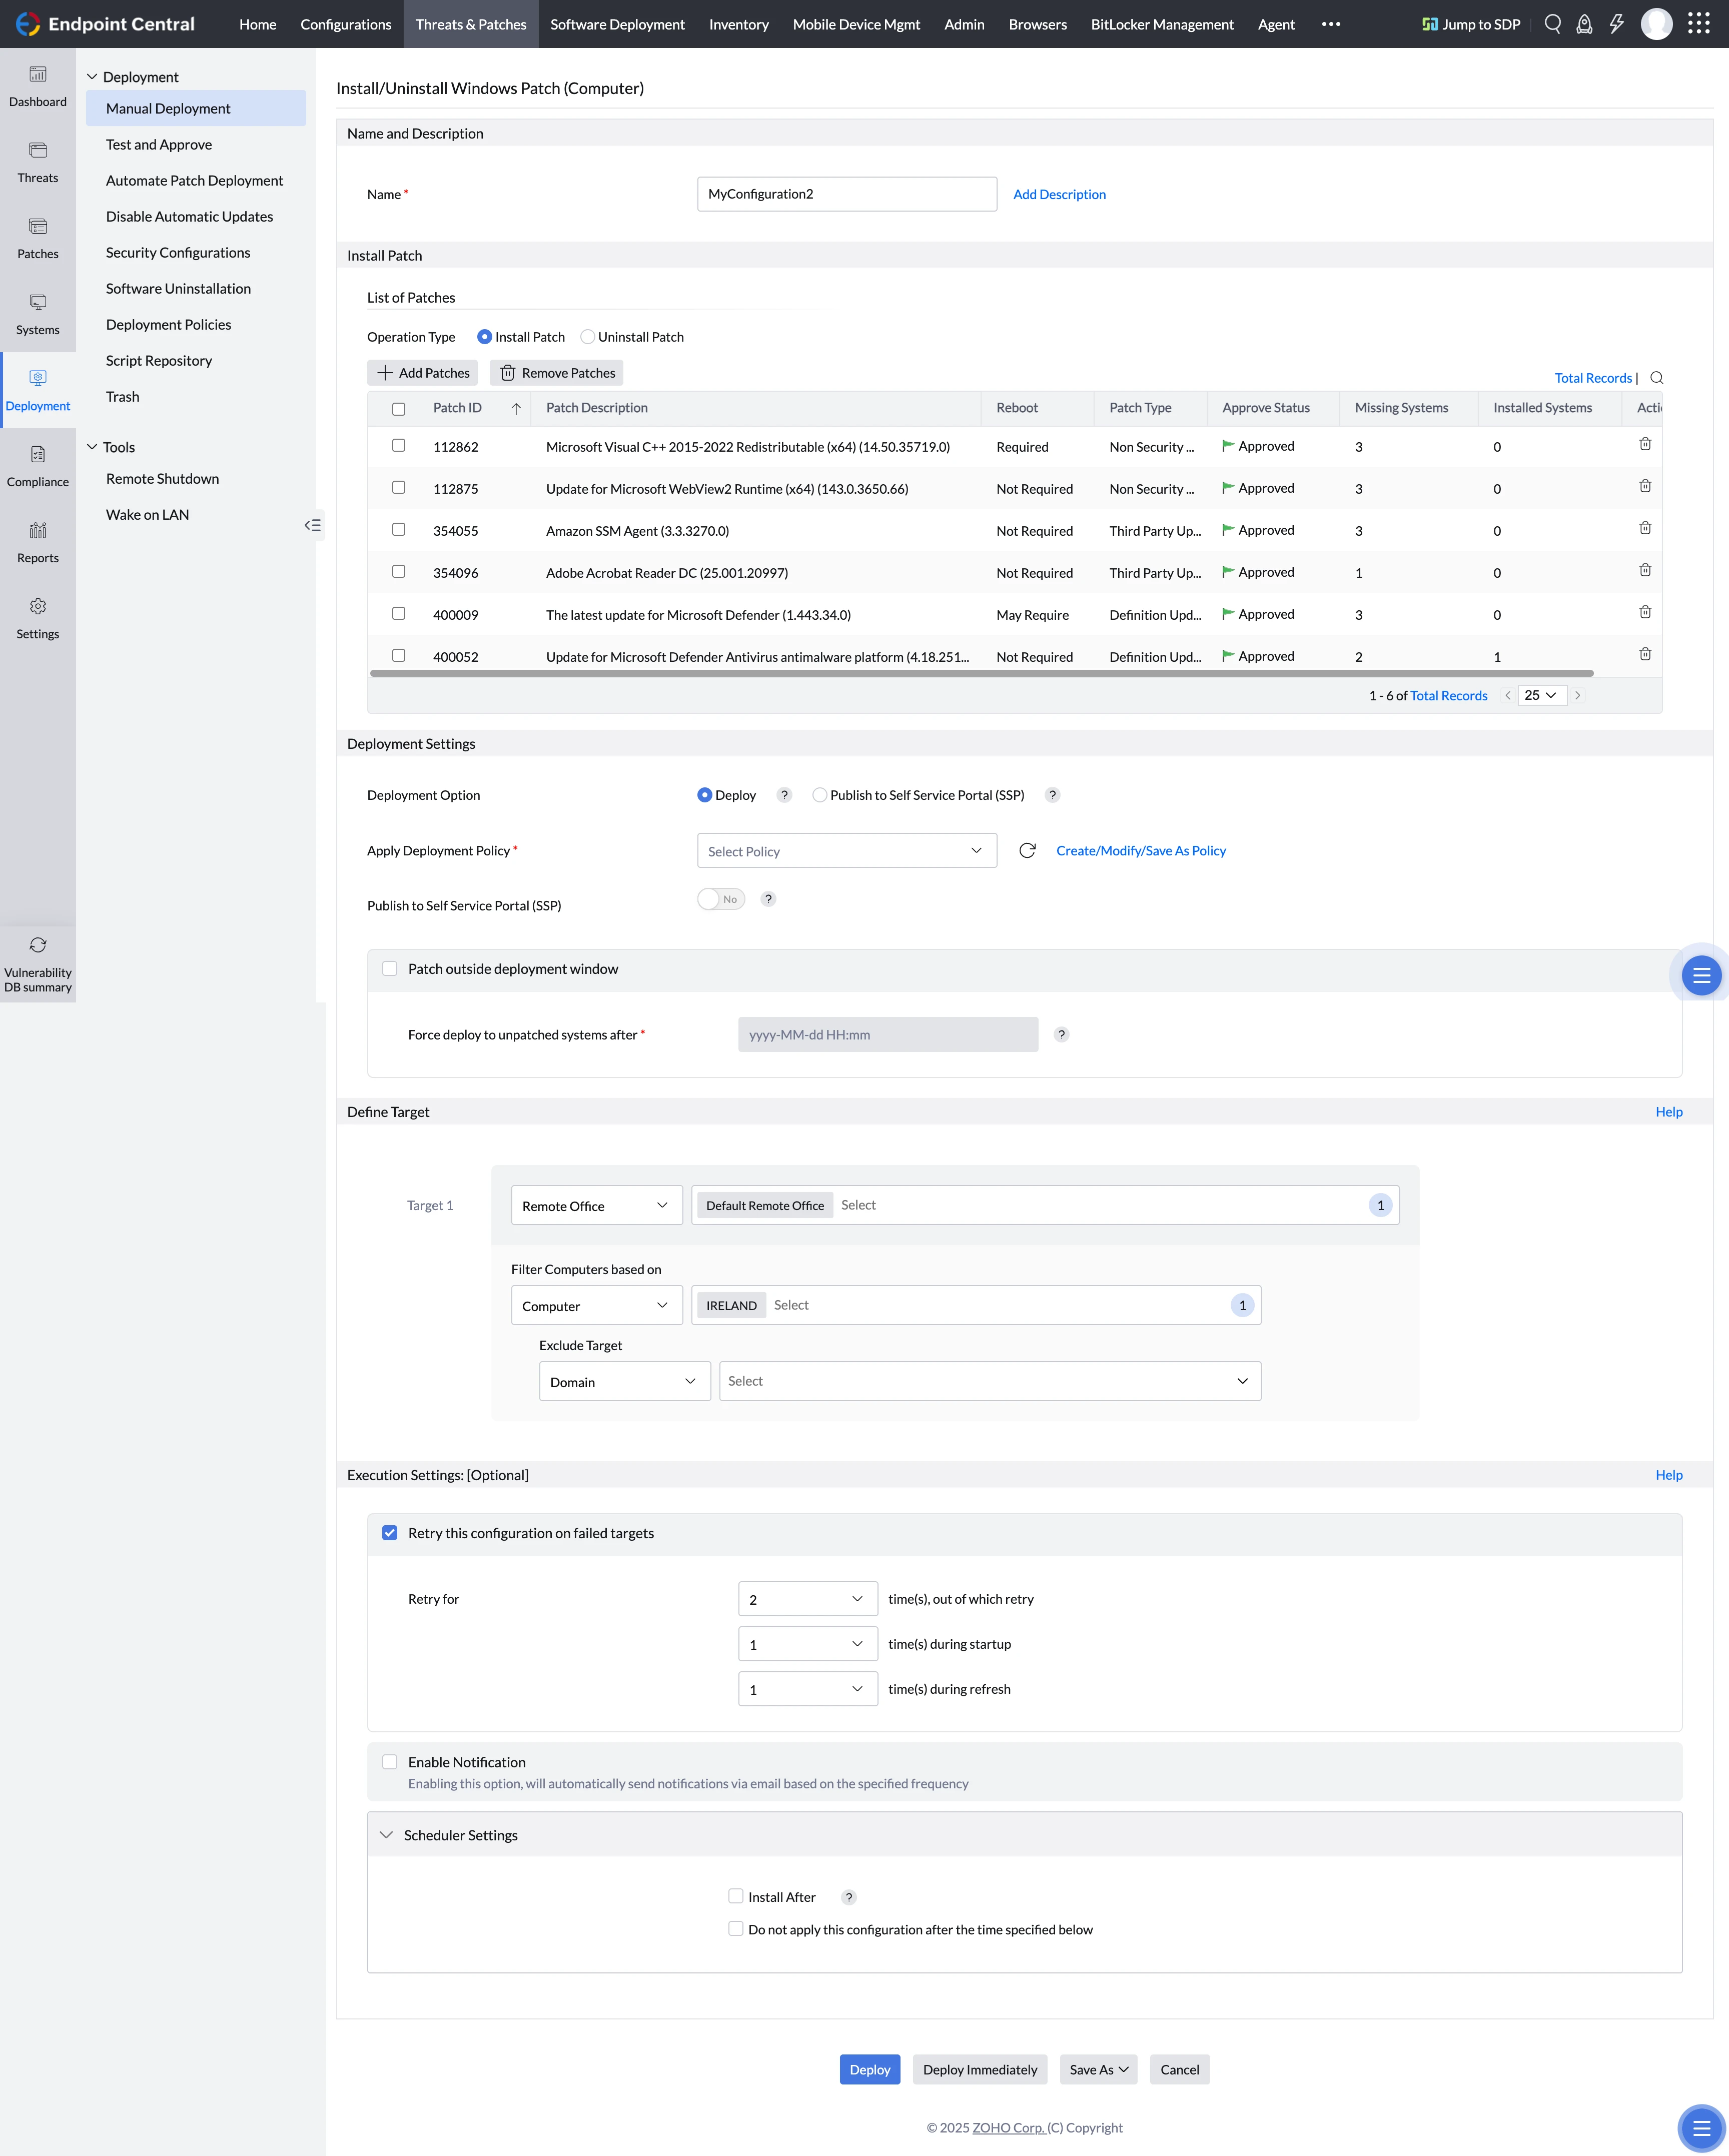
The six missing patches appeared in a table with checkboxes. We selected all six patches and clicked “Install/Publish Patches.”
Instead of immediately installing, ManageEngine opened a configuration screen. The configuration page contained multiple sections.
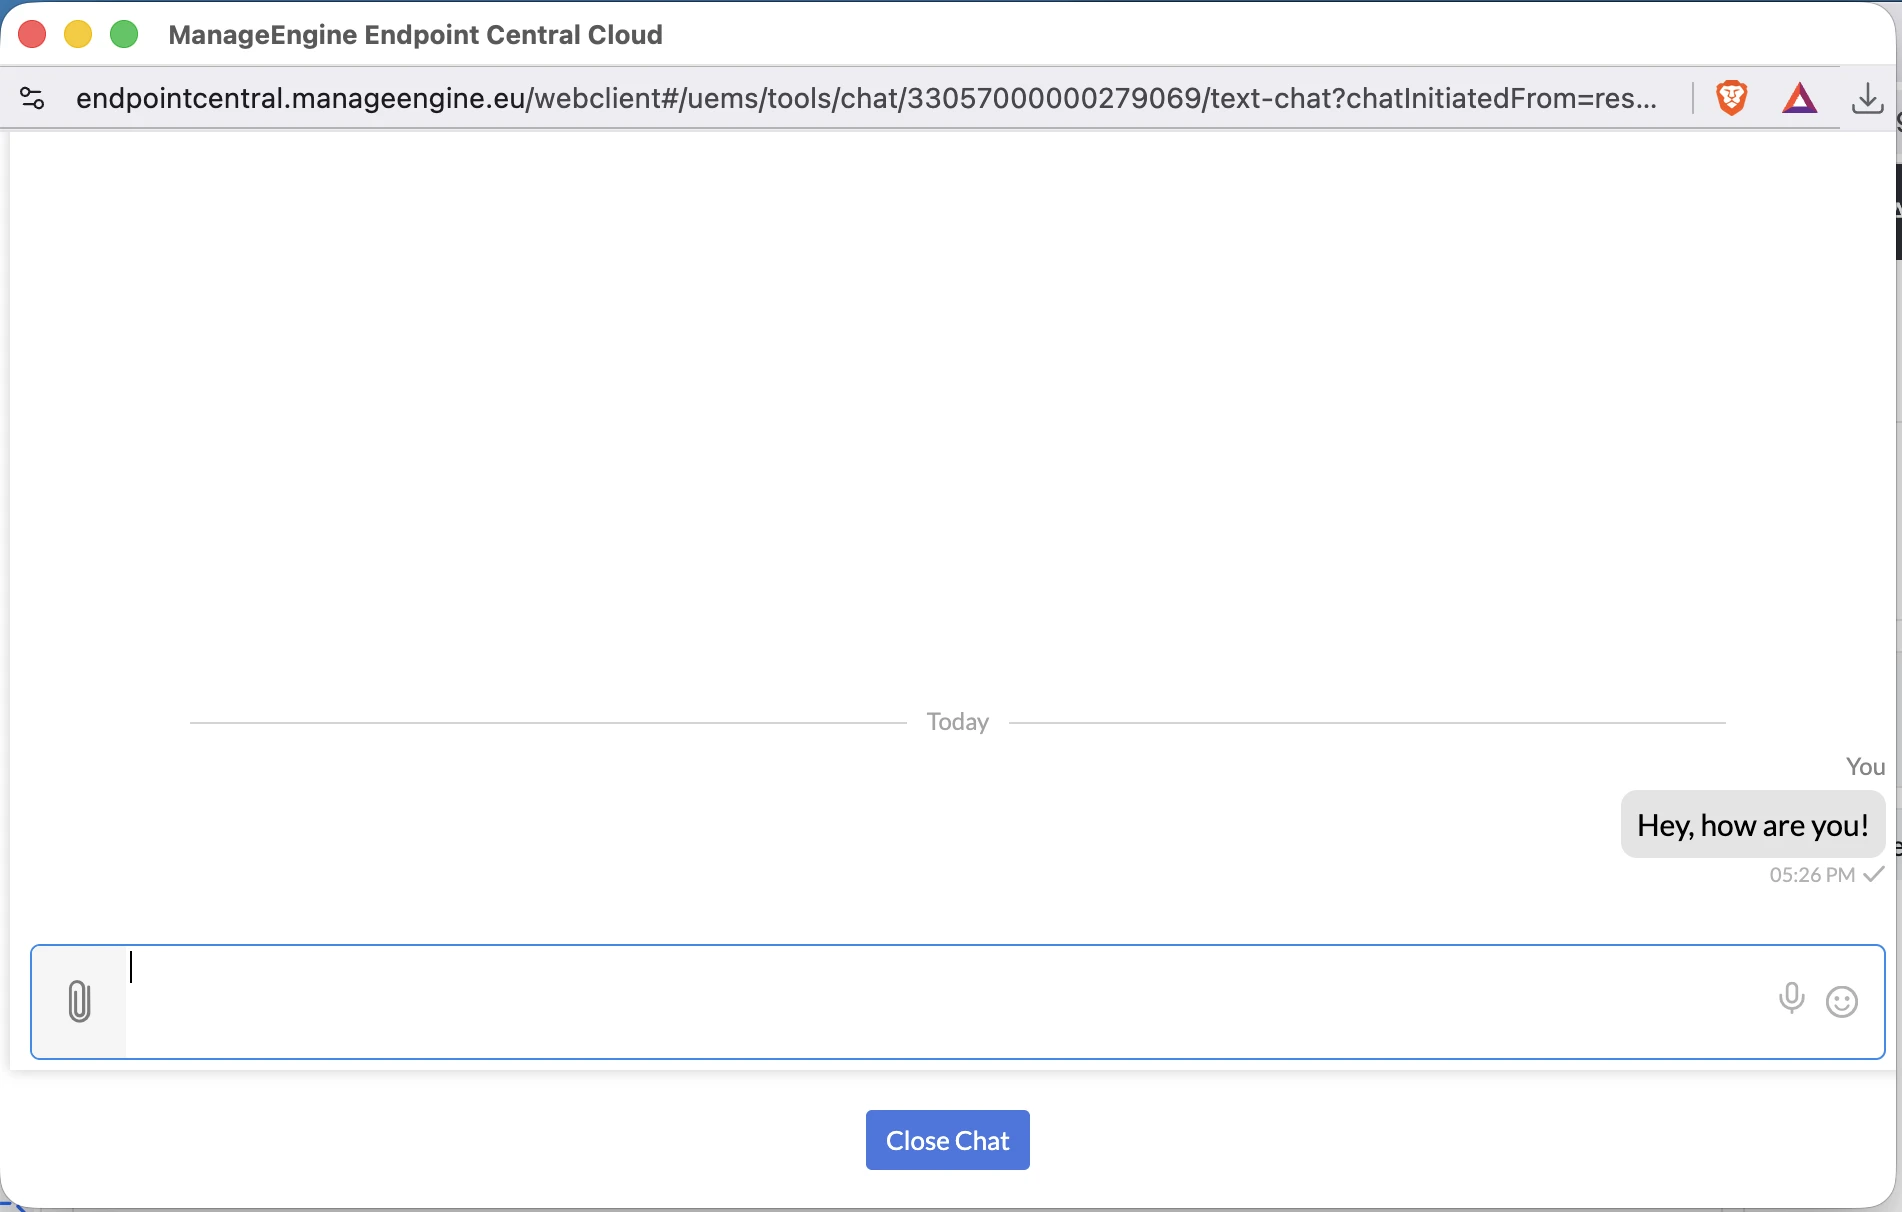
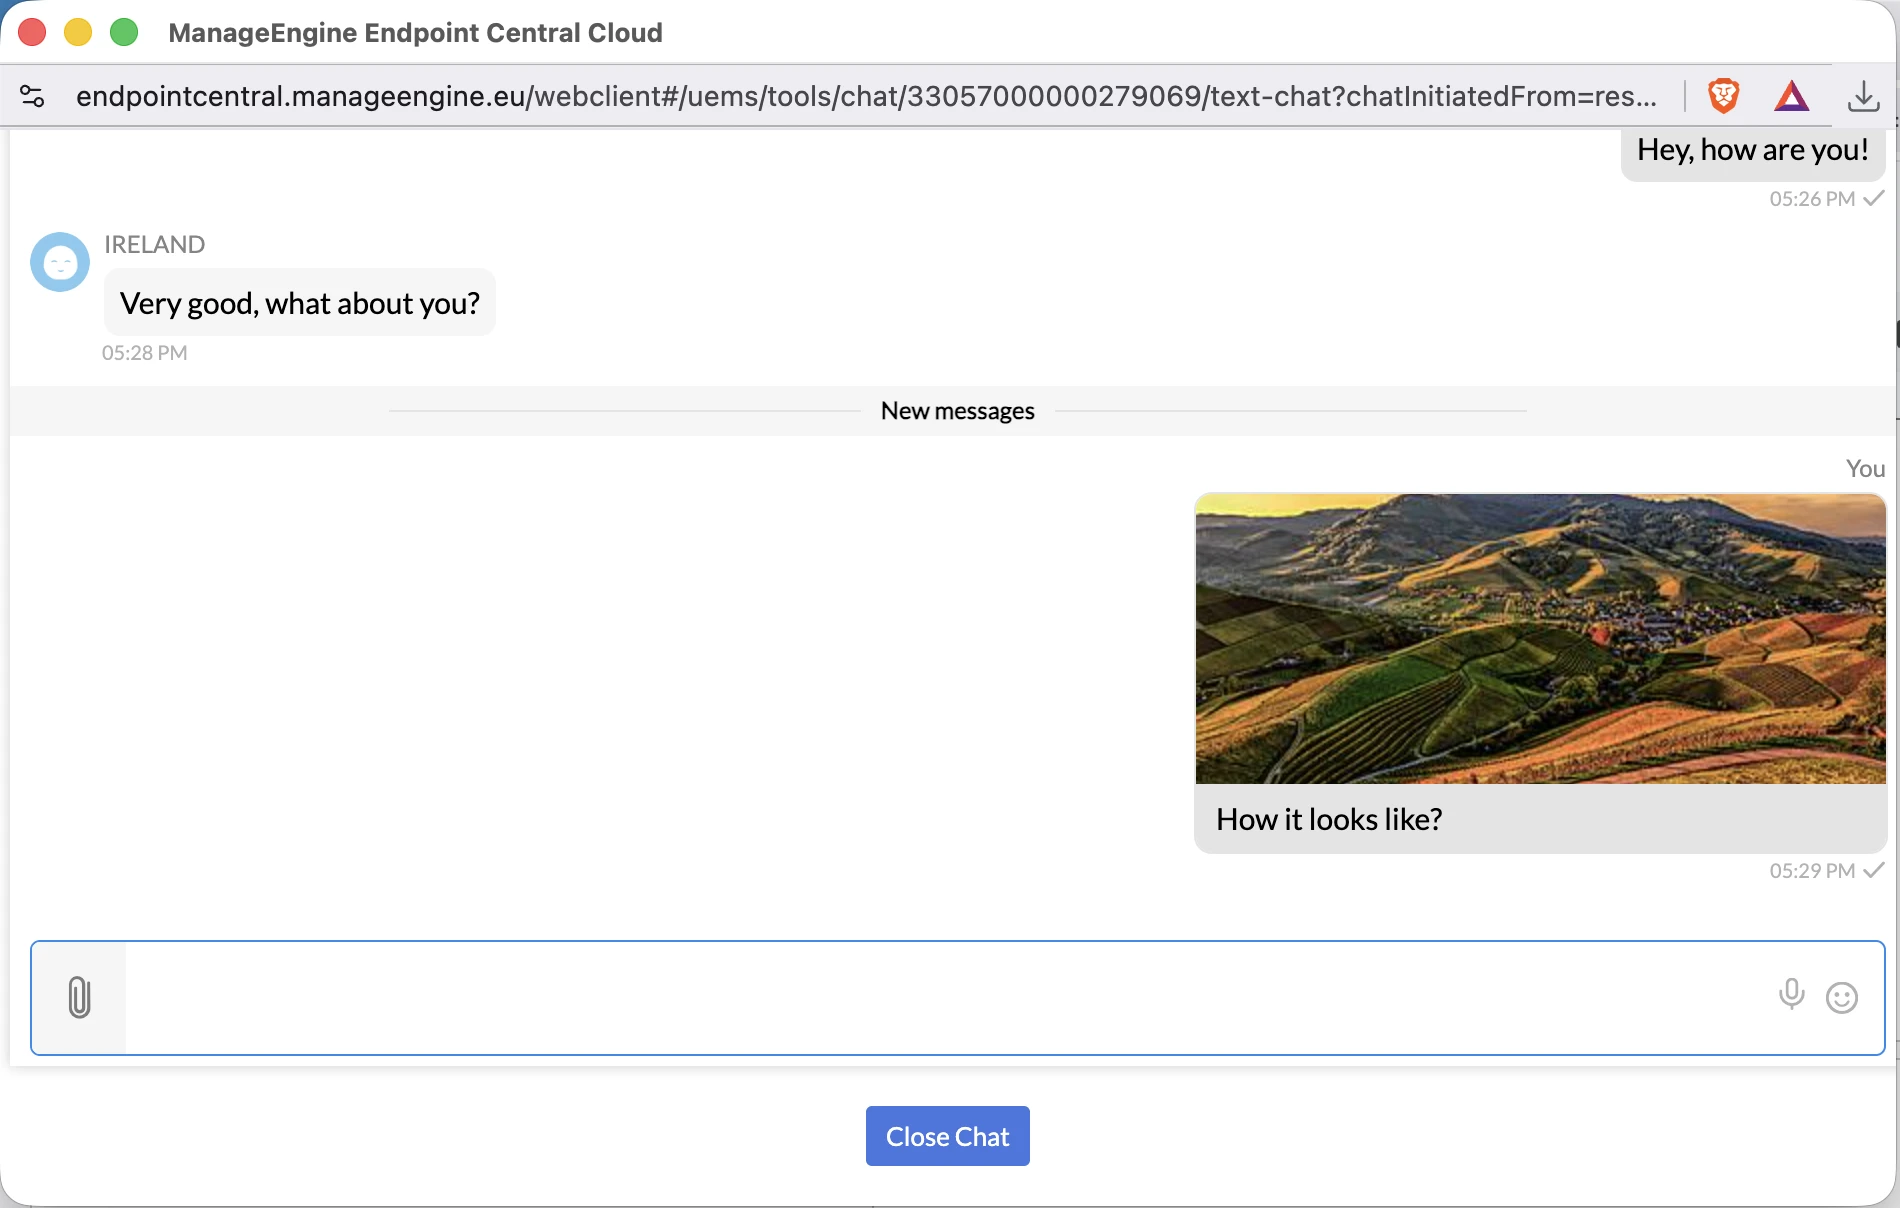
Chat
Clicking the Chat option opened a messaging pop-up window.
We typed a message and it immediately appeared in the chat window. The message went directly to anyone using the IRELAND server. A new browser window popped up on the server showing the incoming message:
This direct messaging capability didn’t exist in NinjaOne chat; NinjaOne only worked inside active remote control sessions. Acronis offered a standalone chat but without file attachments.
ManageEngine’s implementation included support for file attachments. We tested sending an image:
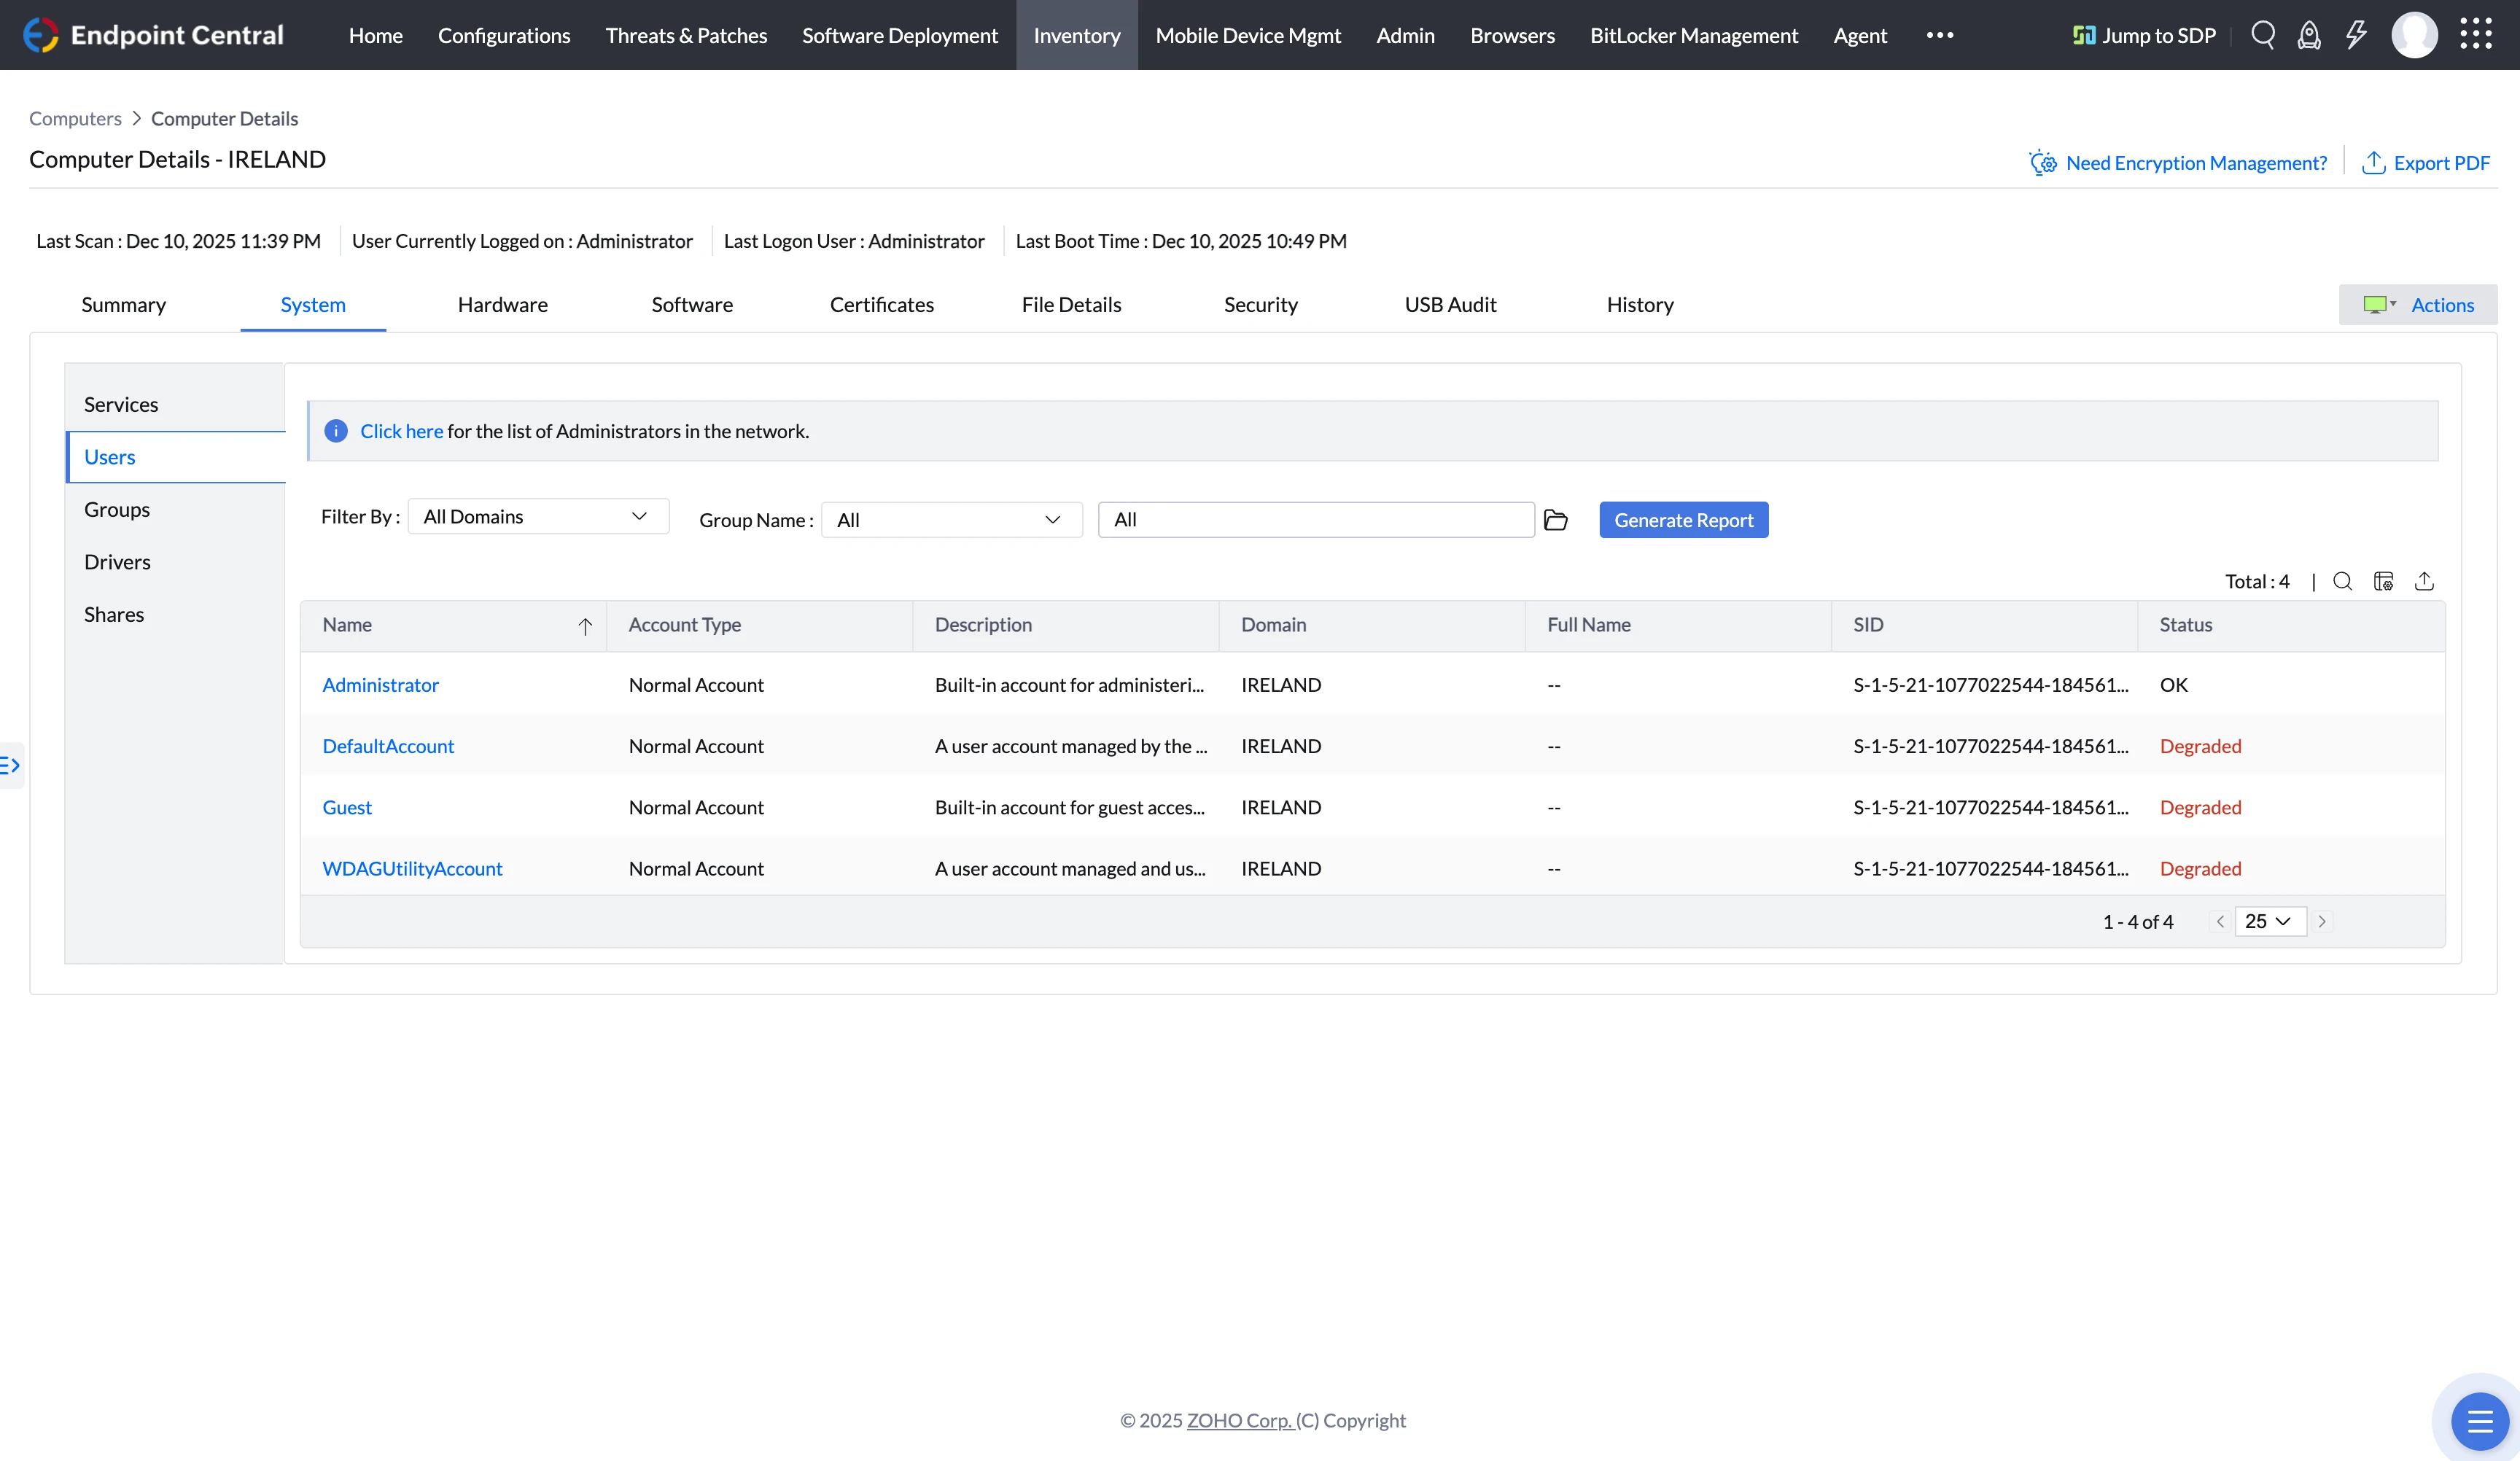
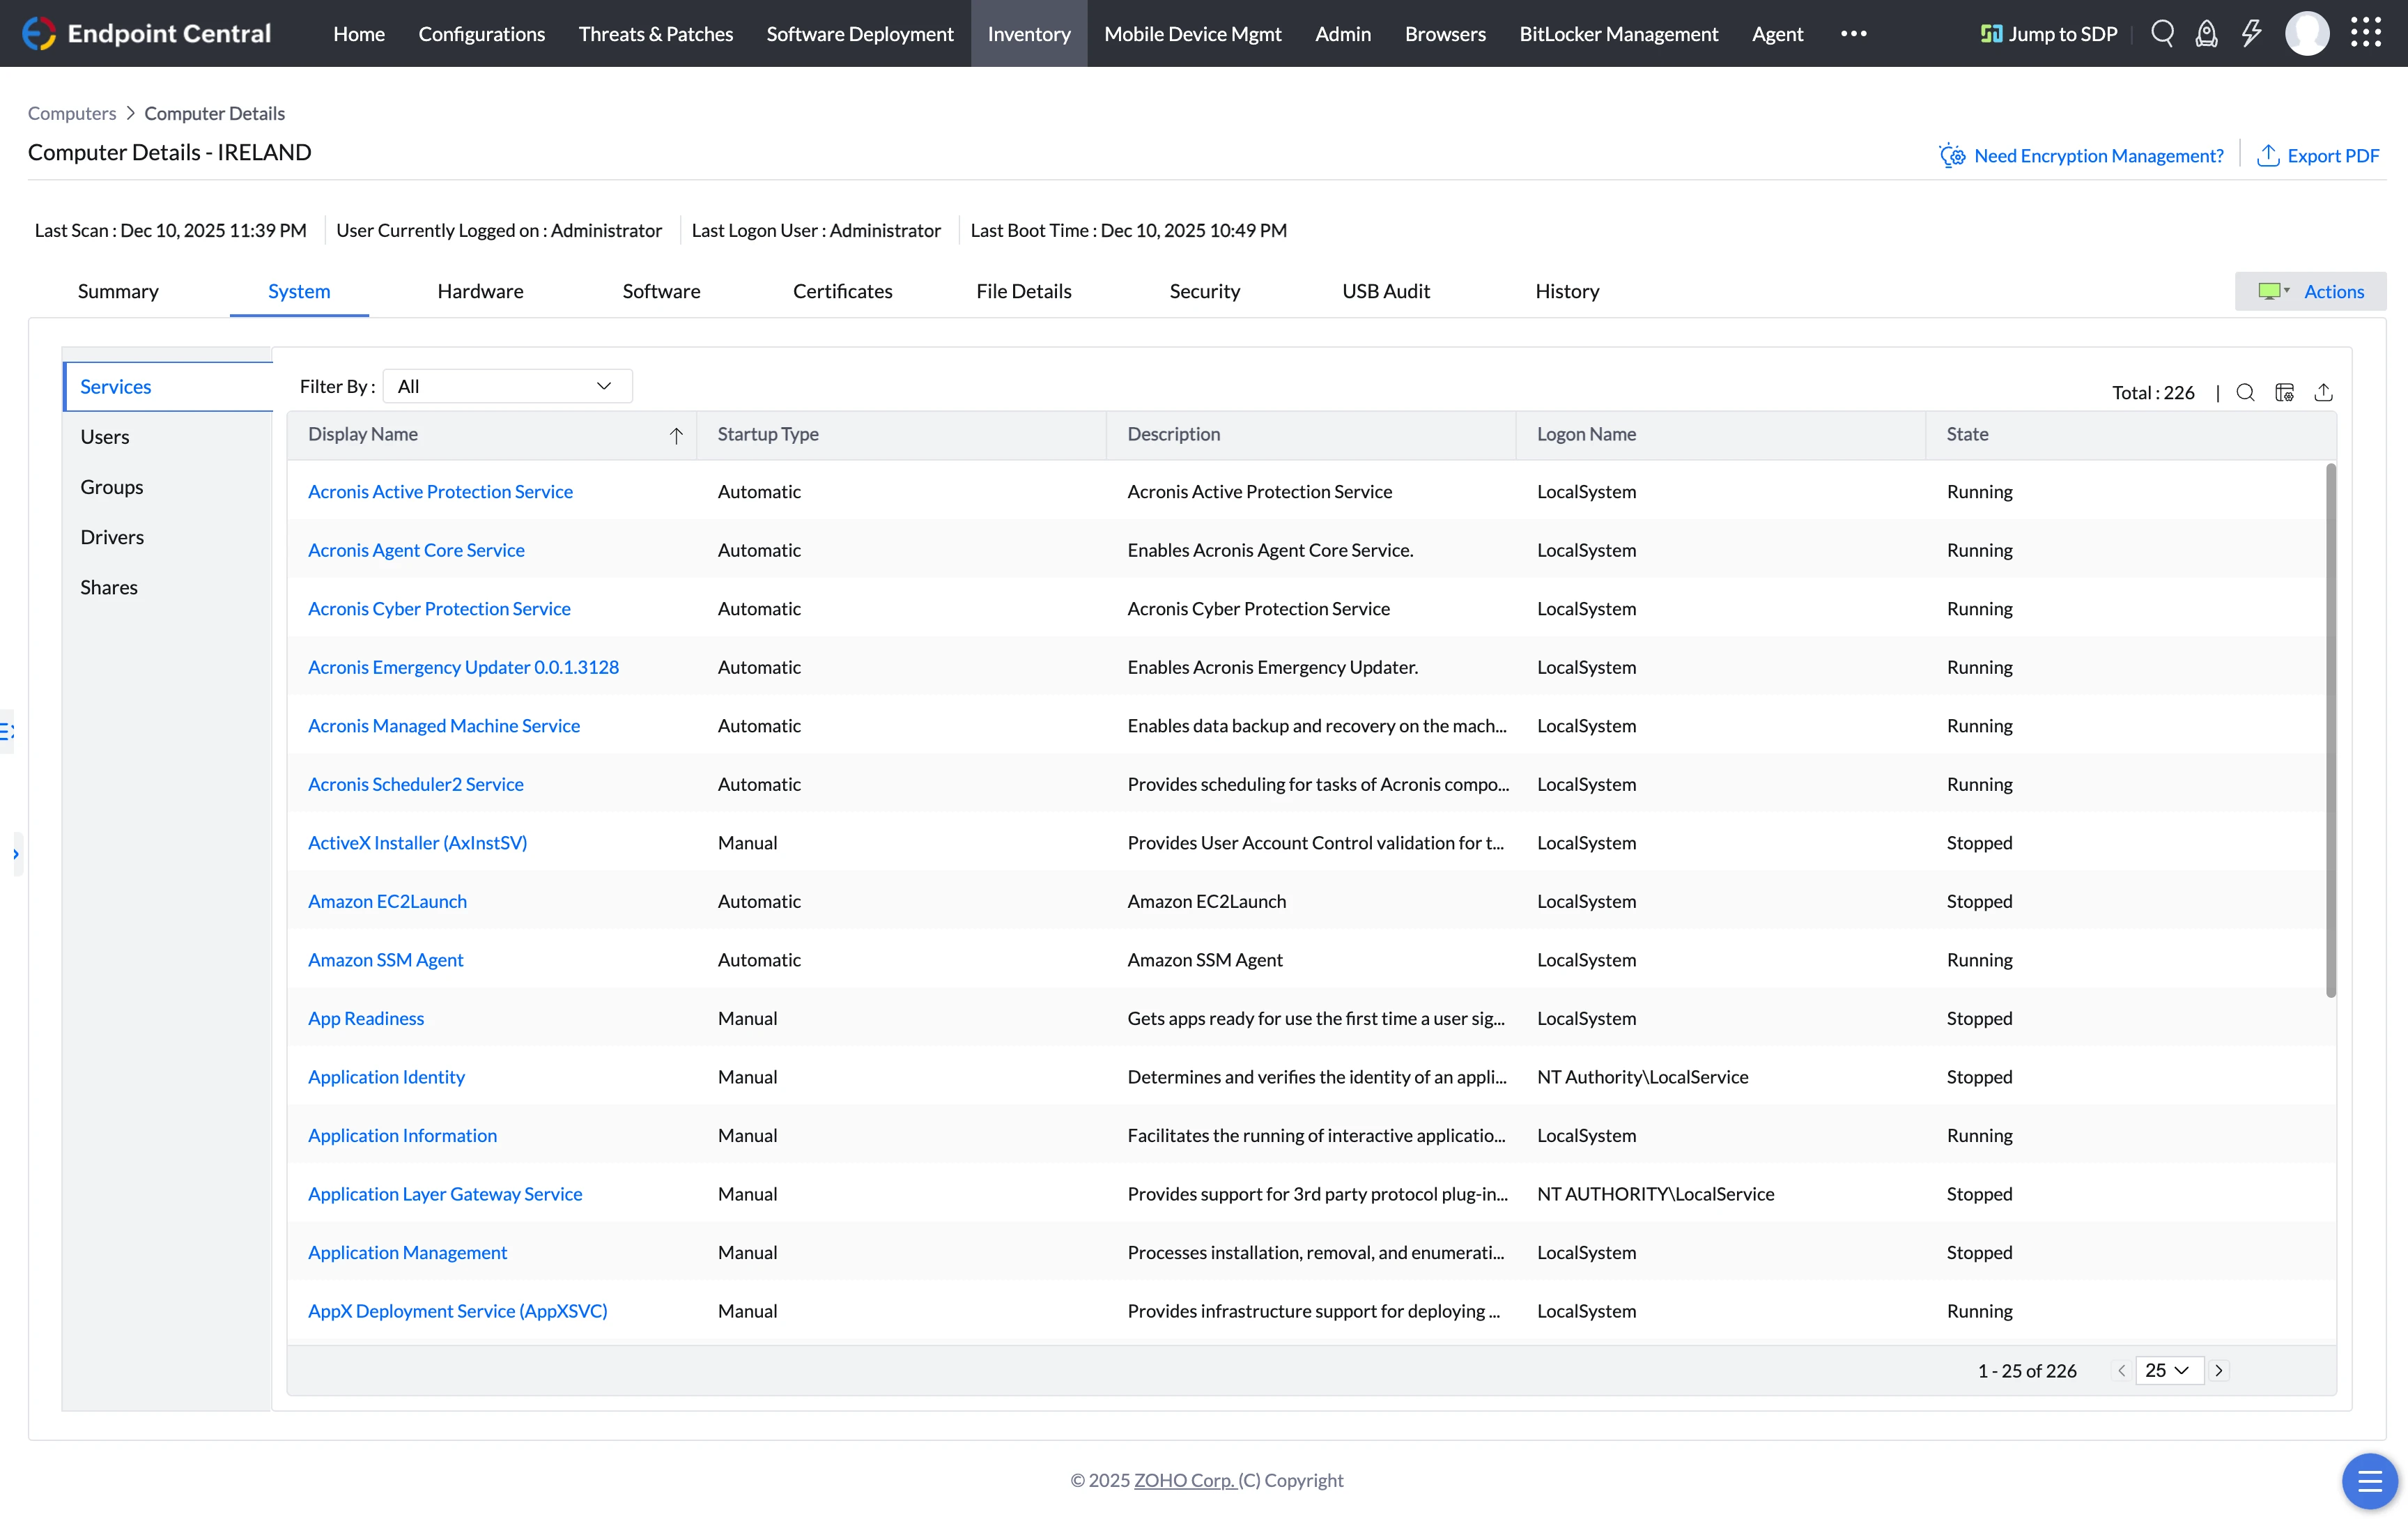
System Tab
The System tab contained four subsections in the left sidebar: Services, Users, Groups, Drivers, and Shares.
We clicked Users to view all user accounts on the server.
The Users section displayed:
- Filter options: All Domains, Group Name, custom search
- Generate Report button
- User table with columns: Name, Account Type, Description, Domain, Full Name, SID, Status
Four accounts appeared:
- Administrator (Normal Account, OK status)
- DefaultAccount (Degraded status)
- Guest (Degraded status)
- WDAGUtilityAccount (Degraded status)
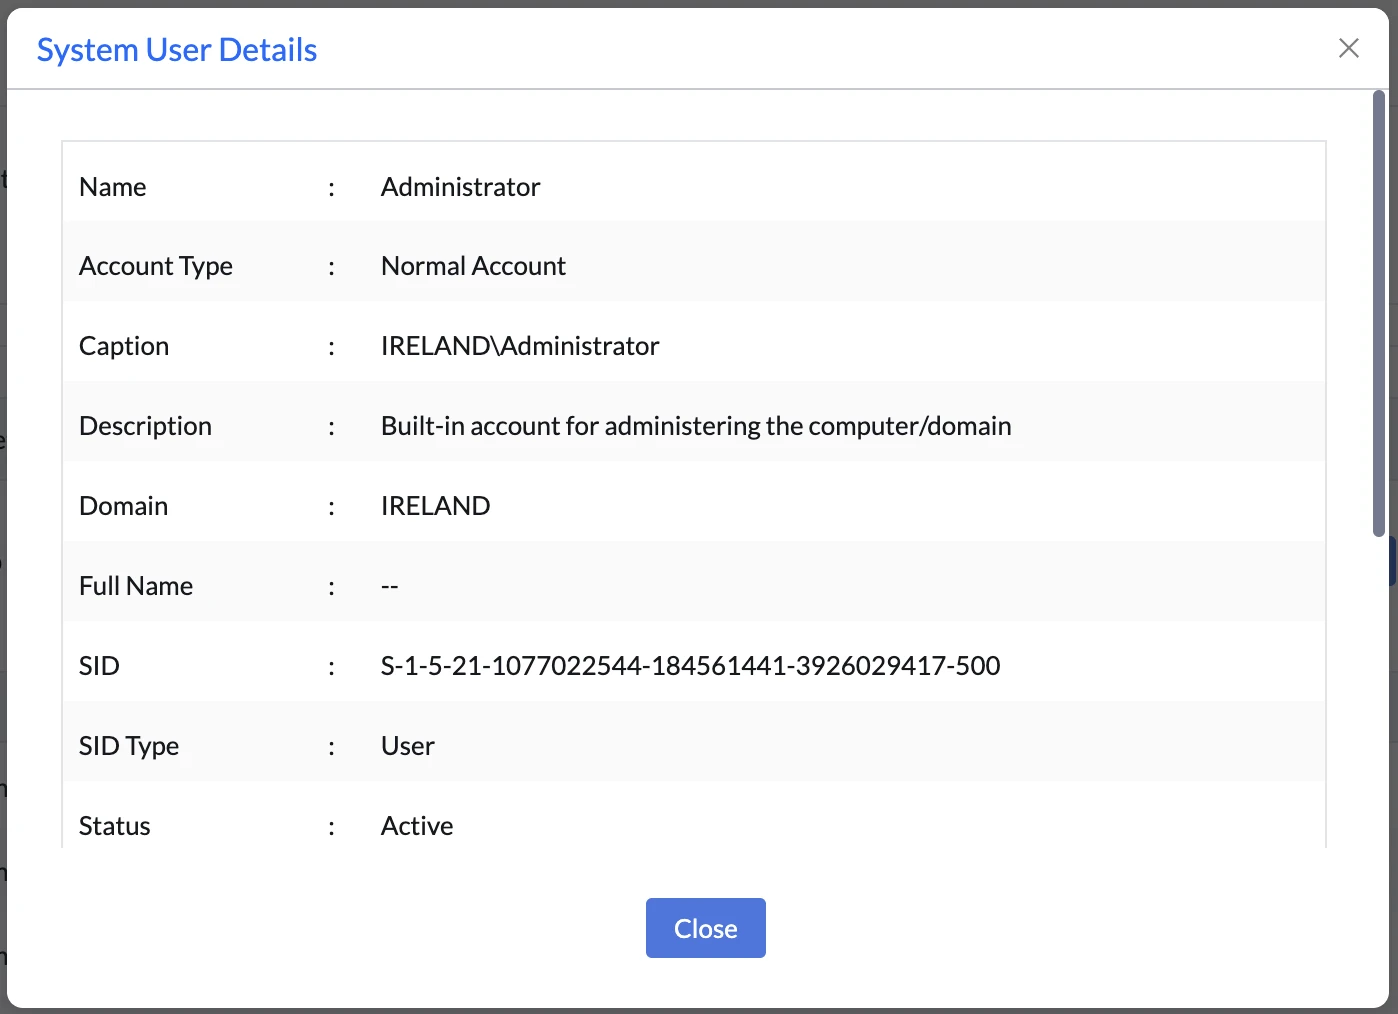
Clicking the Administrator account opened detailed user information:
The user details dialog showed:
We searched the interface for service management options: start, stop, restart, or change startup type. None appeared. The Services view provided read-only information. NinjaOne offered full-service management through its Service Manager tool.
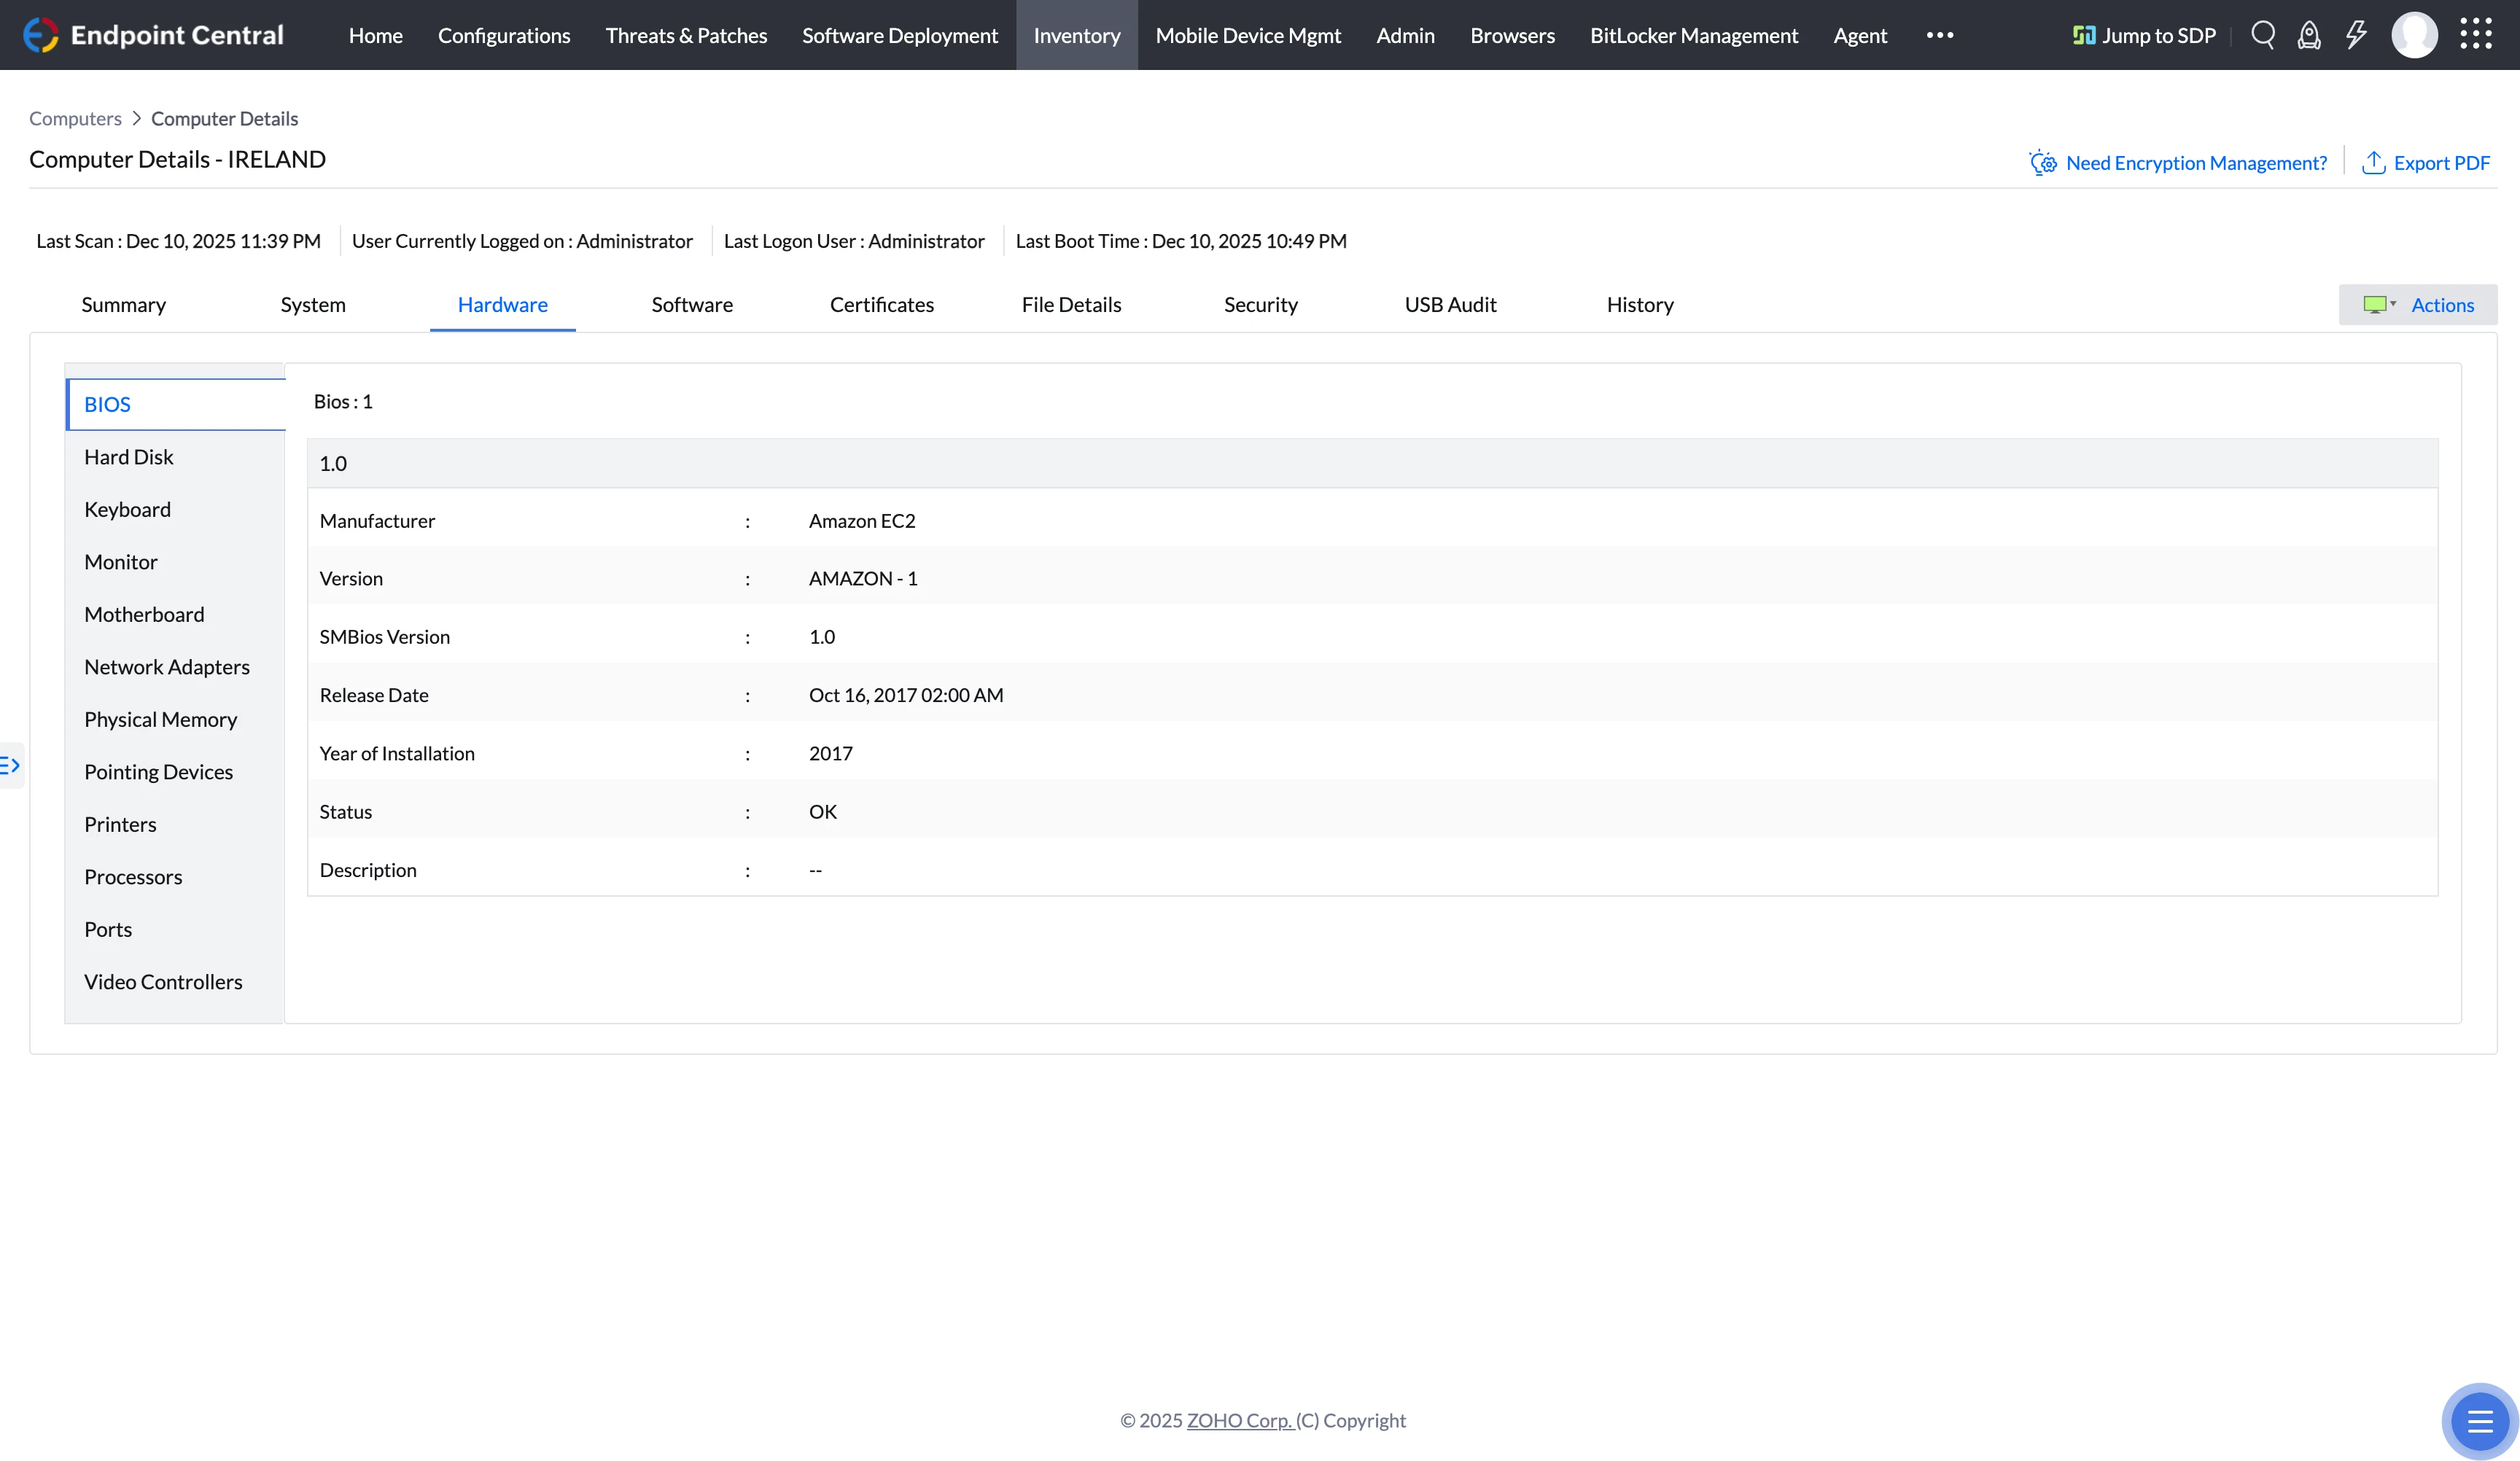
Hardware Tab
The Hardware tab displayed comprehensive hardware specifications organized by component category.
Each hardware category provided similar detailed specifications.
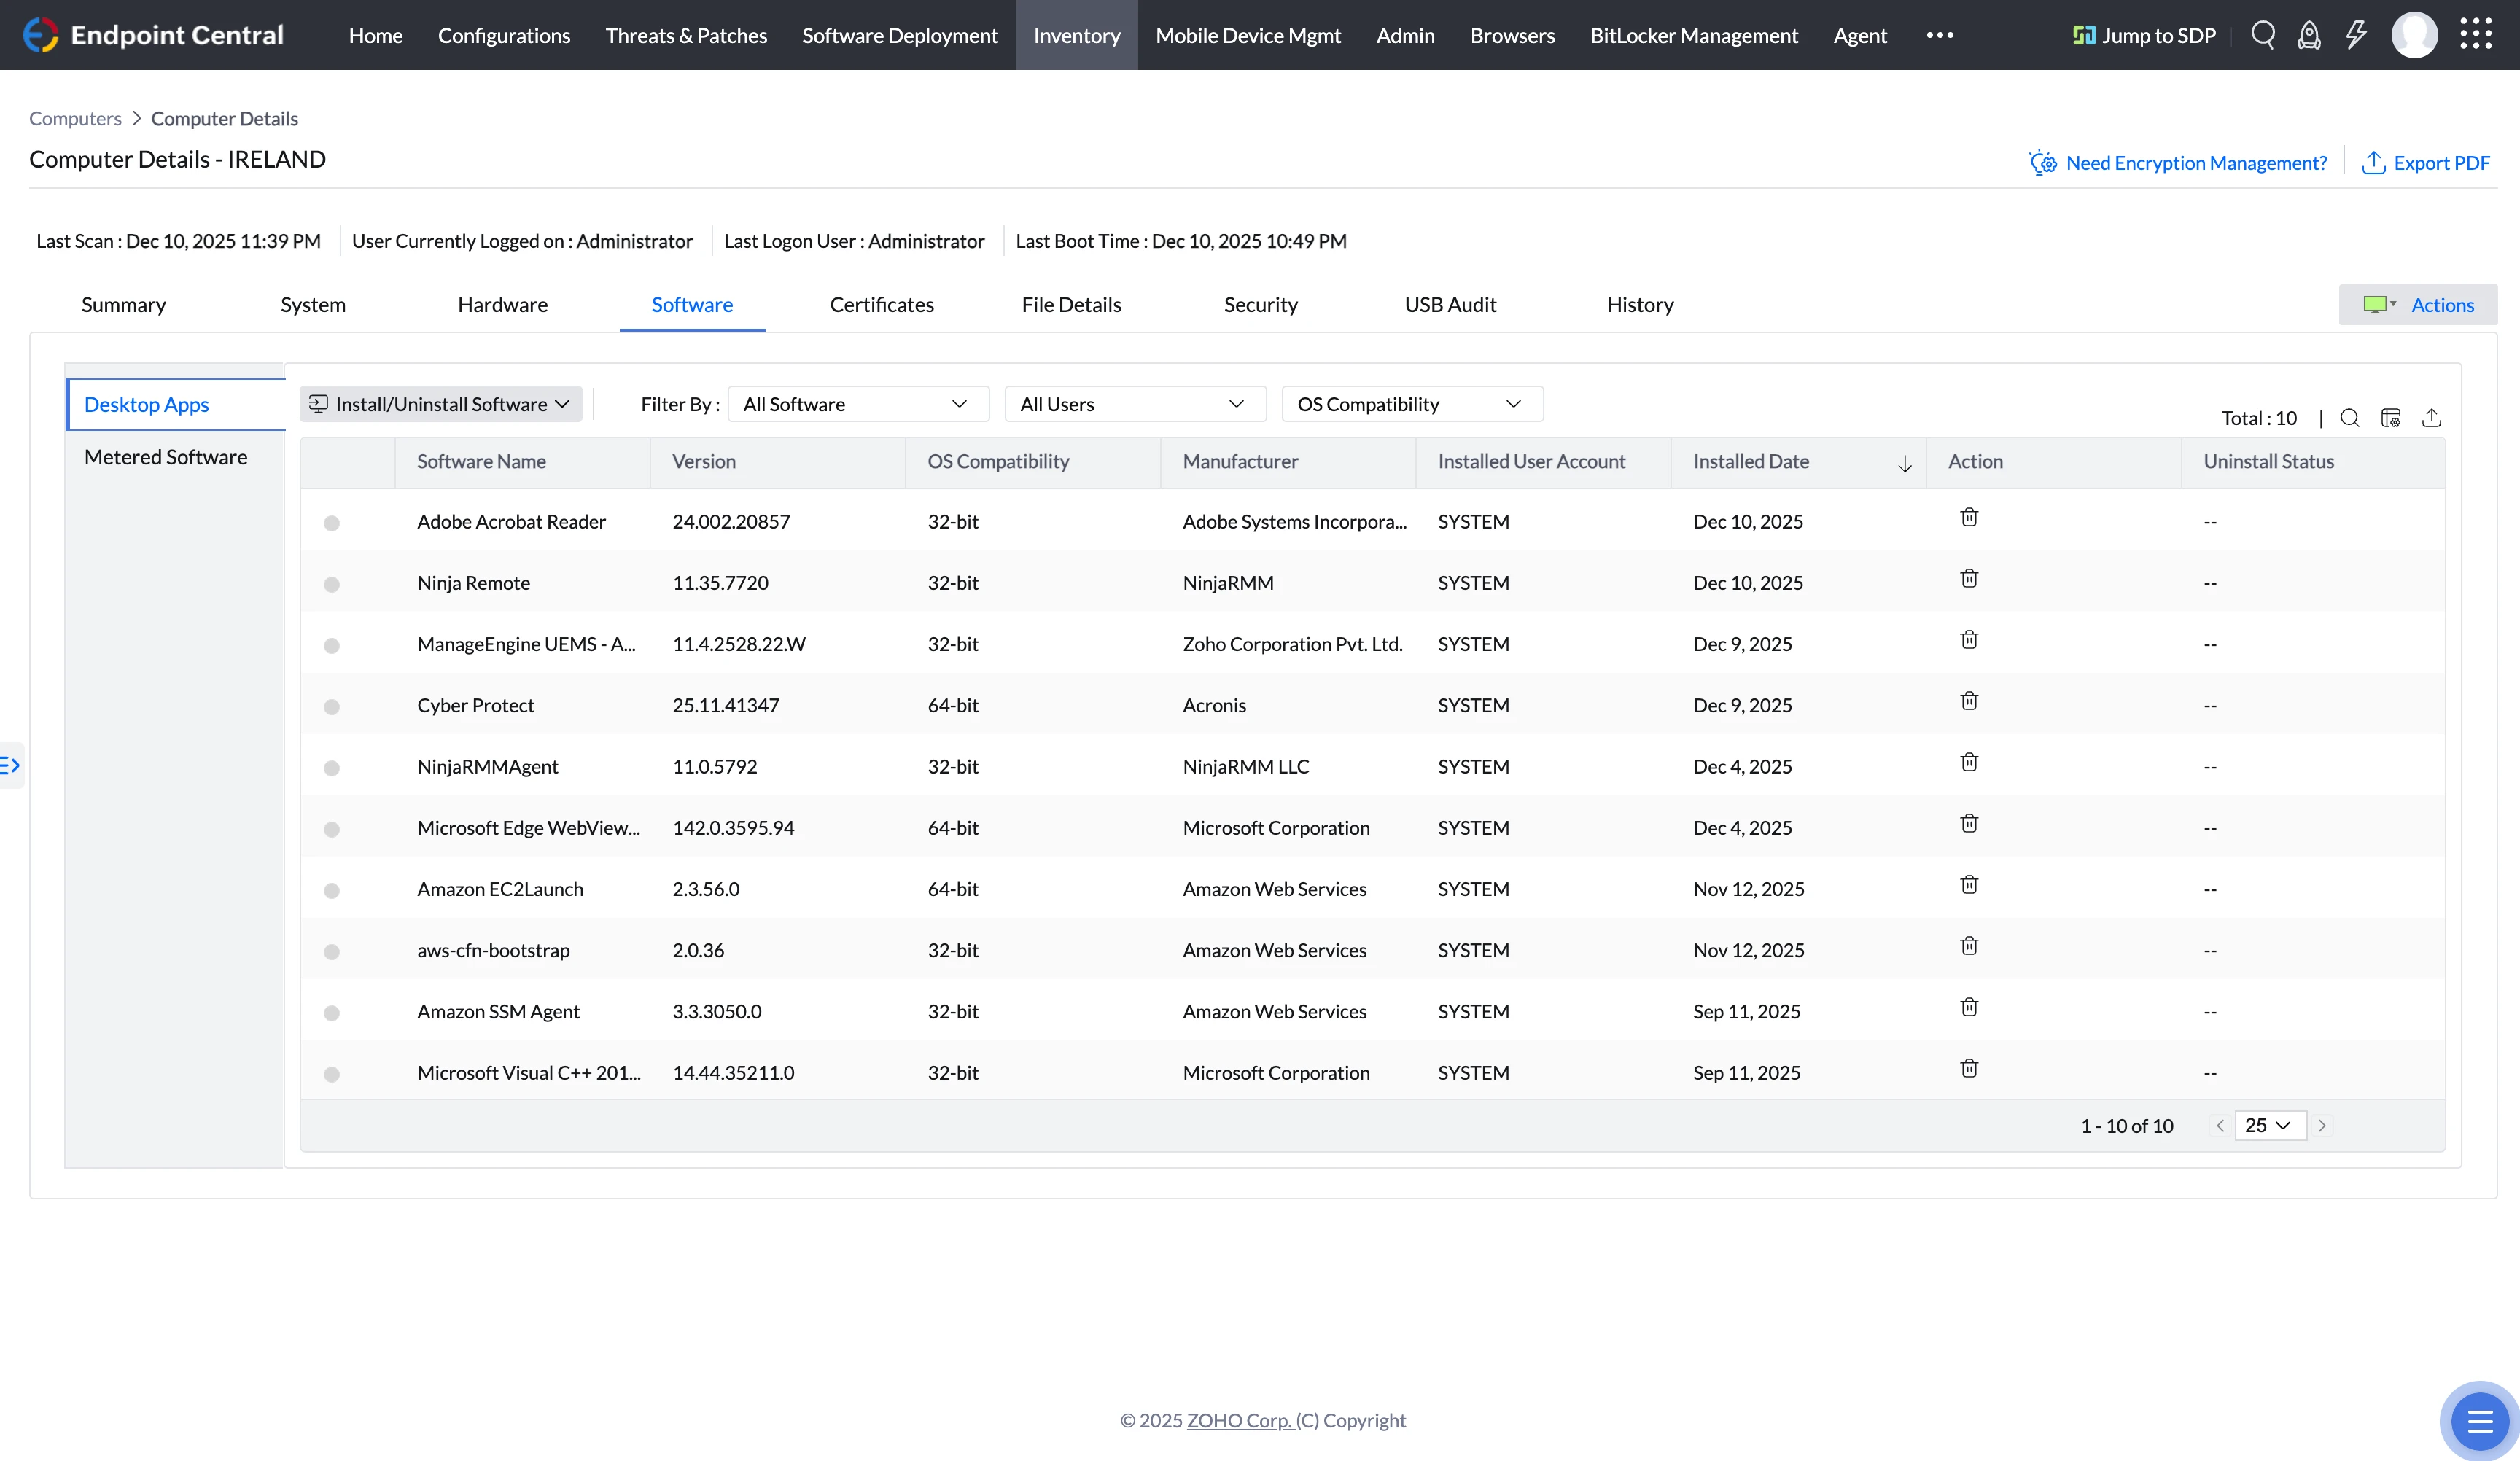
Software Tab
The Software tab showed installed applications with two subsections: Desktop Apps and Metered Software.
The Desktop Apps view included filters:
- Install/Uninstall Software dropdown
- Filter By: All Software, All Users, OS Compatibility
Security Tab
The Security tab contained four subsections: BitLocker, Antivirus, Firewall, and Missing Patches.
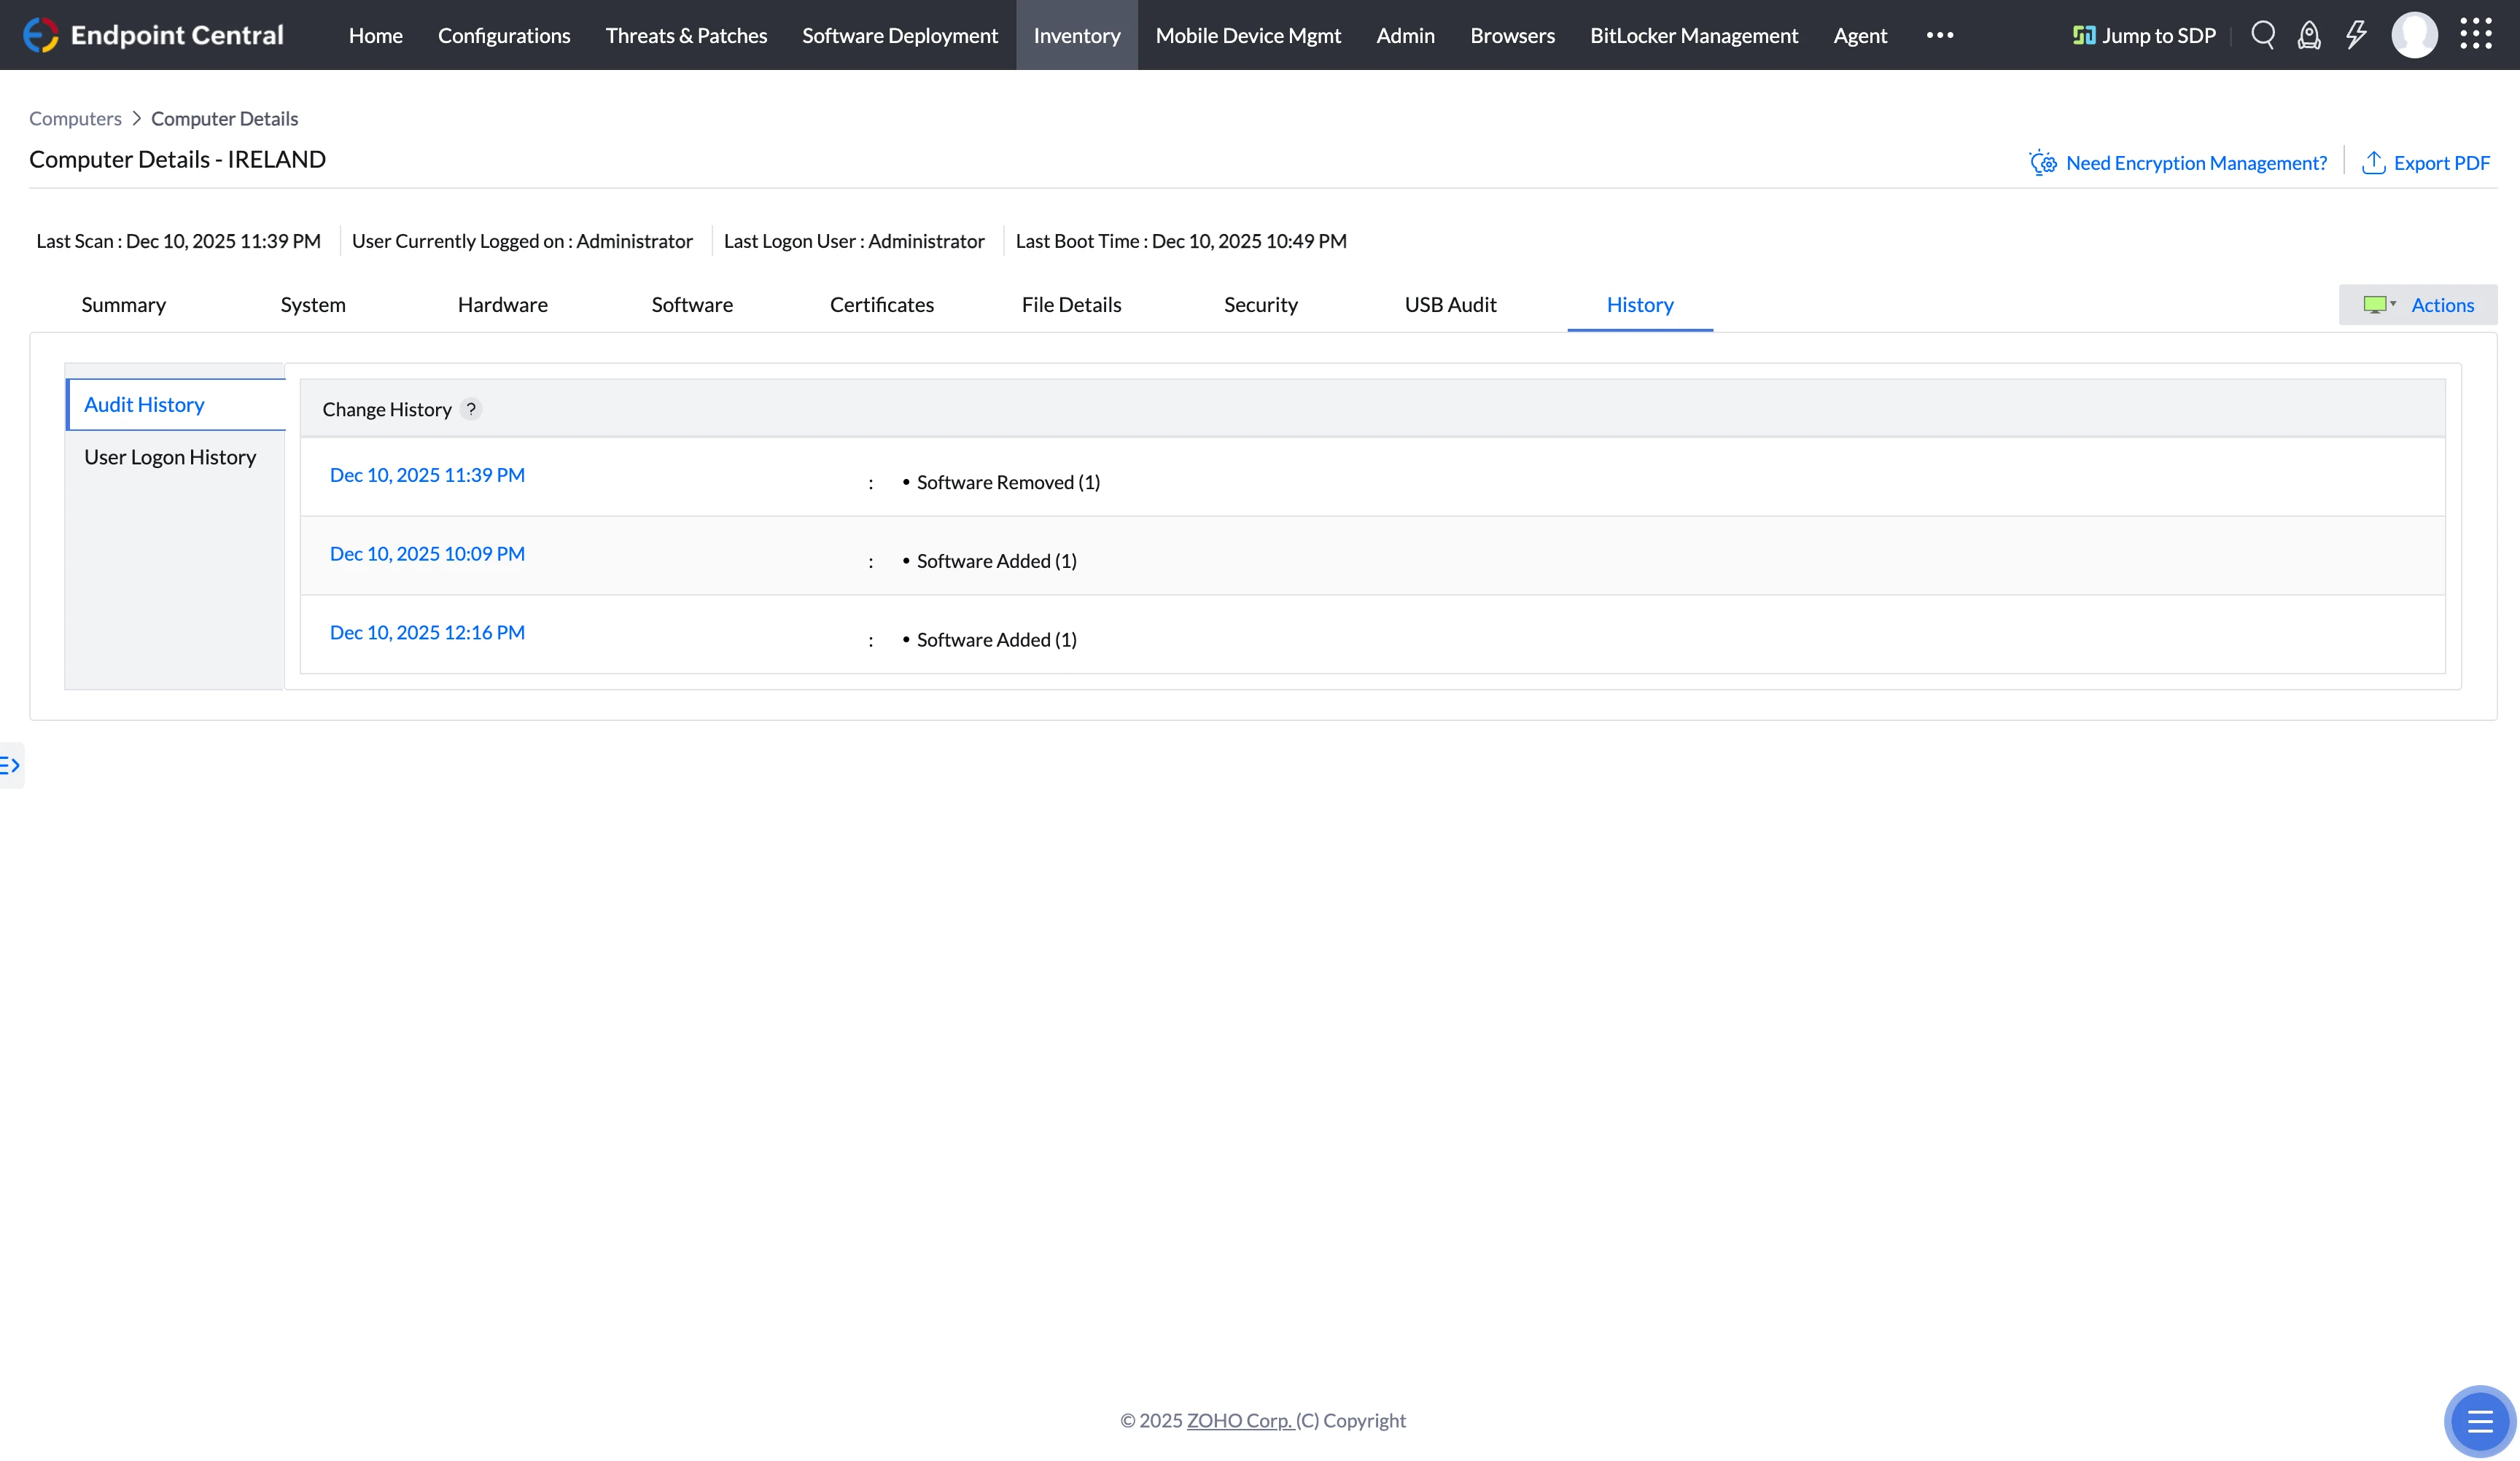
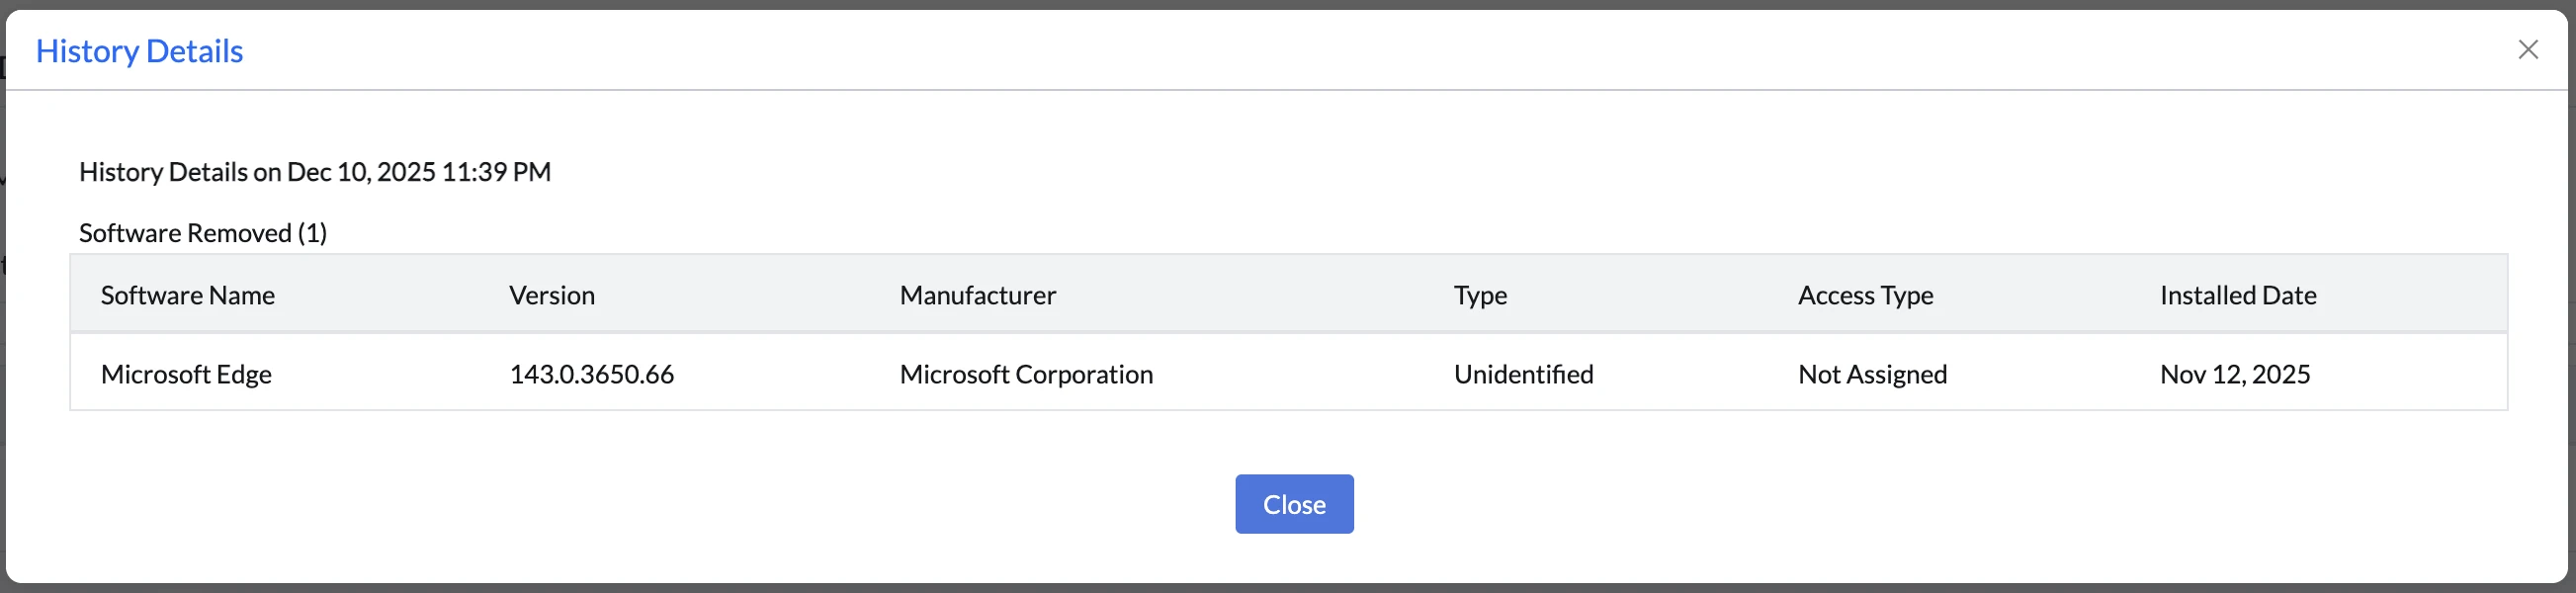
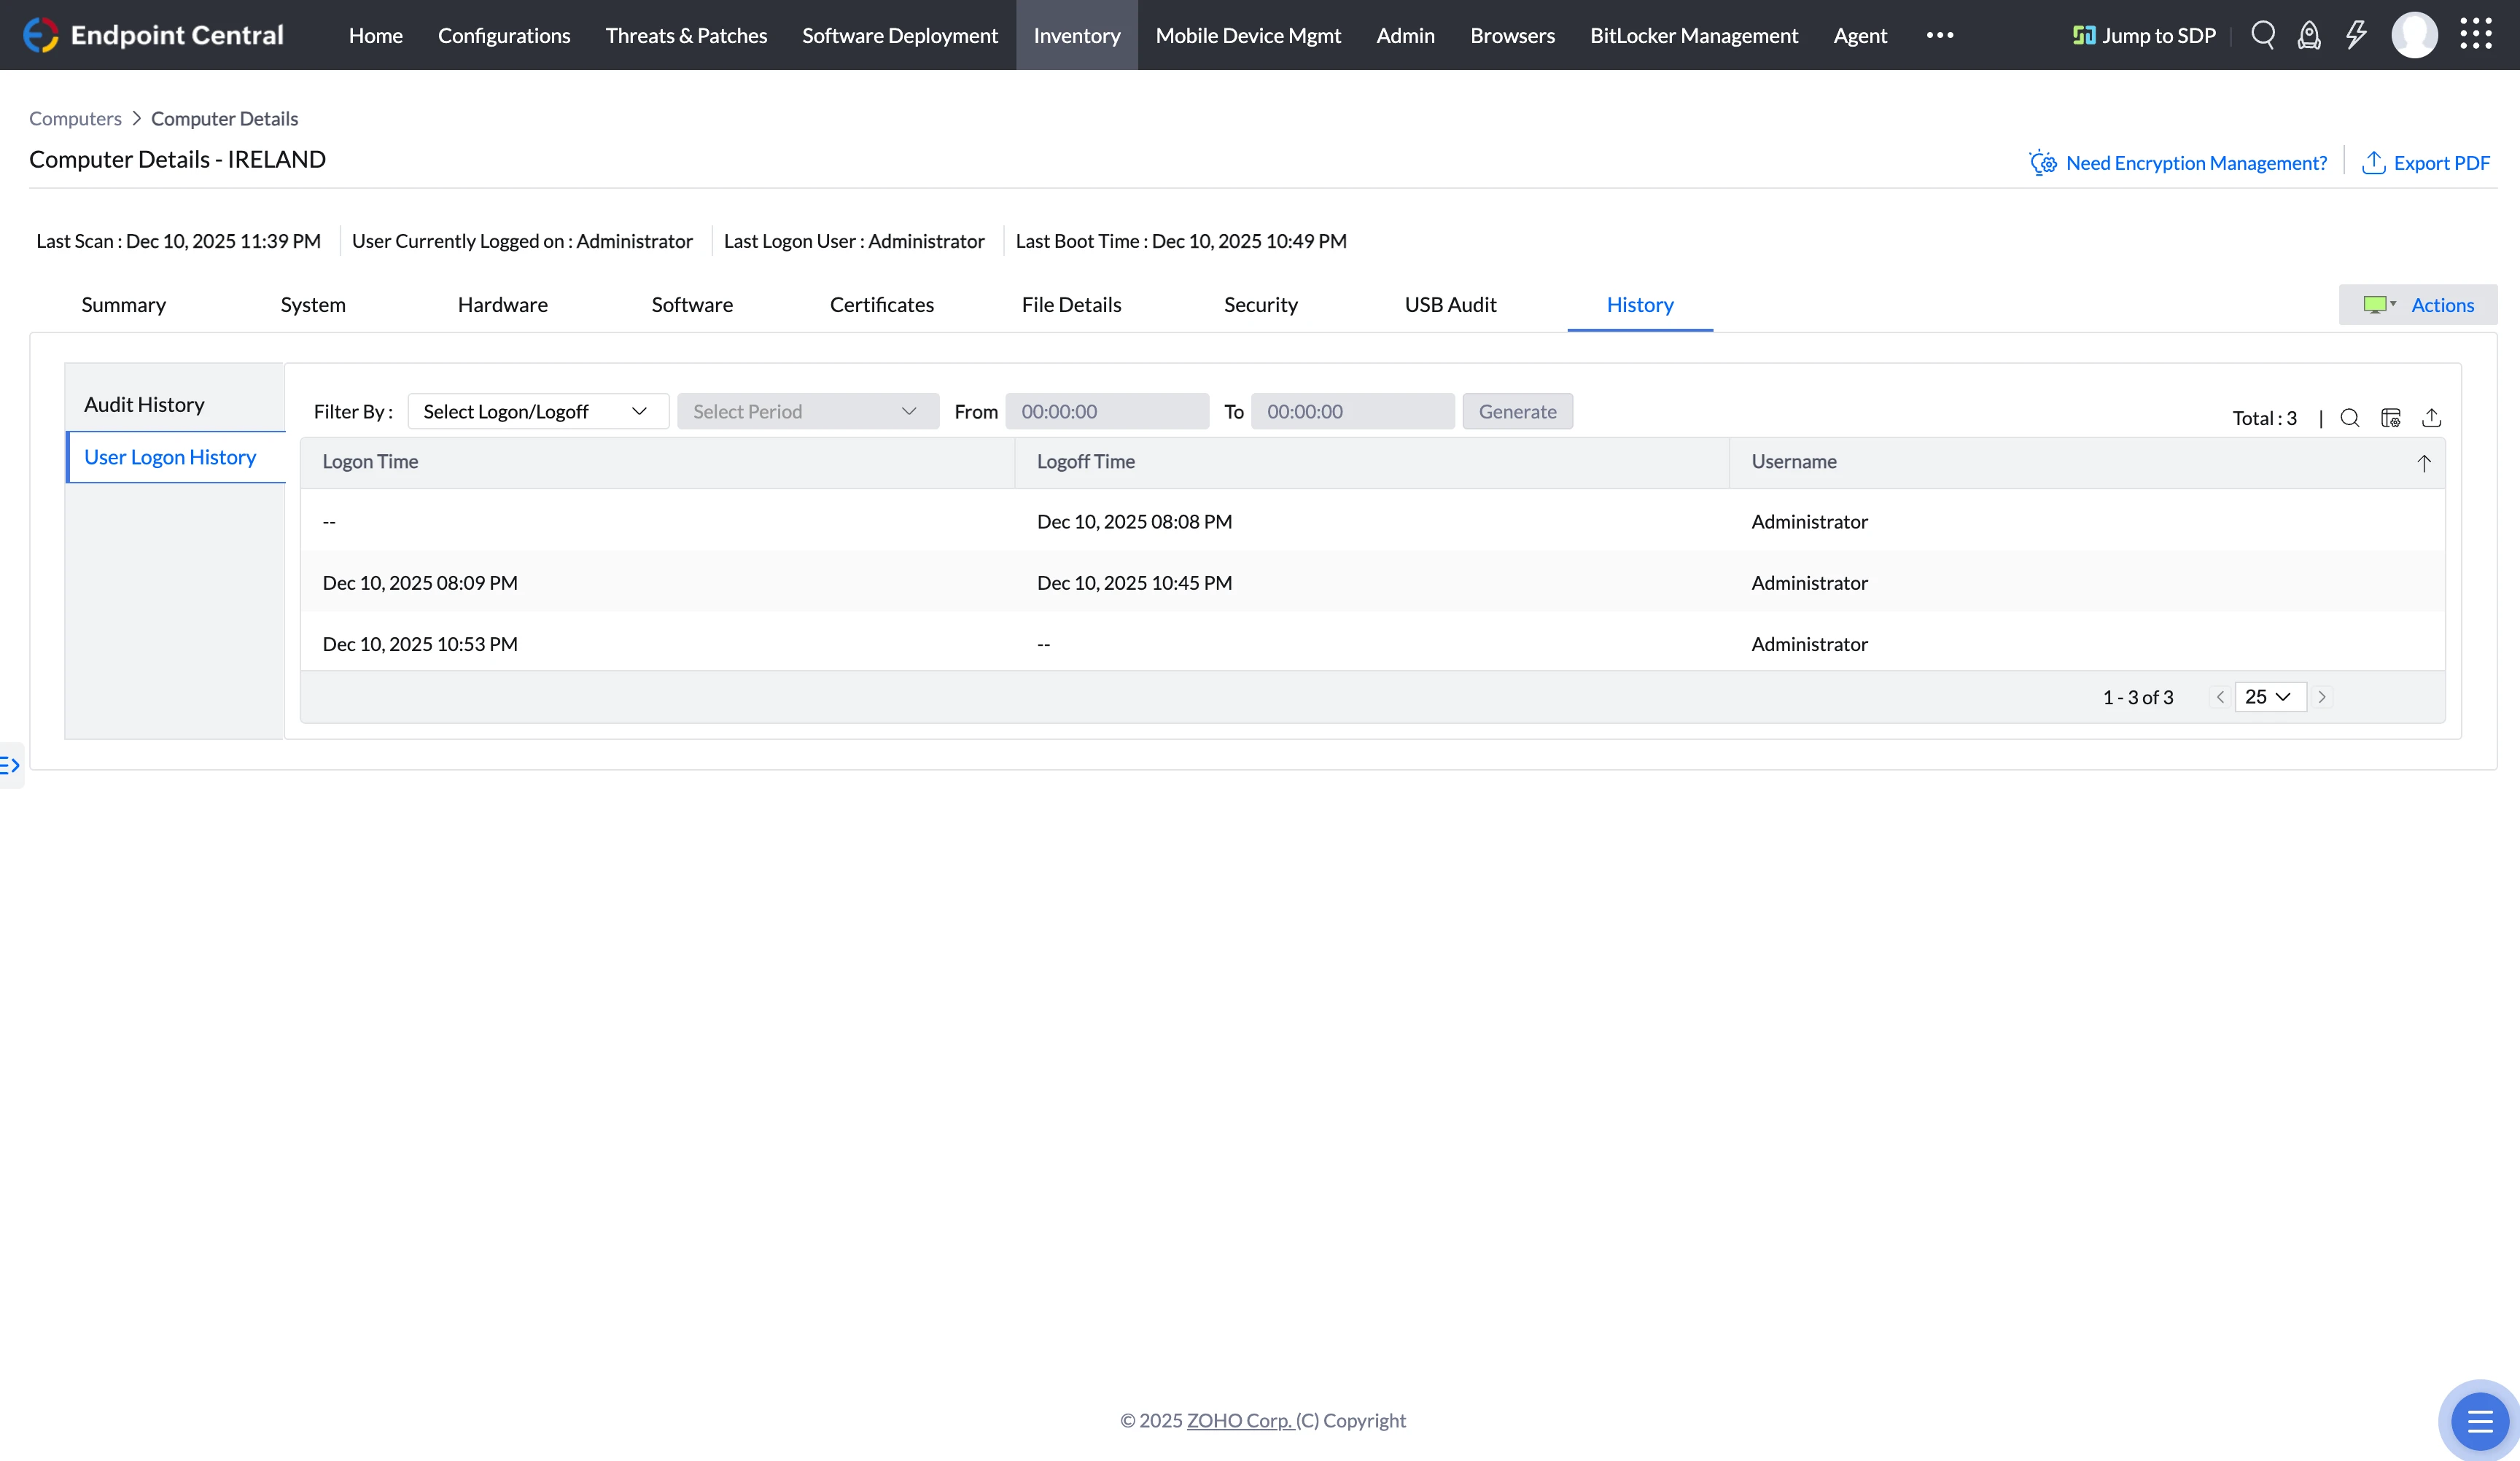
History Tab
The History tab tracked system changes over time with two subsections: Audit History and User Logon History.
Audit History showed timestamped events with expandable details.
User Logon History displayed login and logout activity:
3. Acronis
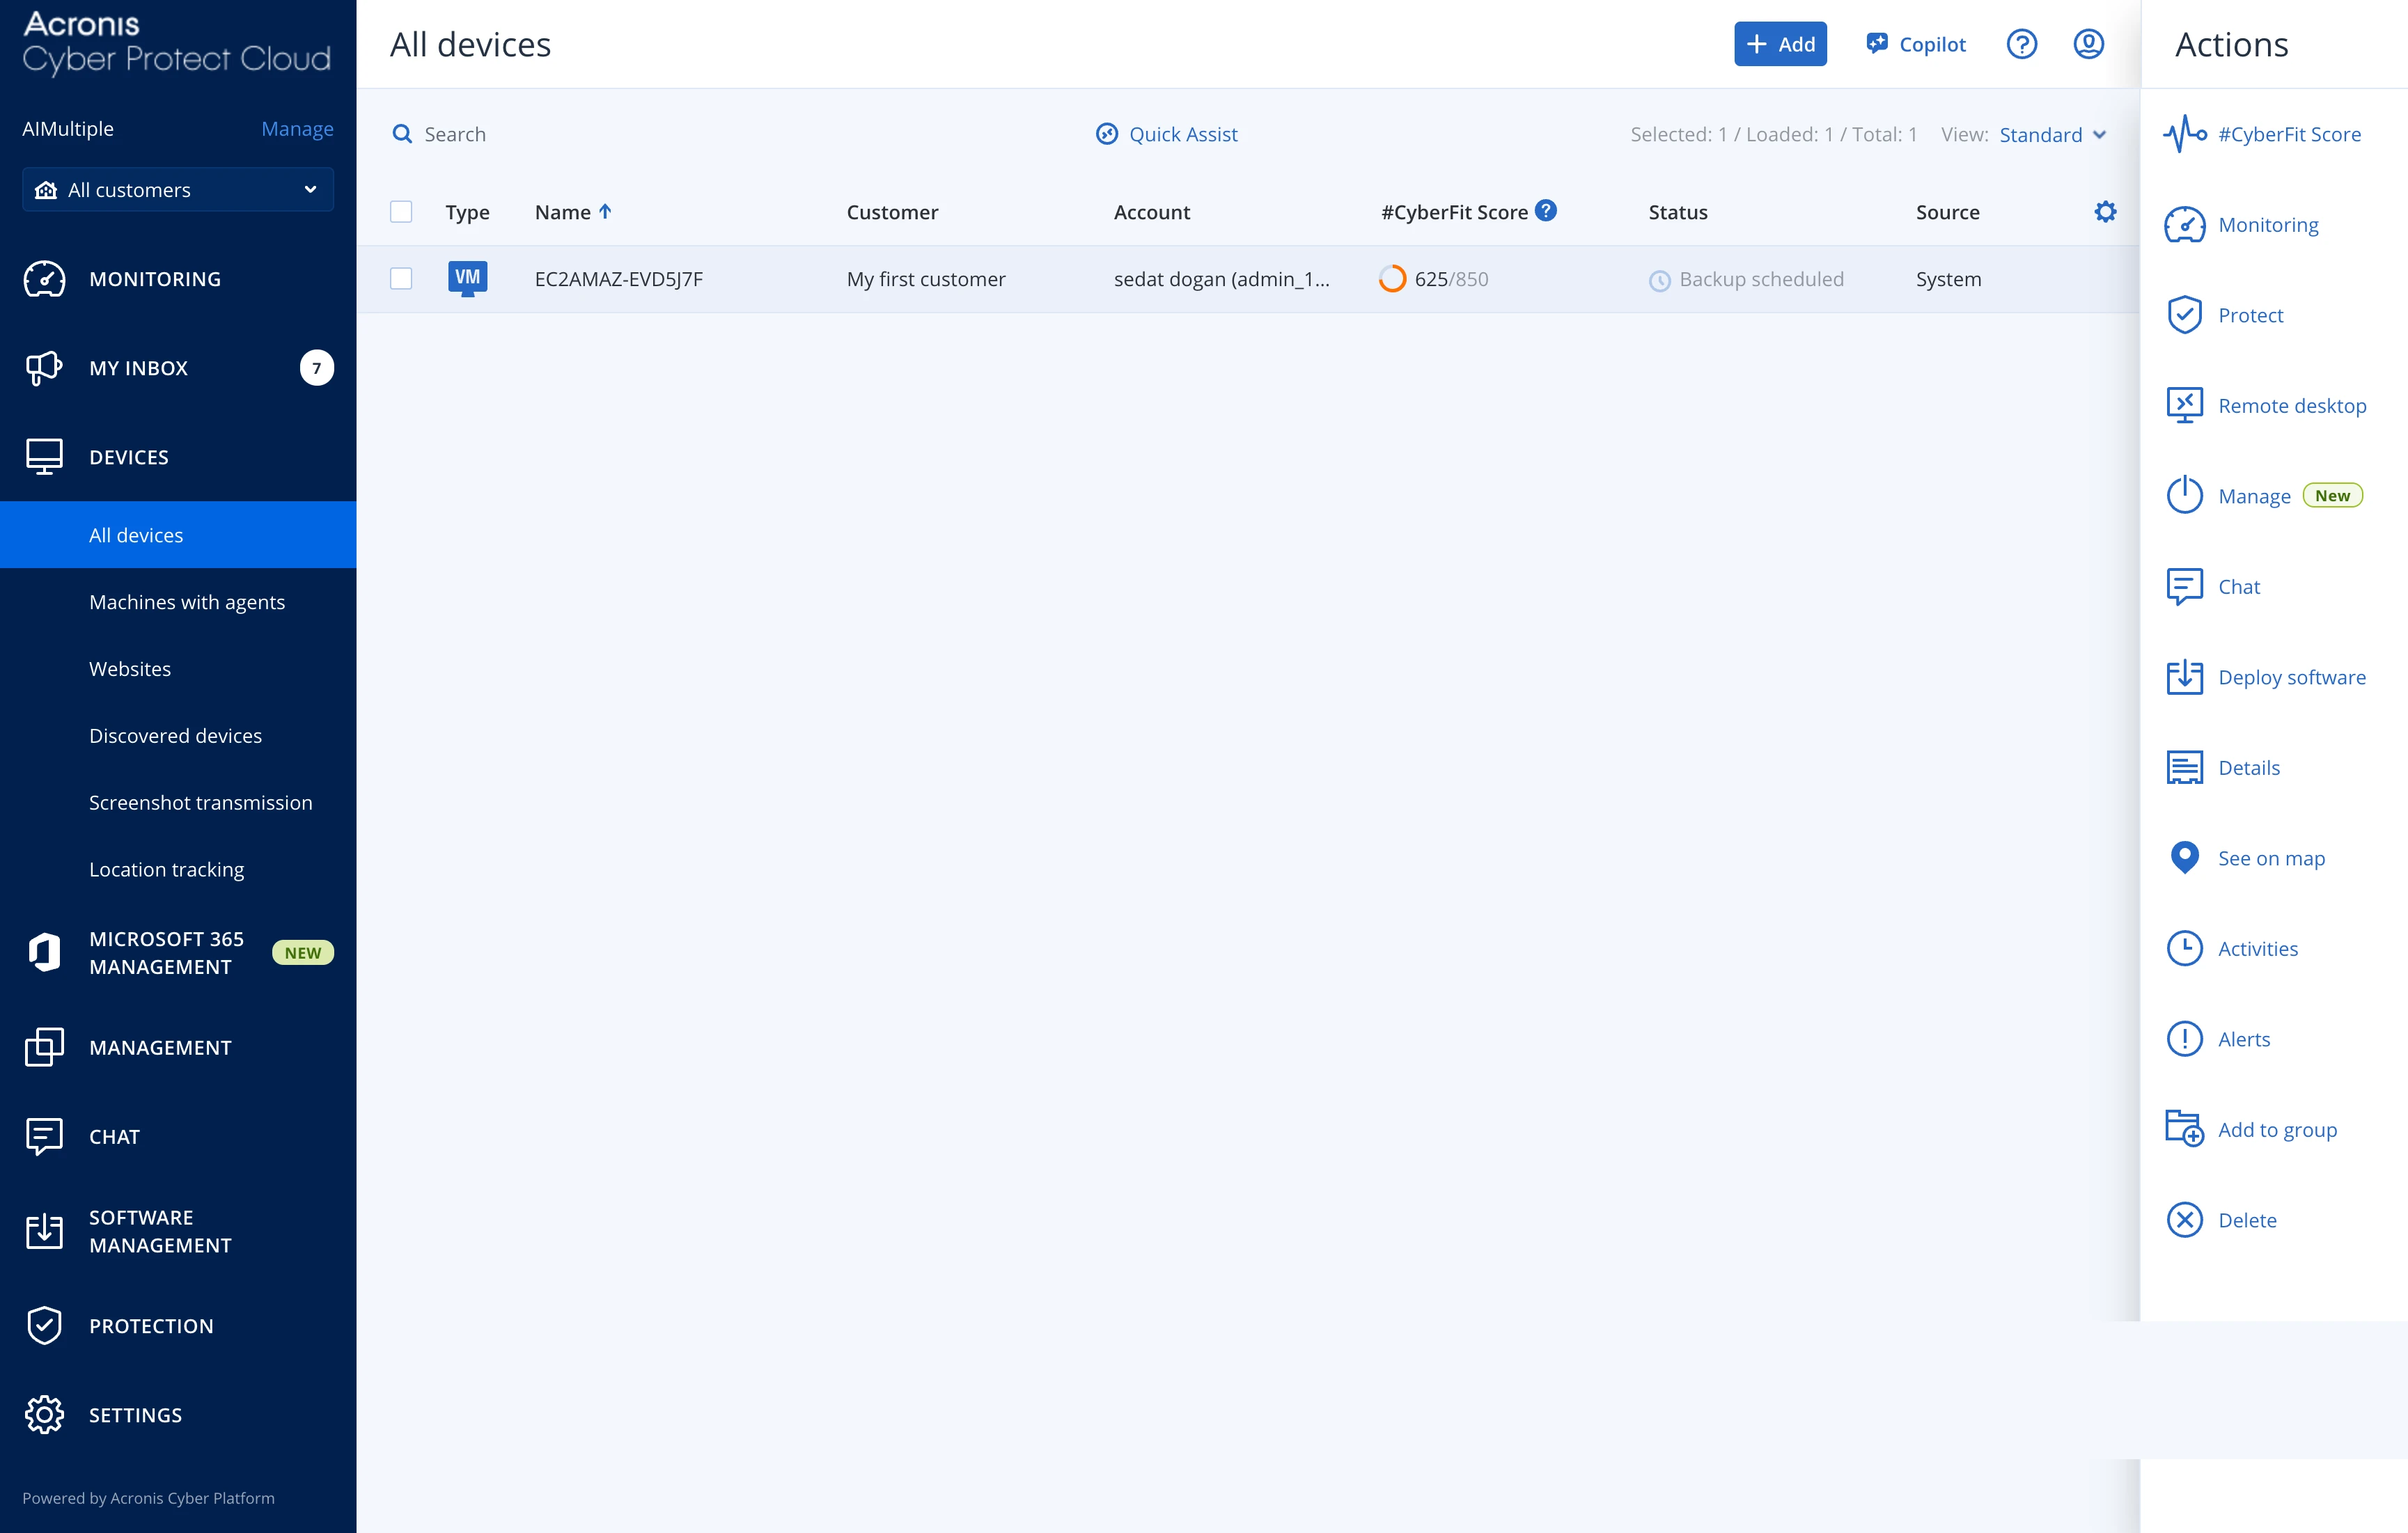
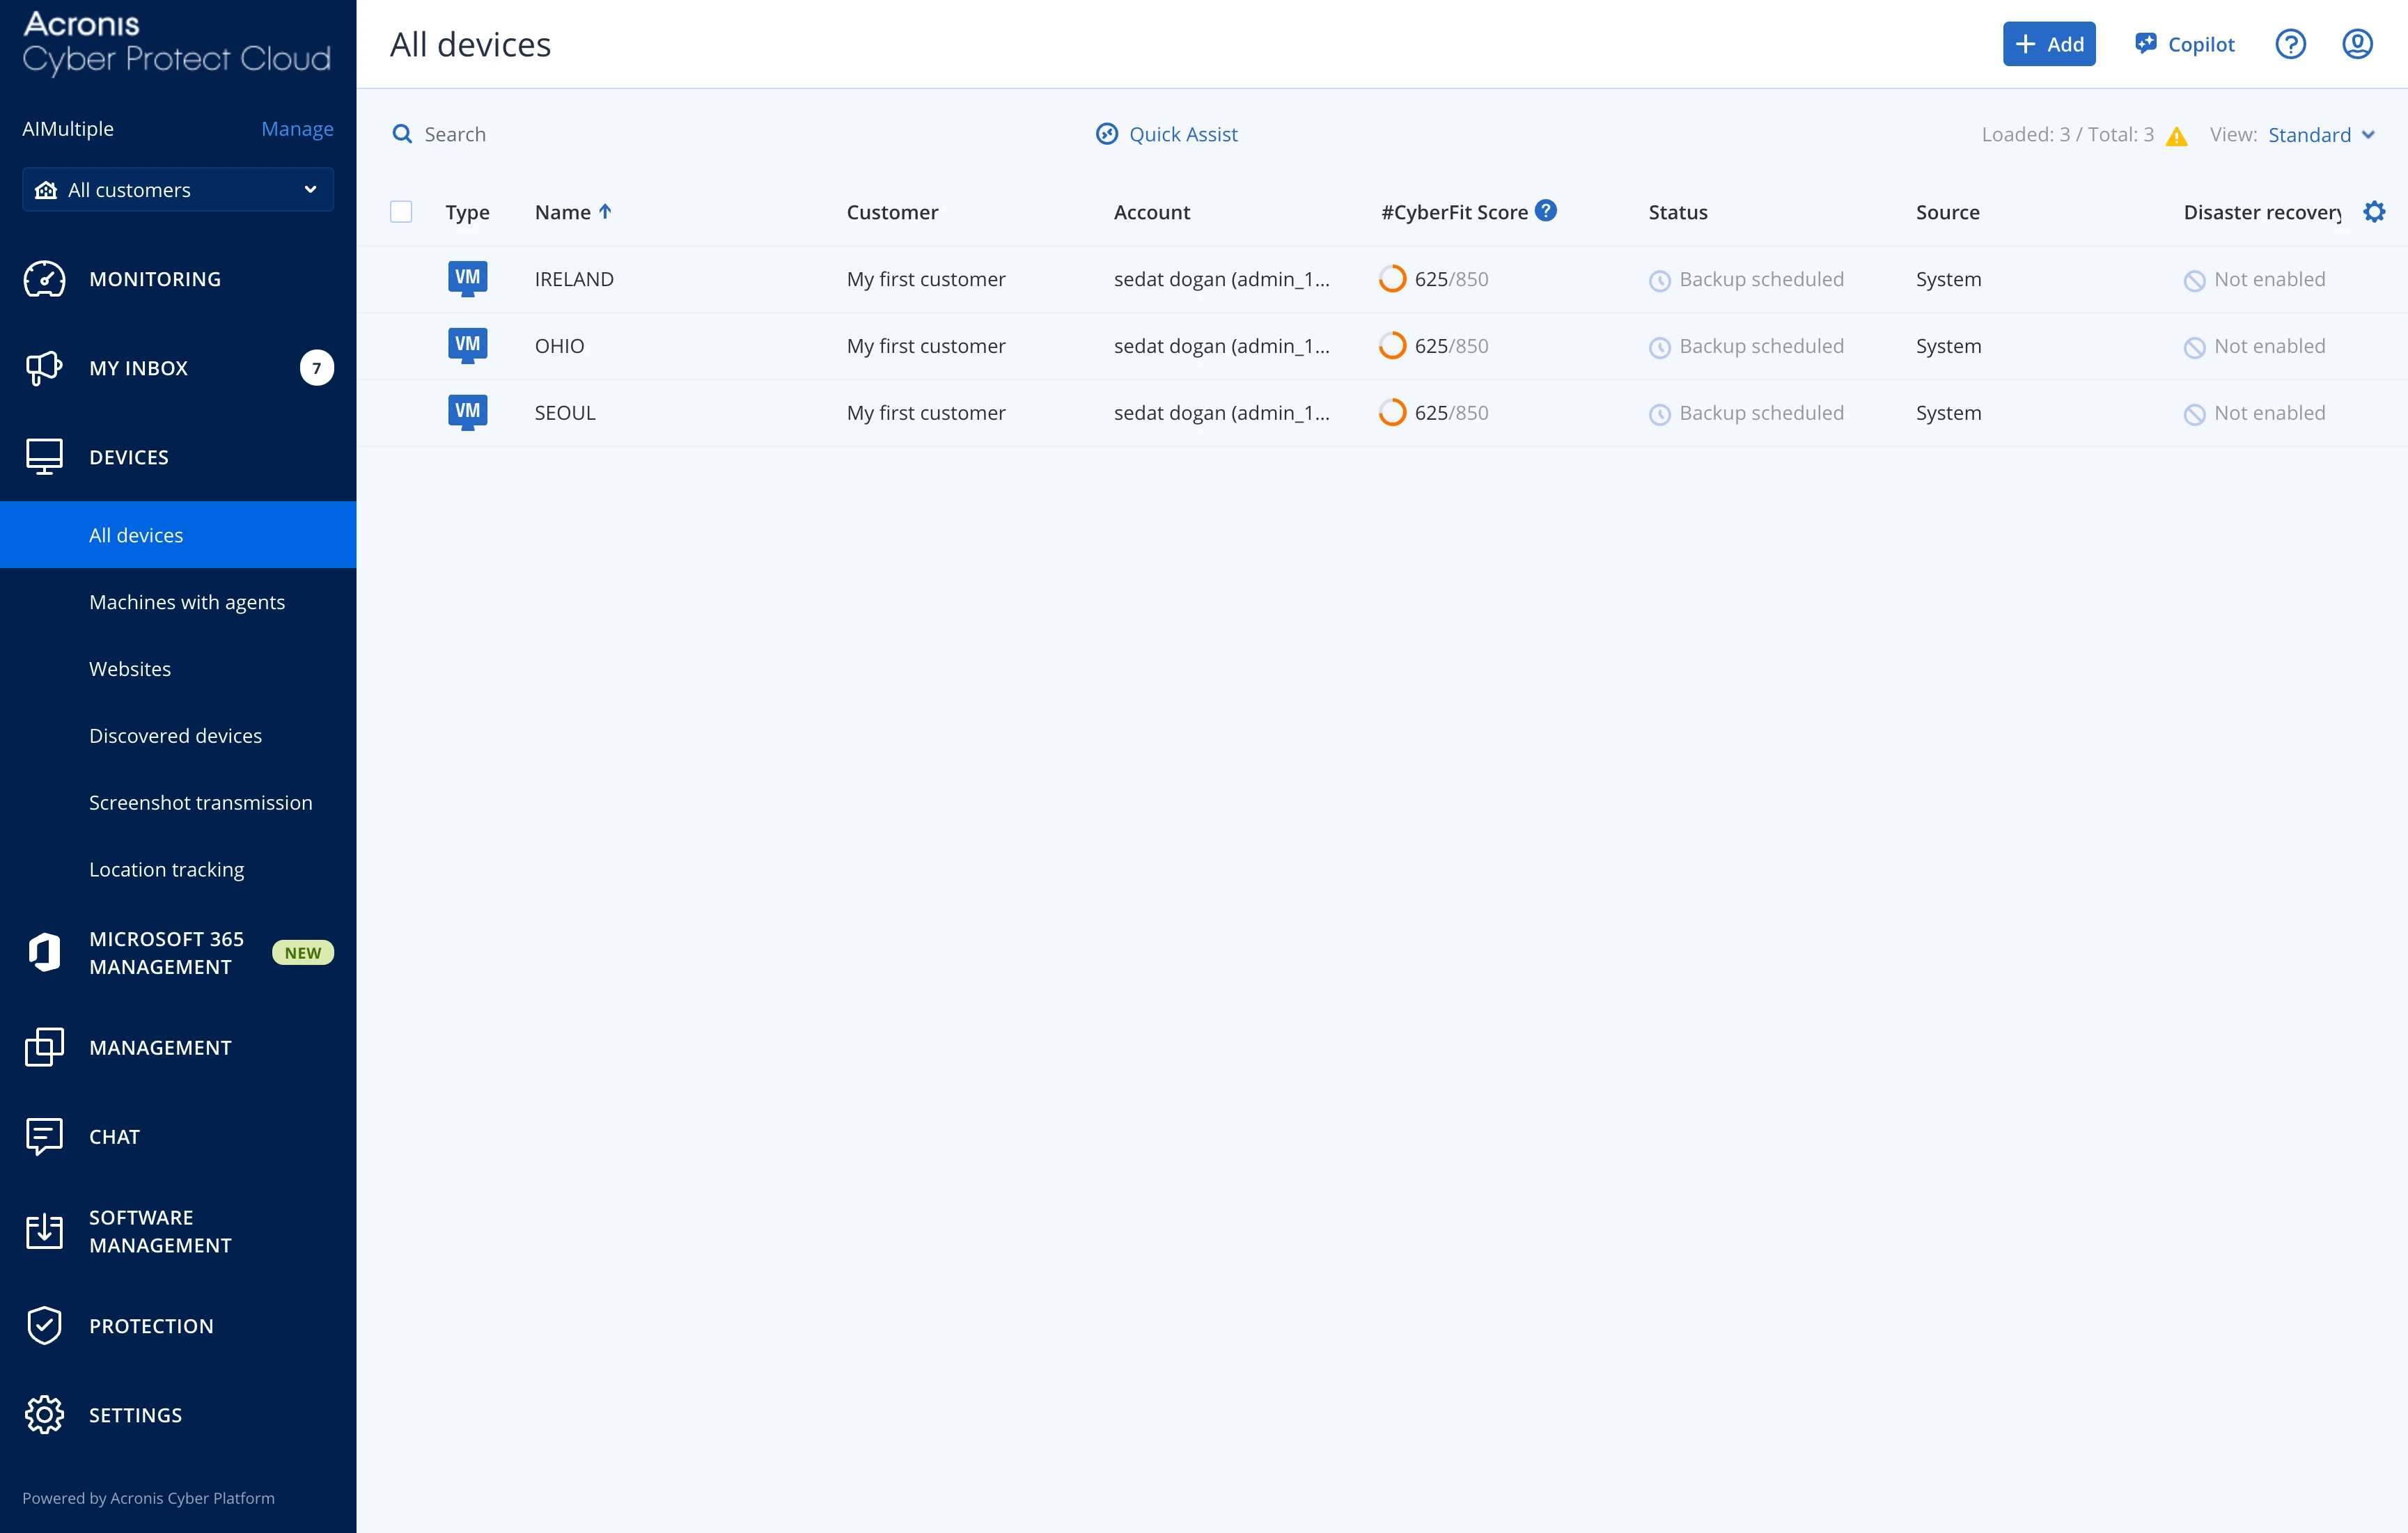
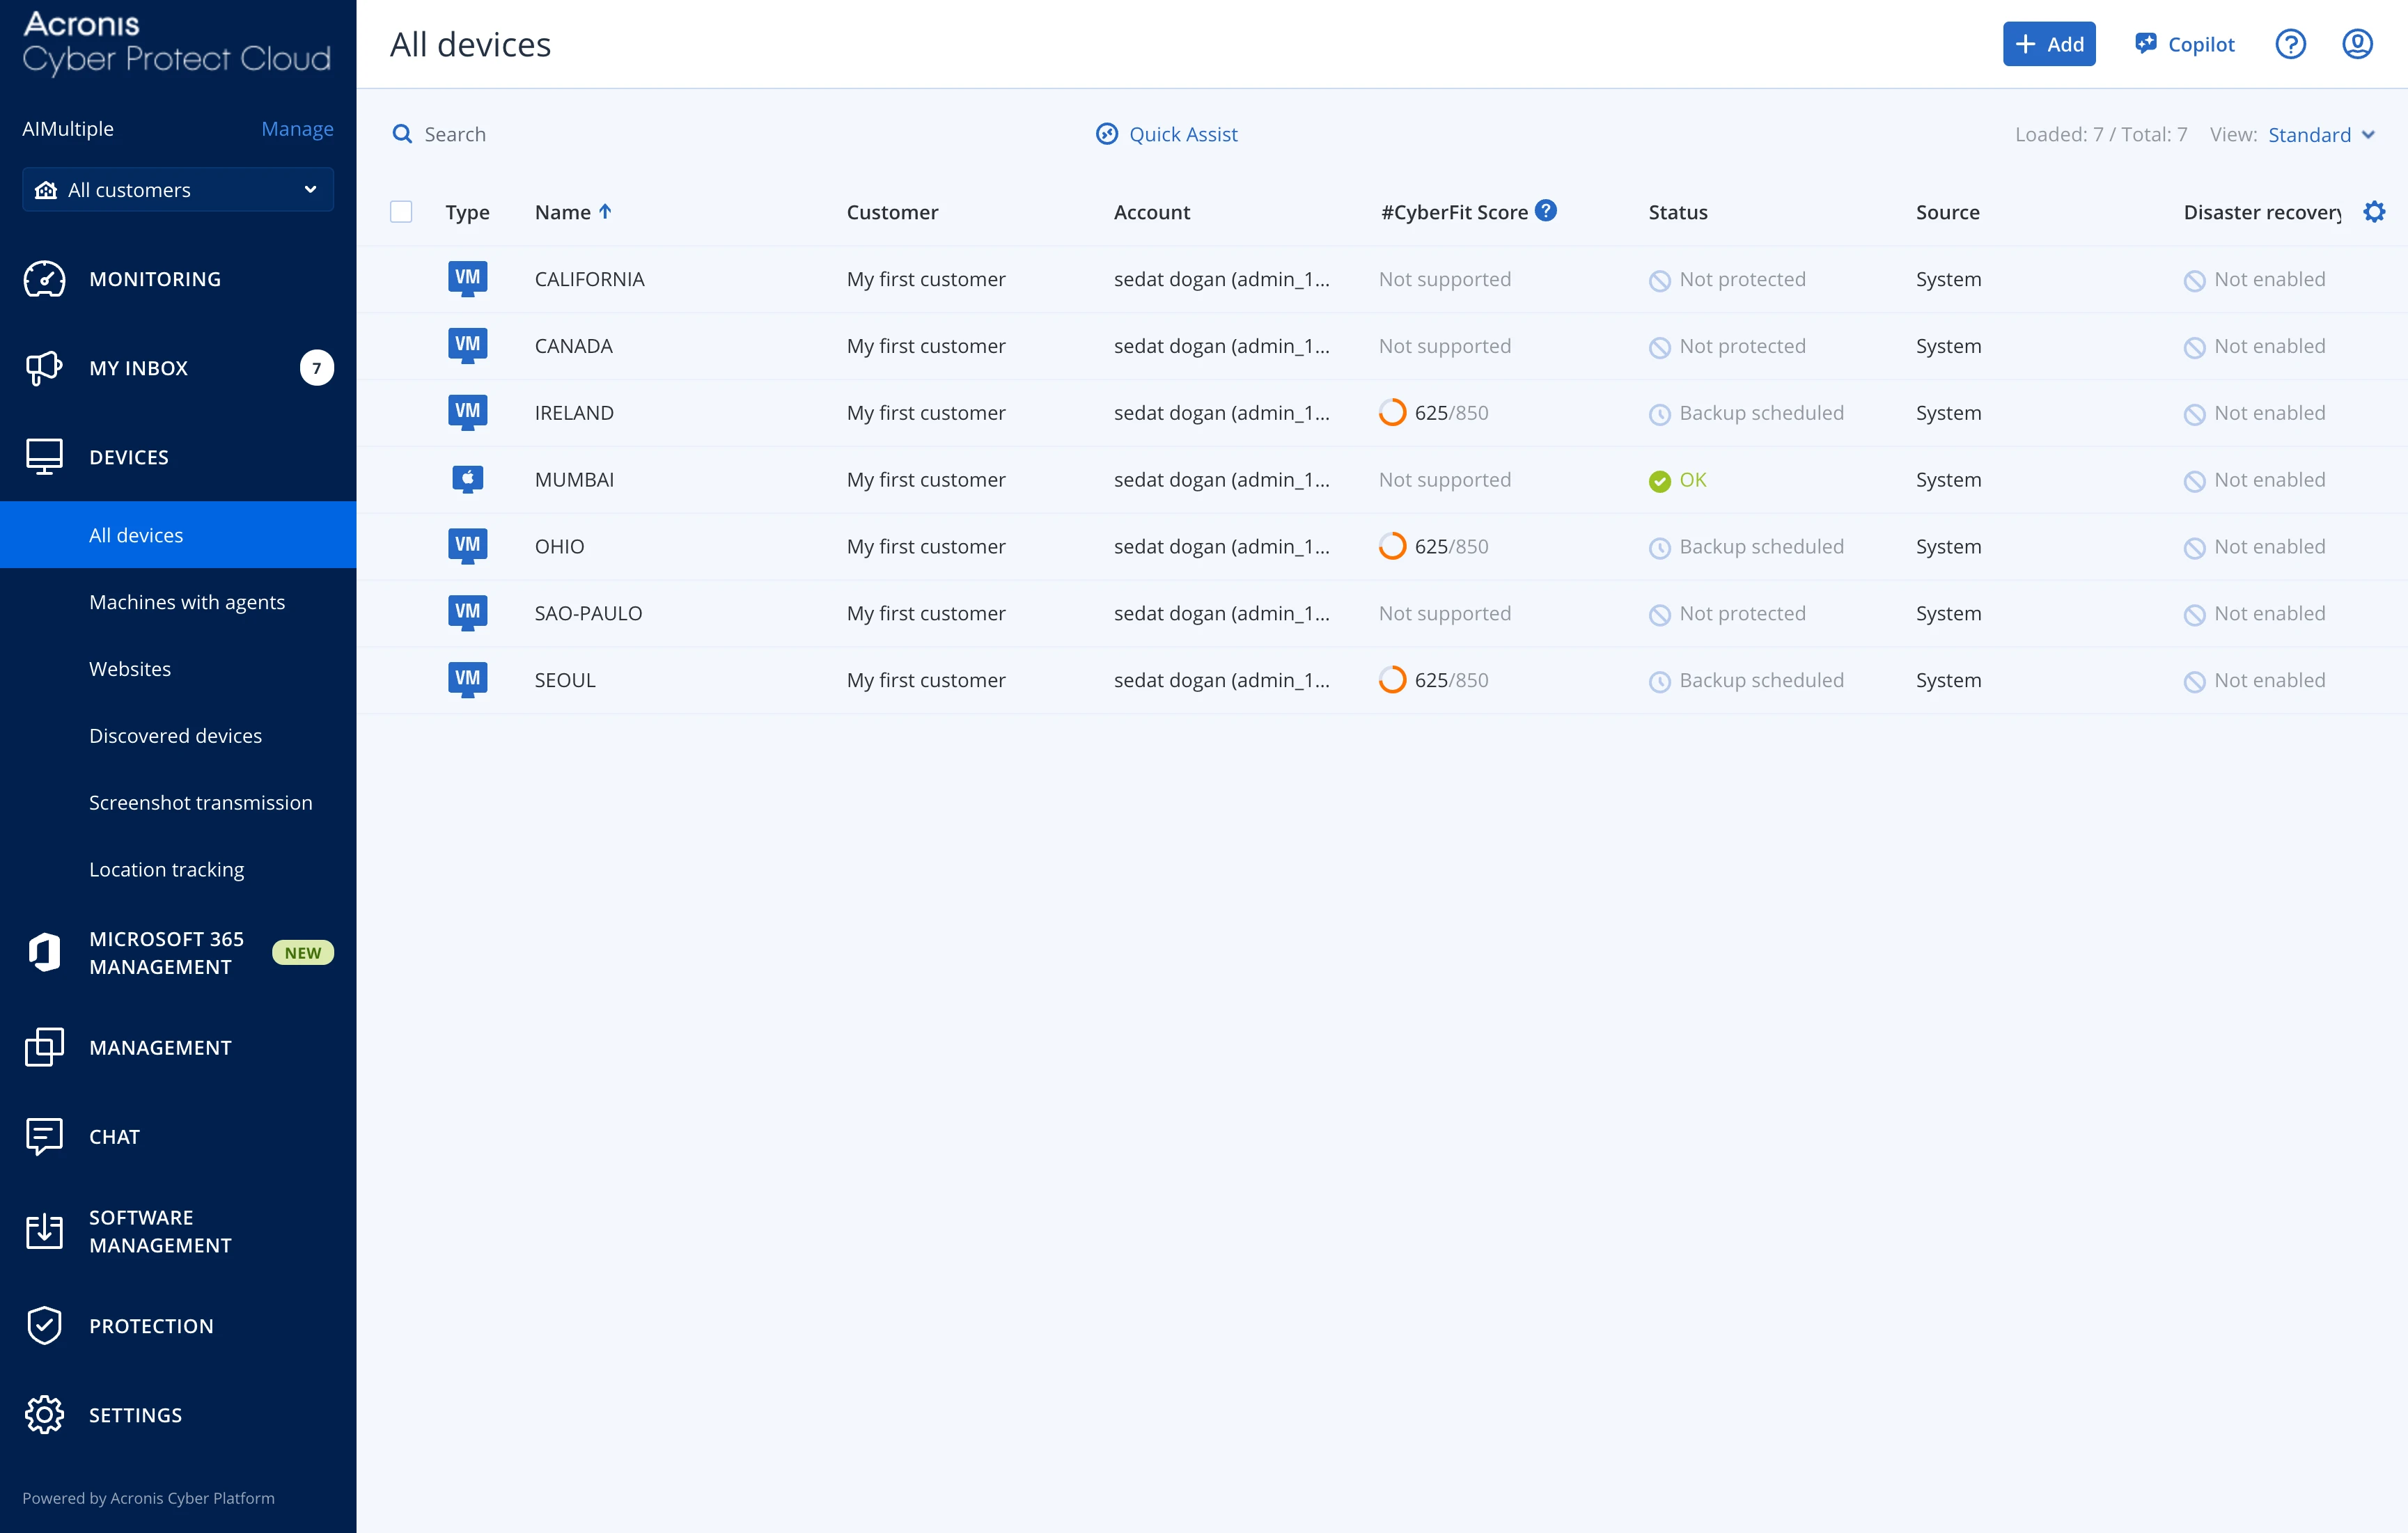
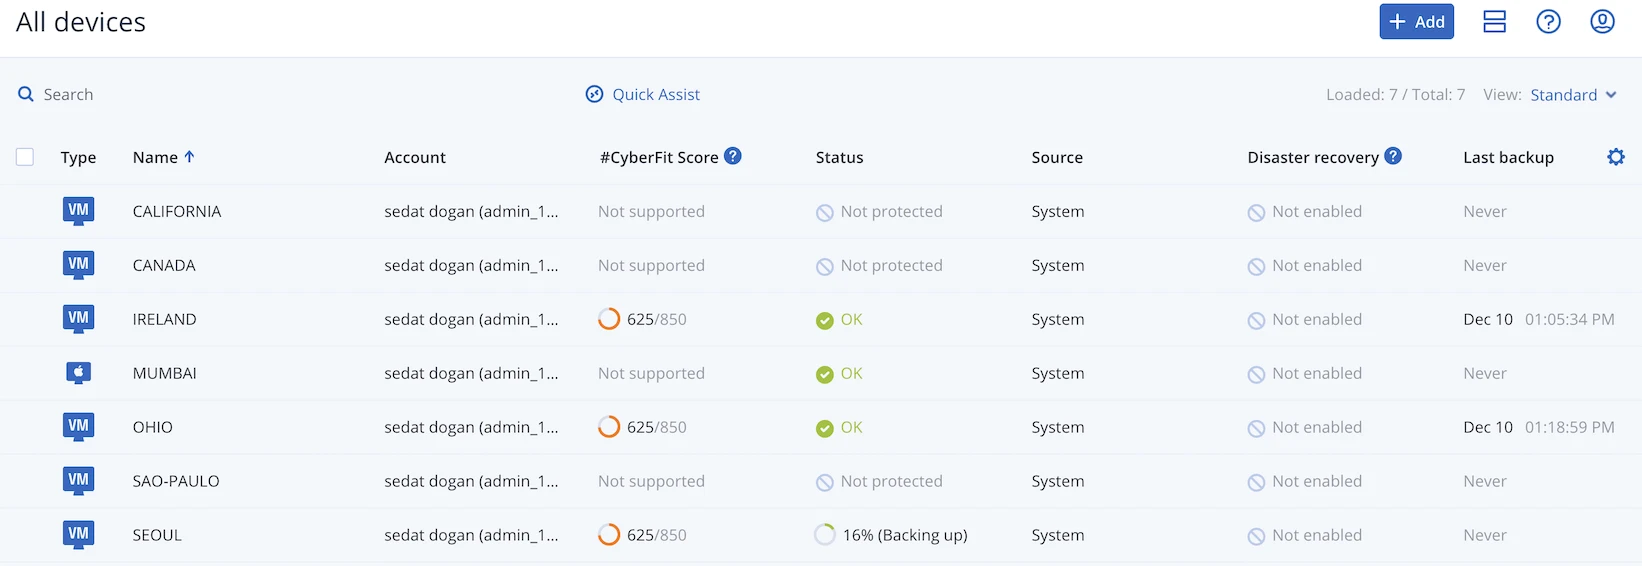
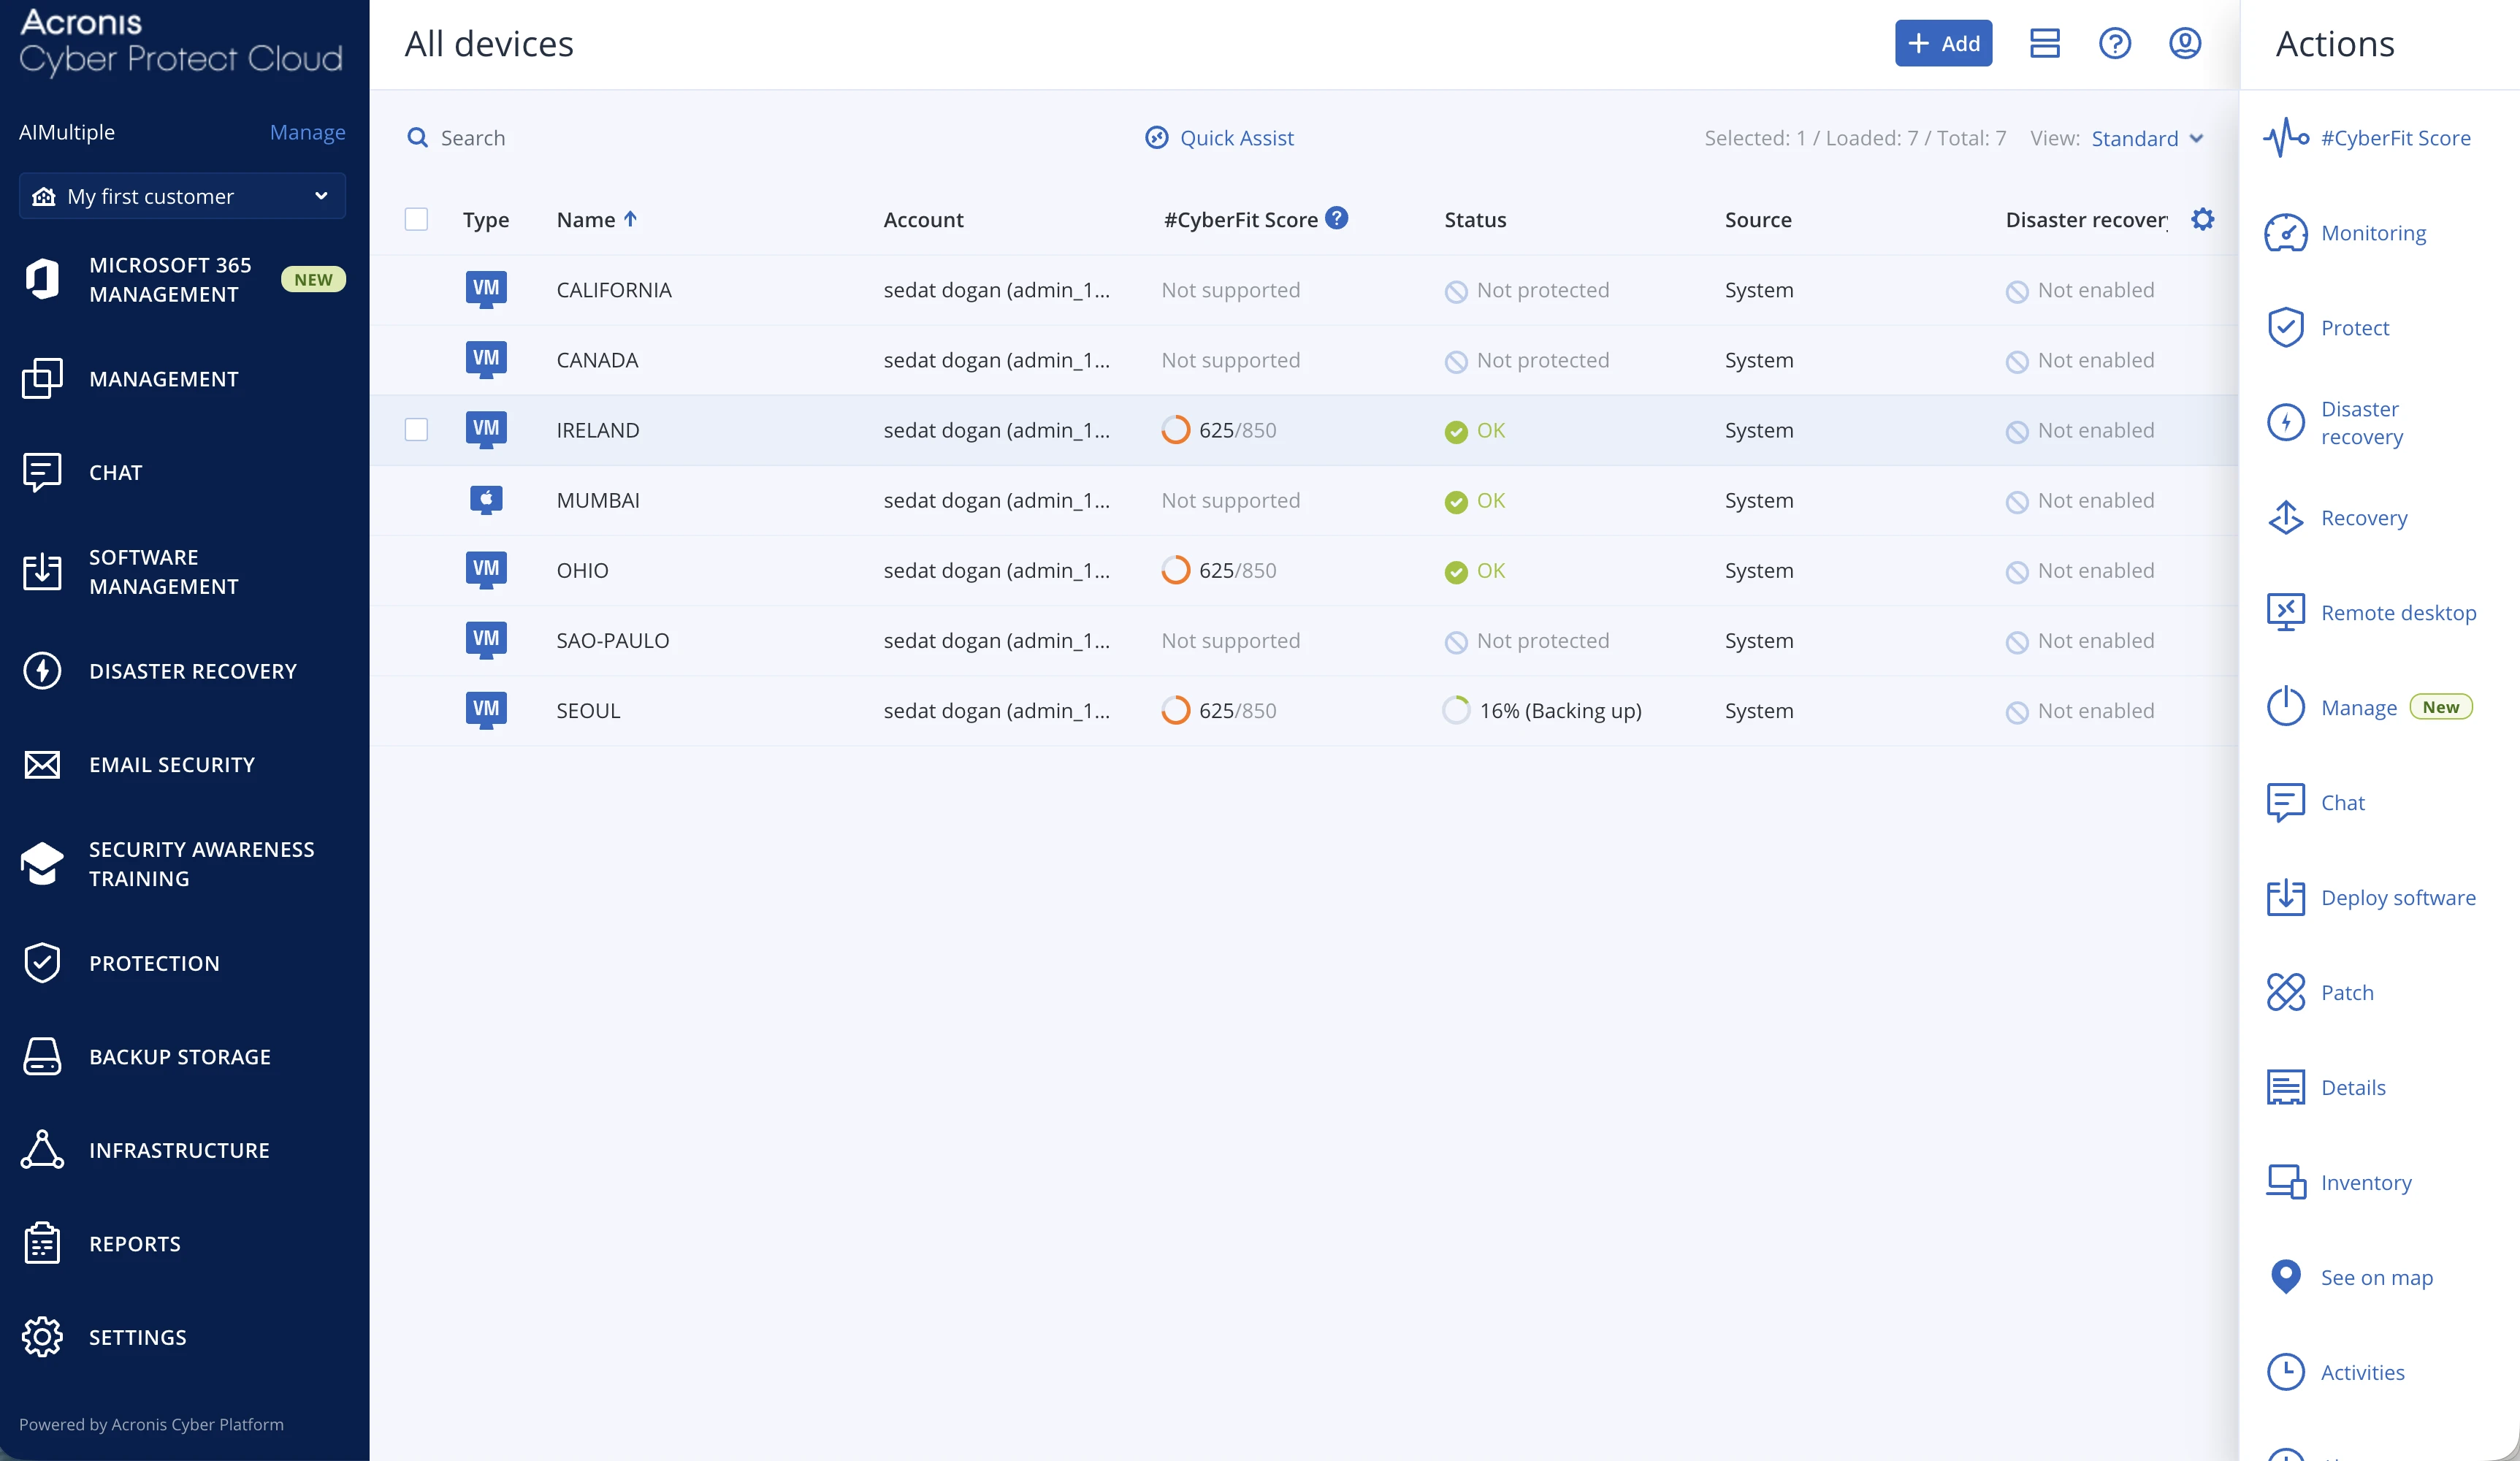
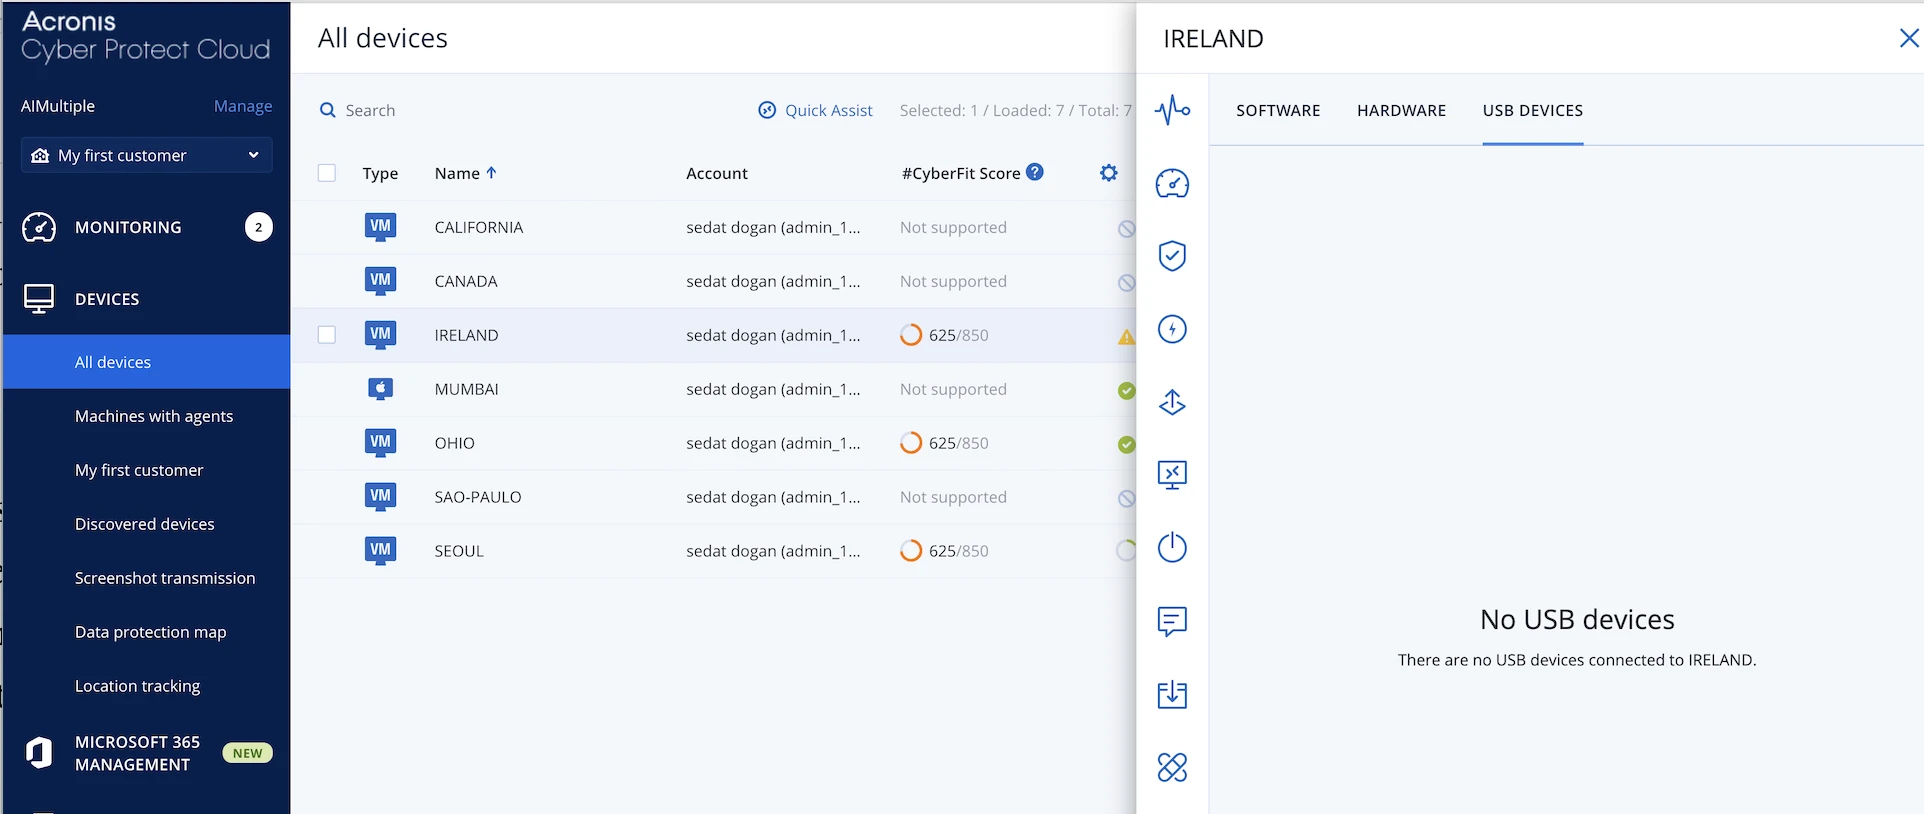
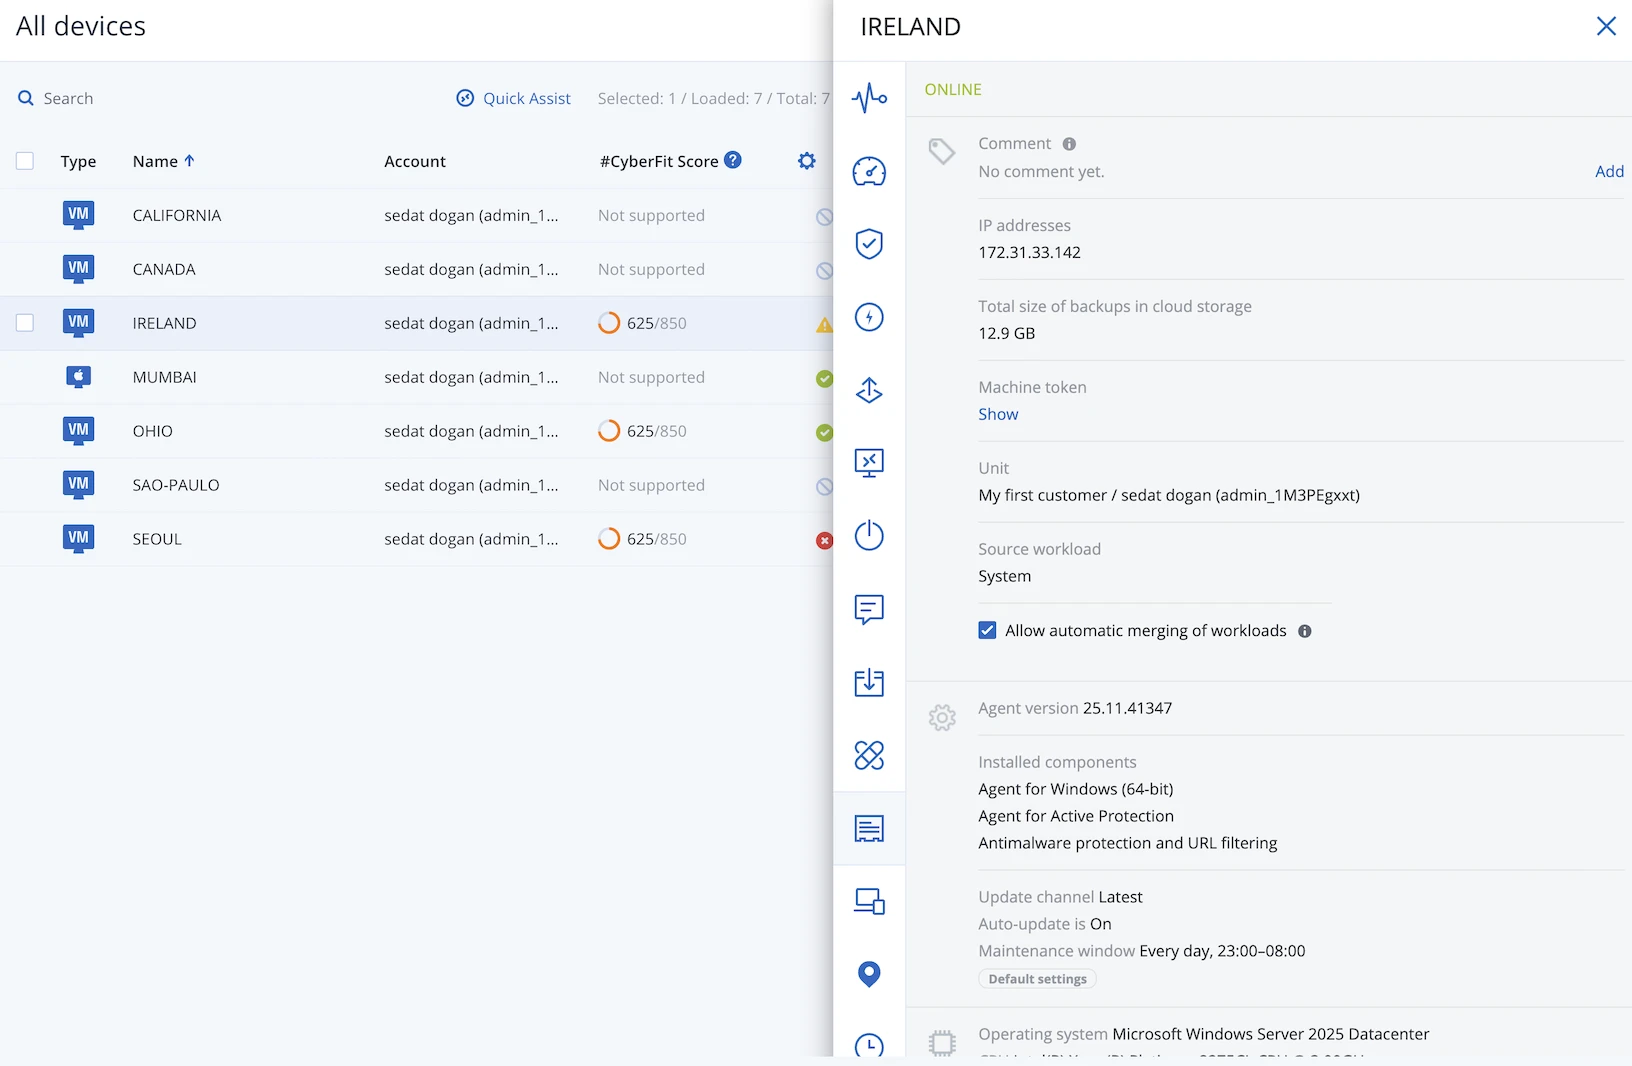
When opening the device section, all machines appear in a single table view. Each row shows the device type, name, associated account, CyberFit Score, protection status, source, disaster recovery status, and last backup time.
One limitation becomes obvious immediately: Windows and Linux systems are not initially separated. Device type is indicated with icons (for example, VM), but there is no operating-system-based grouping or default filter. In larger environments, this makes the initial scan less efficient.
Clicking on a Windows server does not open a dedicated device page; instead, a panel slides in from the right side of the screen. This panel-based approach allows users to stay within the main device list while interacting with a specific machine. It works well for quick checks, but the limited horizontal space makes deeper inspection feel compressed compared to a full-page layout.
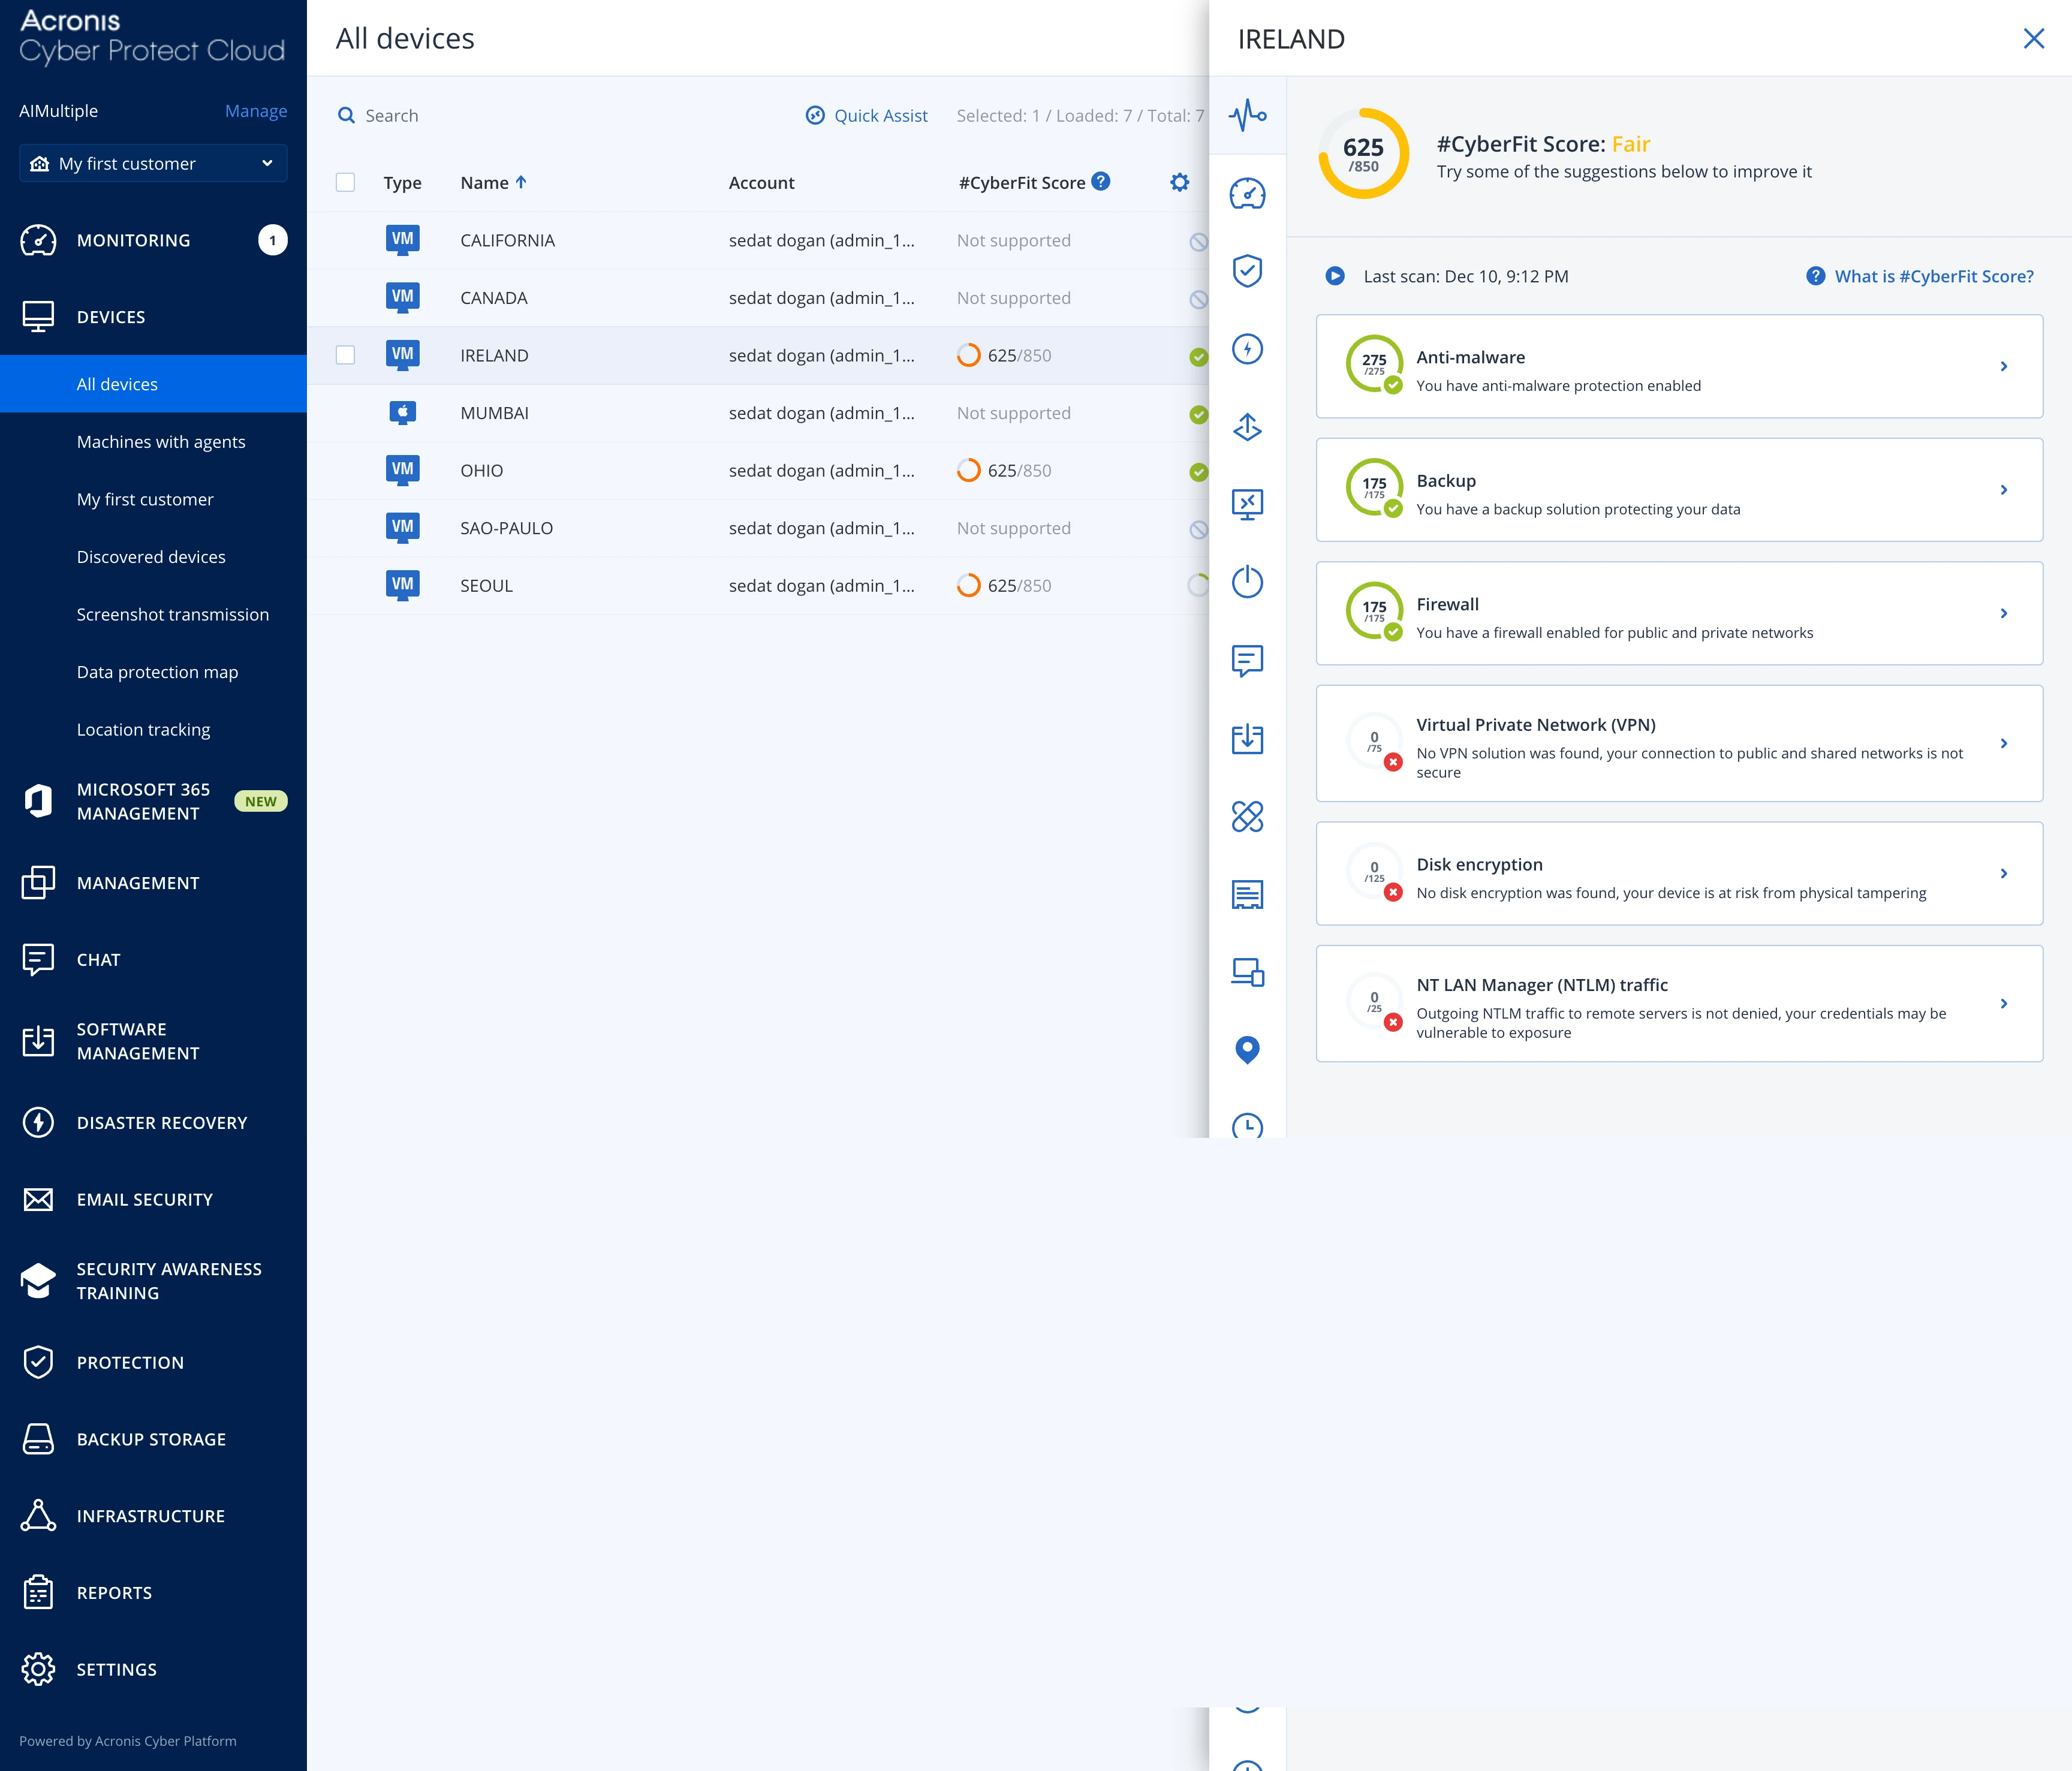
The first section shown in the side panel is the CyberFit Score. This is Acronis’ own scoring system that evaluates the device against a predefined set of security checks.
When opening the score details, several areas are listed, including backup status, firewall configuration, disk encryption, VPN usage, and NTLM traffic.
In practice, some of these checks produced misleading results. Disk encryption was flagged as missing even though the server runs on AWS with encryption enabled at the infrastructure level. VPN usage was also marked as an issue, despite access being restricted through an external VPN and network-level controls. These findings suggest that the scoring logic evaluates the server in isolation and does not account for cloud or network-based protections.
As a result, the CyberFit Score is better suited as a general indicator than as a reliable security assessment.
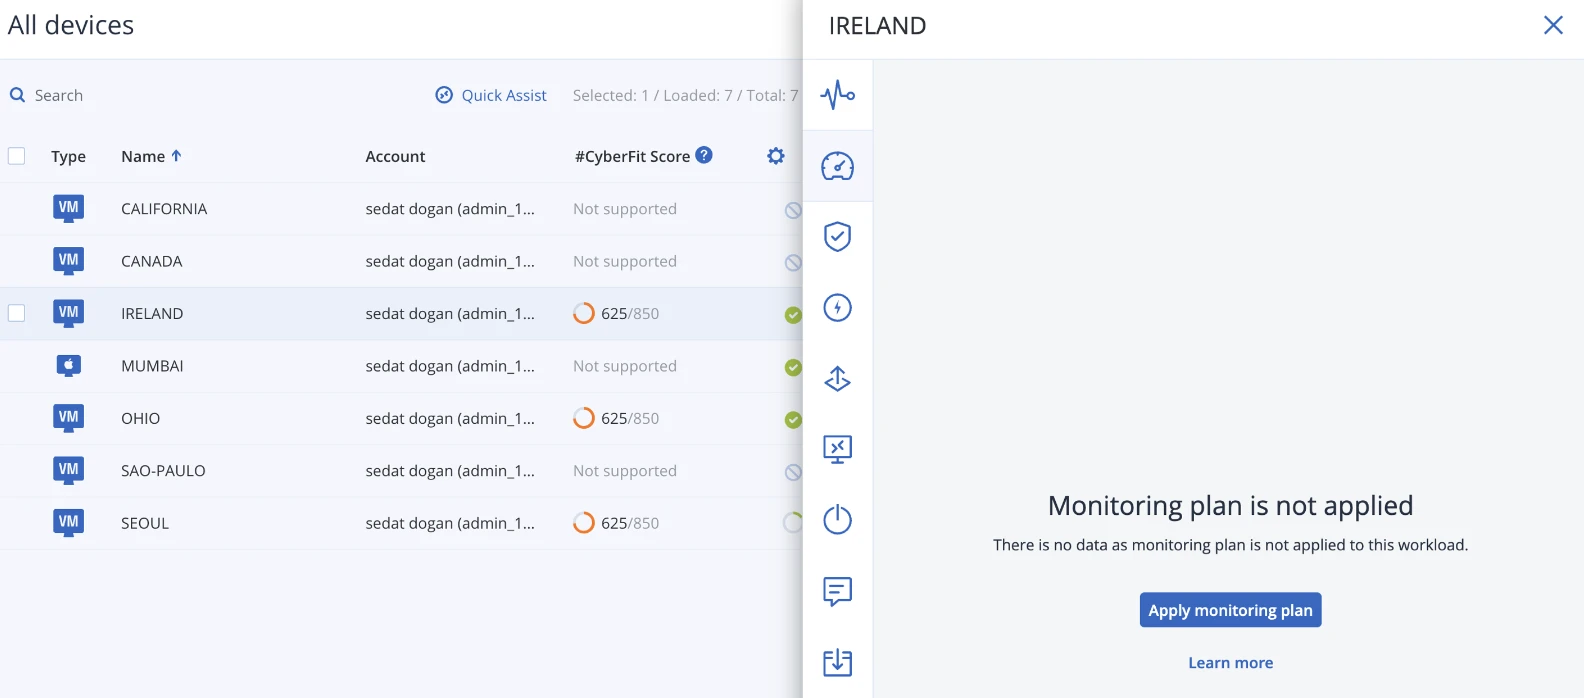
Opening the Monitoring section shows no metrics by default. Instead, the interface displays a message stating that no monitoring plan is applied.
This means monitoring does not start automatically. The user must explicitly enable it by selecting a plan before any data becomes available.
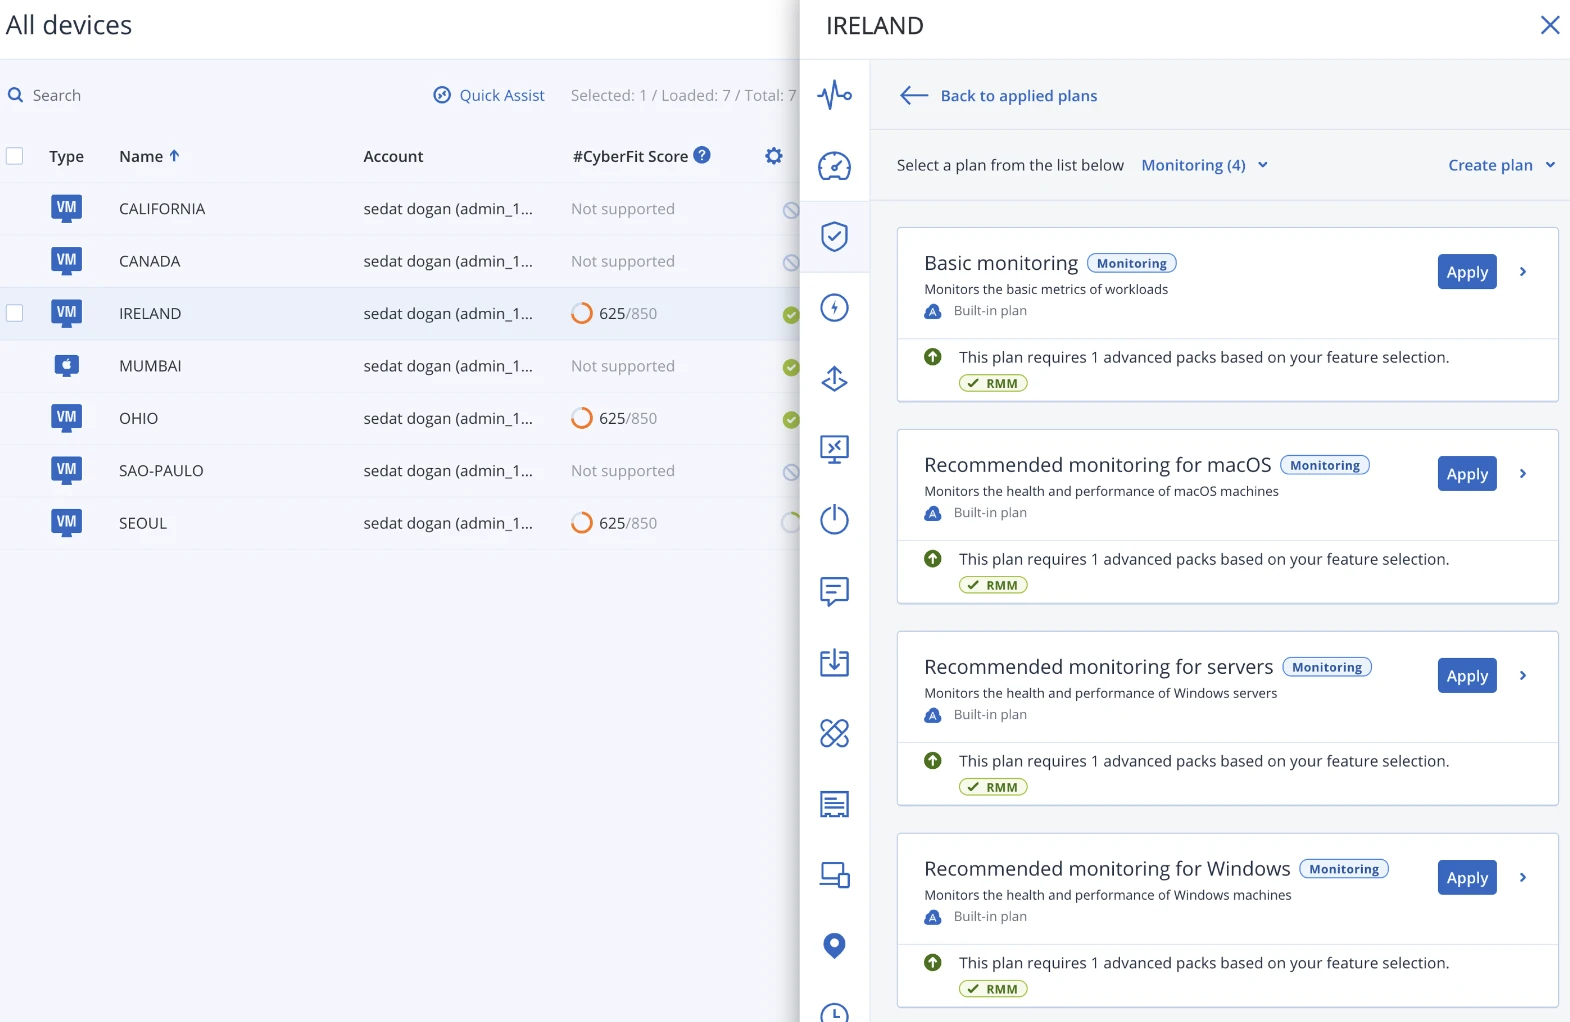
When applying a monitoring plan, the system requires two-factor authentication to be enabled. The process is enforced before continuing, which adds a security step for administrative actions.
After enabling two-factor authentication, the platform presents a list of predefined monitoring plans. These include generic monitoring as well as operating-system-specific recommendations.
Even when a Windows server is selected, plans for macOS are also shown, which makes the selection less intuitive. The correct plan must be chosen manually.
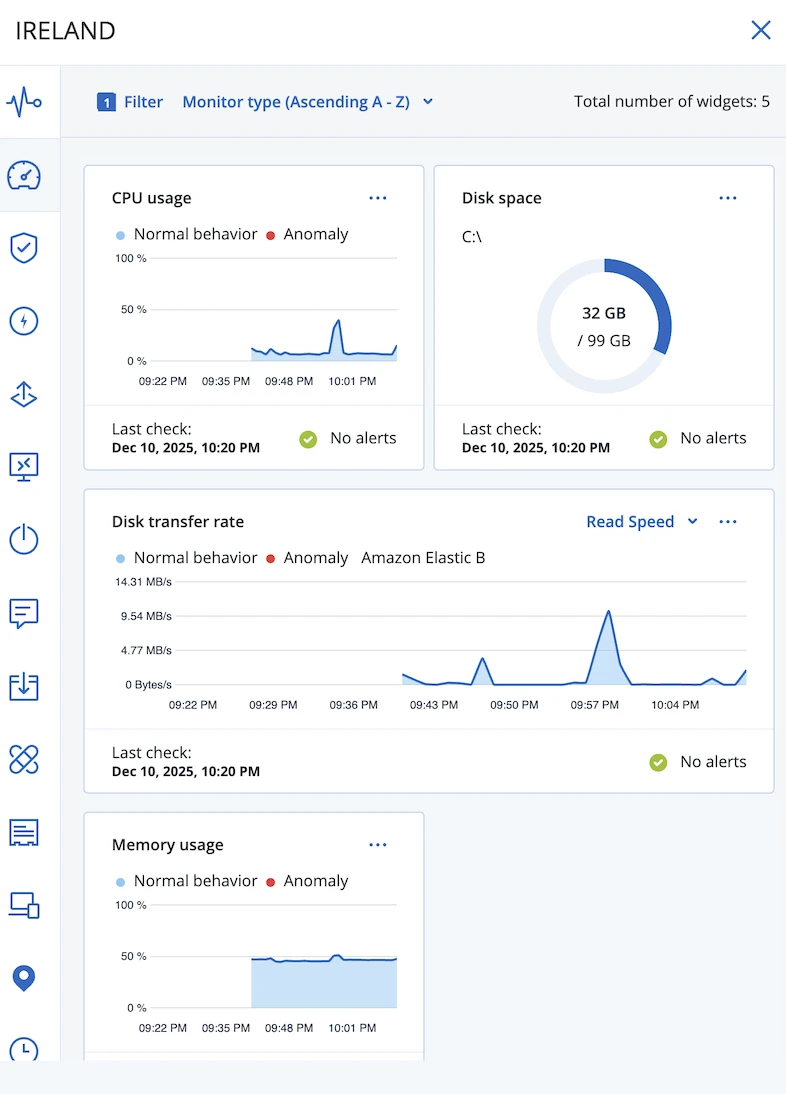
Once the Windows monitoring plan is applied, the system begins collecting basic performance data such as CPU usage, memory usage, disk activity, and network traffic. Unlike NinjaOne, which collects these metrics automatically, Acronis requires manual configuration.
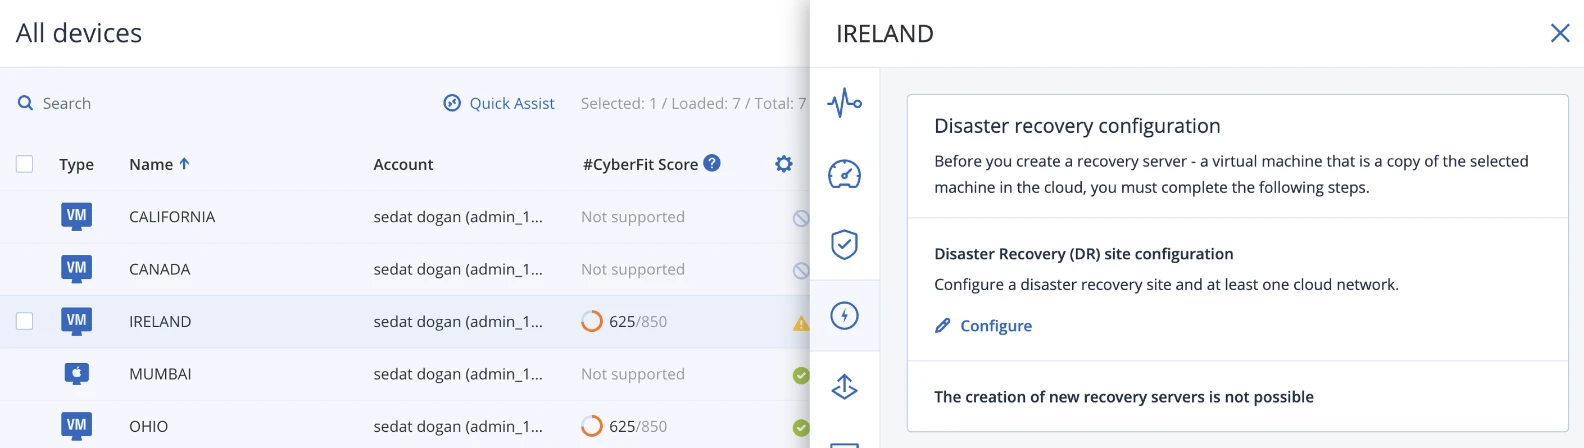
Entering the Disaster Recovery section immediately prompts the user to configure a recovery plan. Since no plan was set up, the interface does not show any additional information. This area was not explored further as it falls outside the scope of monitoring behavior.
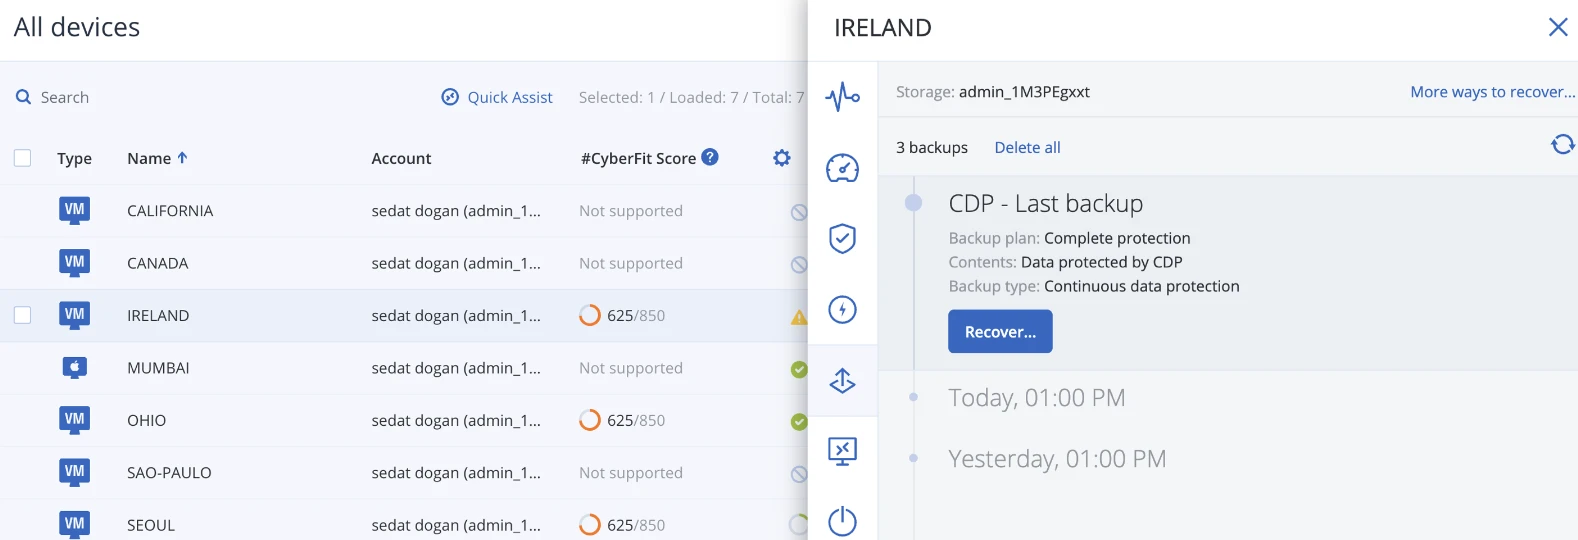
The Recovery section lists available backups and explains that restore operations are performed by selecting one of them.
The interface offers two restore paths: restoring the entire machine or restoring individual files and folders. While the options are clear, the underlying recovery process, especially for full system restores, is not visible at this stage and requires further testing.
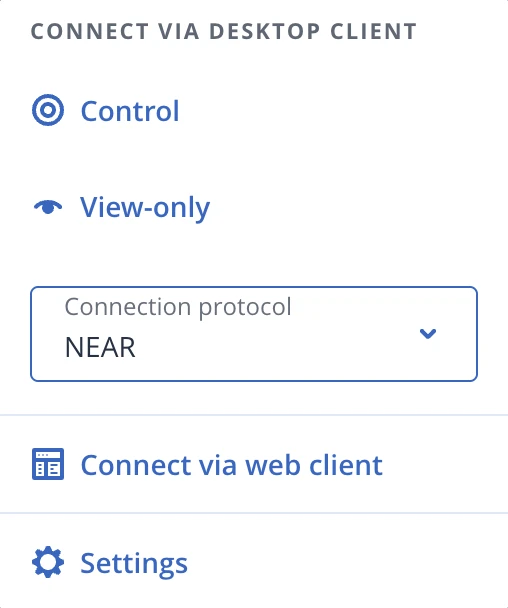
Selecting the Remote Desktop option opens a small modal window rather than a separate page.
The modal asks whether the session should allow complete control or be view-only. It also allows you to choose between two connection methods: NEAR or standard RDP. A web-based connection option is available as well, though its limitations and capabilities need to be tested separately.
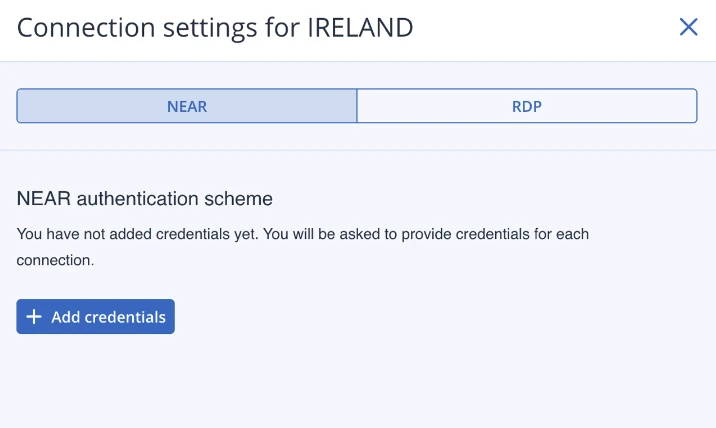
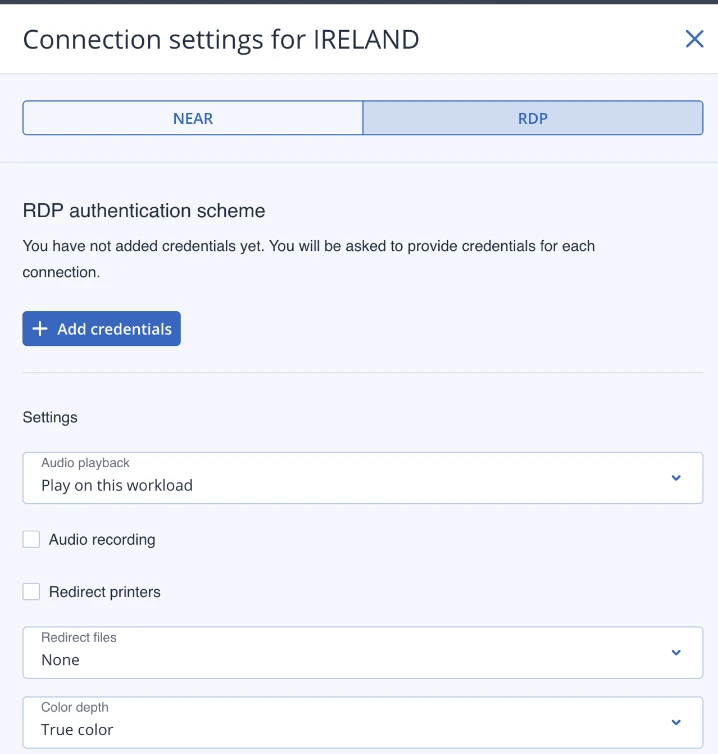
In the Settings section, connection behavior is configured separately for NEAR and RDP.
For RDP connections, the interface allows control over visual quality, audio transfer, and printer access. These options are applied before the session starts and remove the need to adjust settings inside the remote operating system itself.
When opening the Manage tab for a device, the interface presents a set of direct actions that can be executed remotely.
From this menu, you can empty the recycle bin, log out the currently active user, put the machine into sleep mode, restart it, or shut it down.
Overall, this section is focused on fast, low-friction actions rather than long interactive sessions.
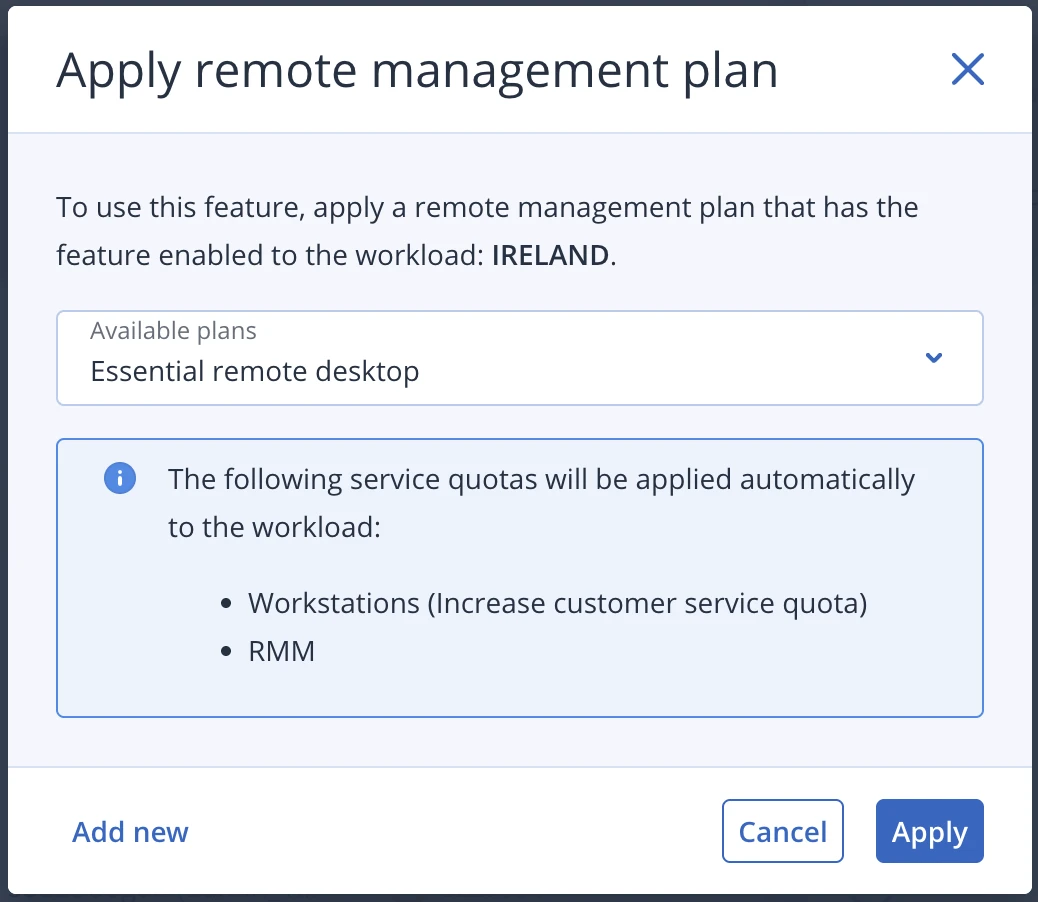
When entering the Chat section for the first time, the system prompts to apply a remote management plan. Without an active plan, chat functionality is not available. After using the required plan, the chat interface becomes active.
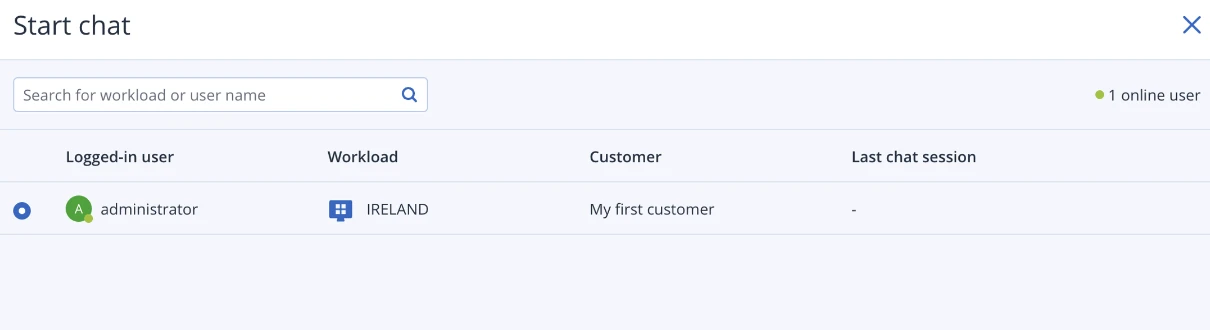
The initial chat screen shows a list of users currently logged in to the selected machine. In this case, the server had a single active administrator session, which appeared immediately in the list. In workstation scenarios, this list would include multiple users if several sessions were active at the same time.
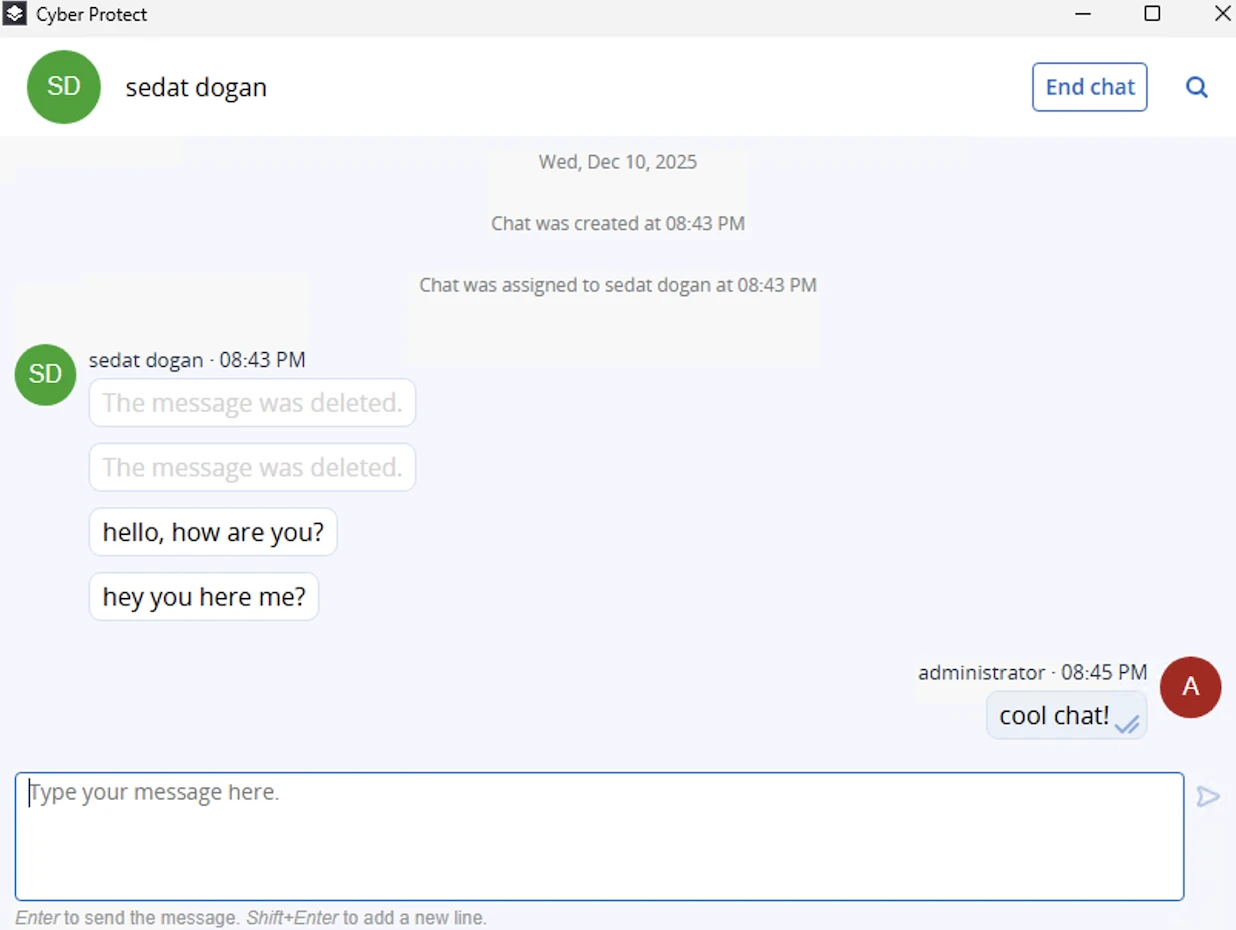
Starting a chat does not require a remote desktop connection. Messages sent from the Acronis console are delivered instantly to the machine as system notifications. On the Windows side, the message appears in the lower-right corner of the screen, similar to a native system alert.
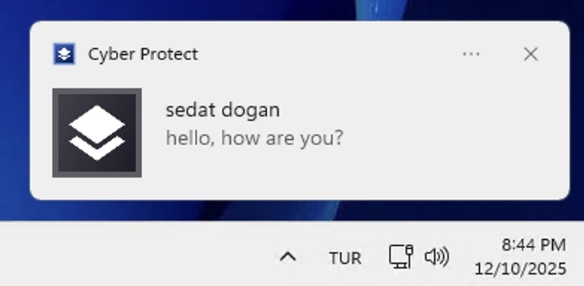
Clicking the server notification opens a dedicated chat window. This window allows real-time messaging between the technician and the user logged into the device. The experience feels closer to a messaging app than a support overlay.
This is a notable difference from NinjaOne. In NinjaOne, chat is tied to an active remote control session. In Acronis, chat works independently, allowing communication with users without taking control of the machine.
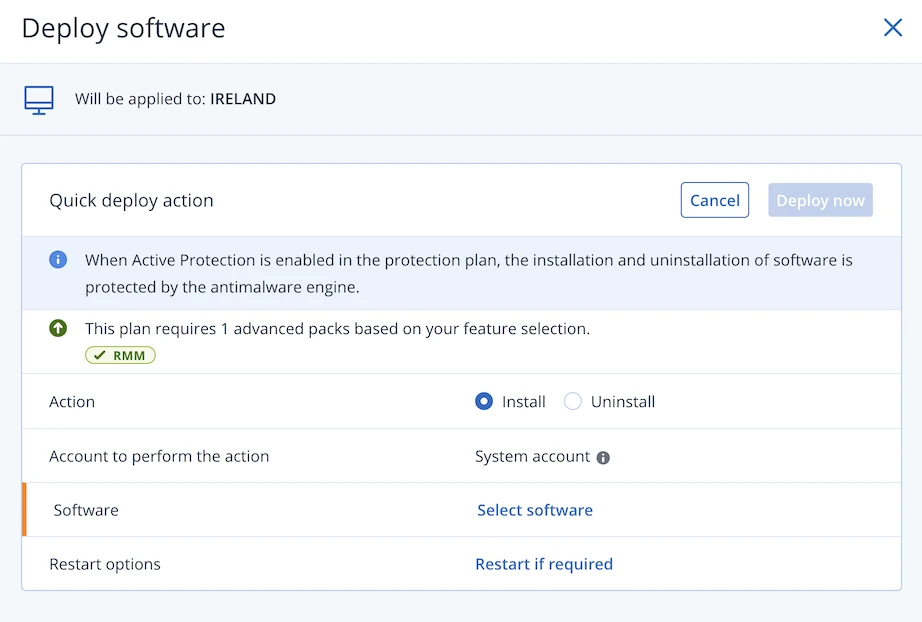
Opening Deploy software launches a side panel where software installation tasks are defined.
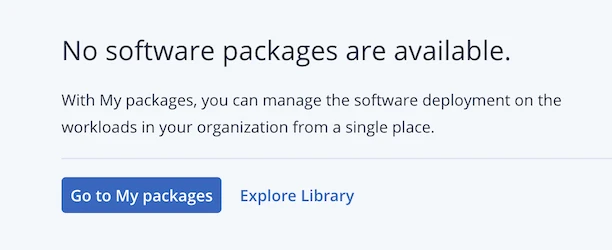
At first, no software packages are available. The interface directs the user to either upload custom packages or explore the built-in software library.
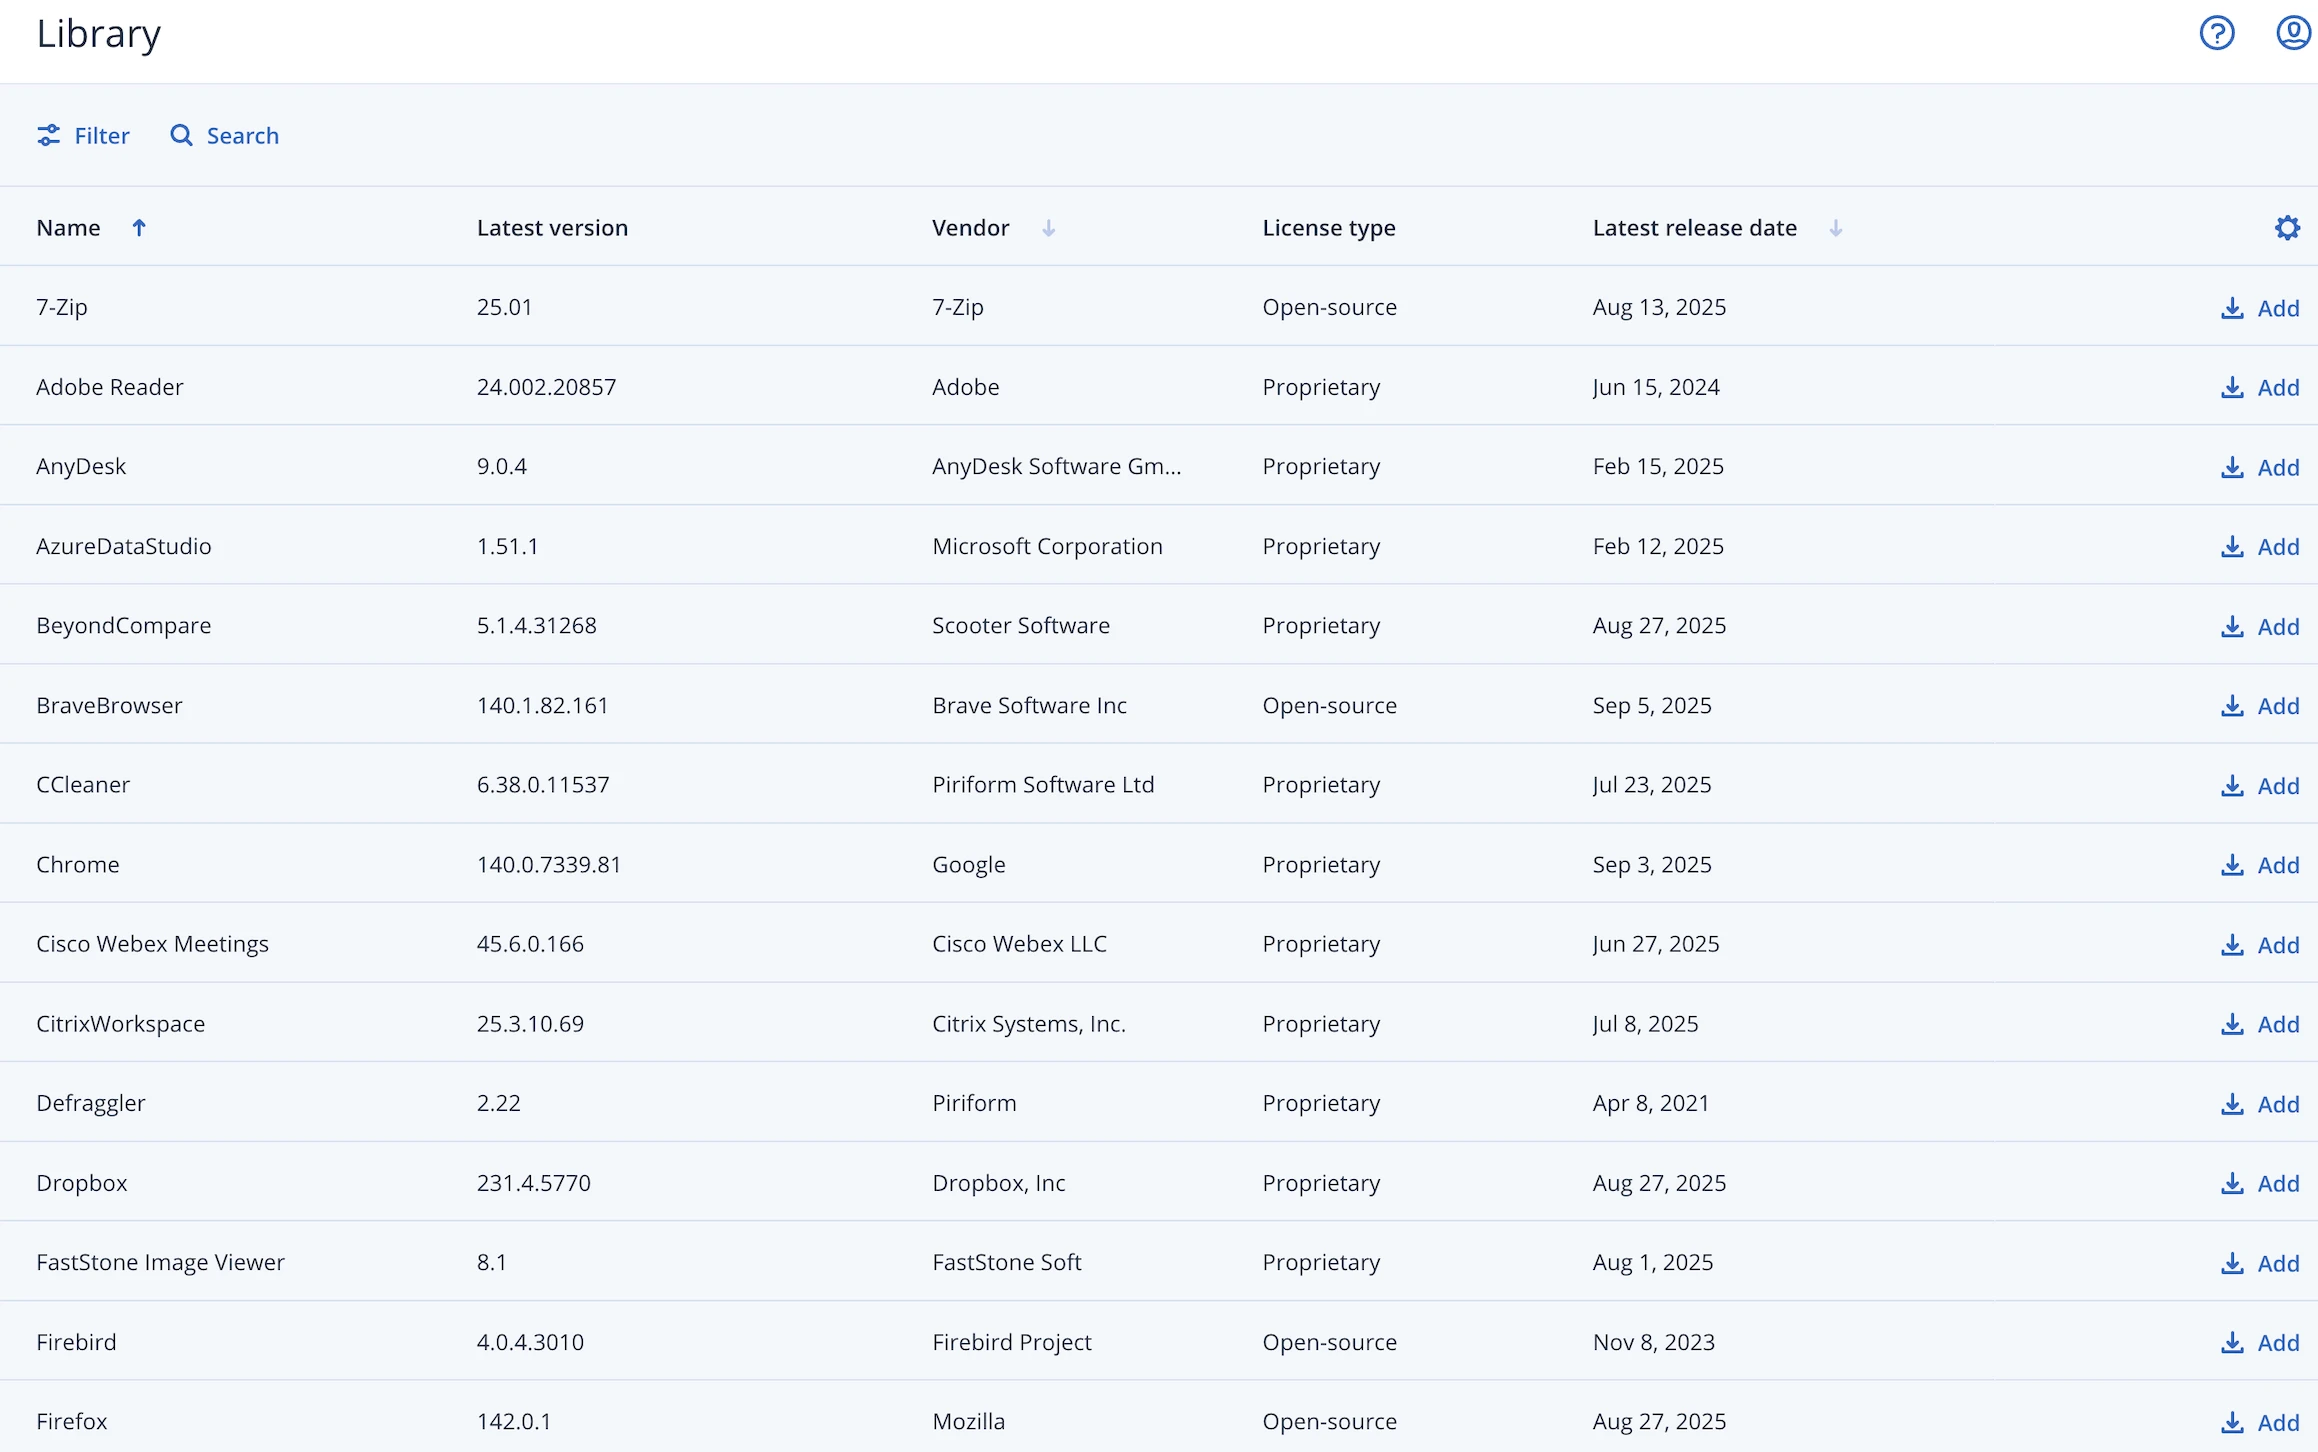
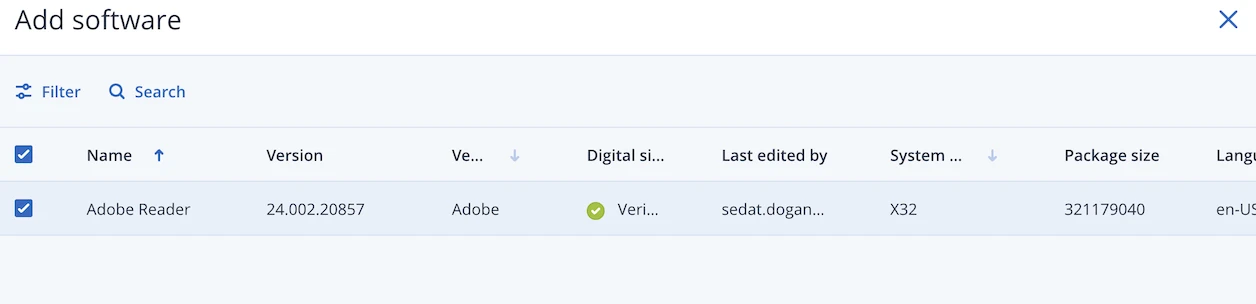
Choosing to explore the library opens a full software catalog. This catalog includes a wide range of prepackaged applications, both open-source and proprietary. Each entry shows the software name, vendor, version, license type, and release date.
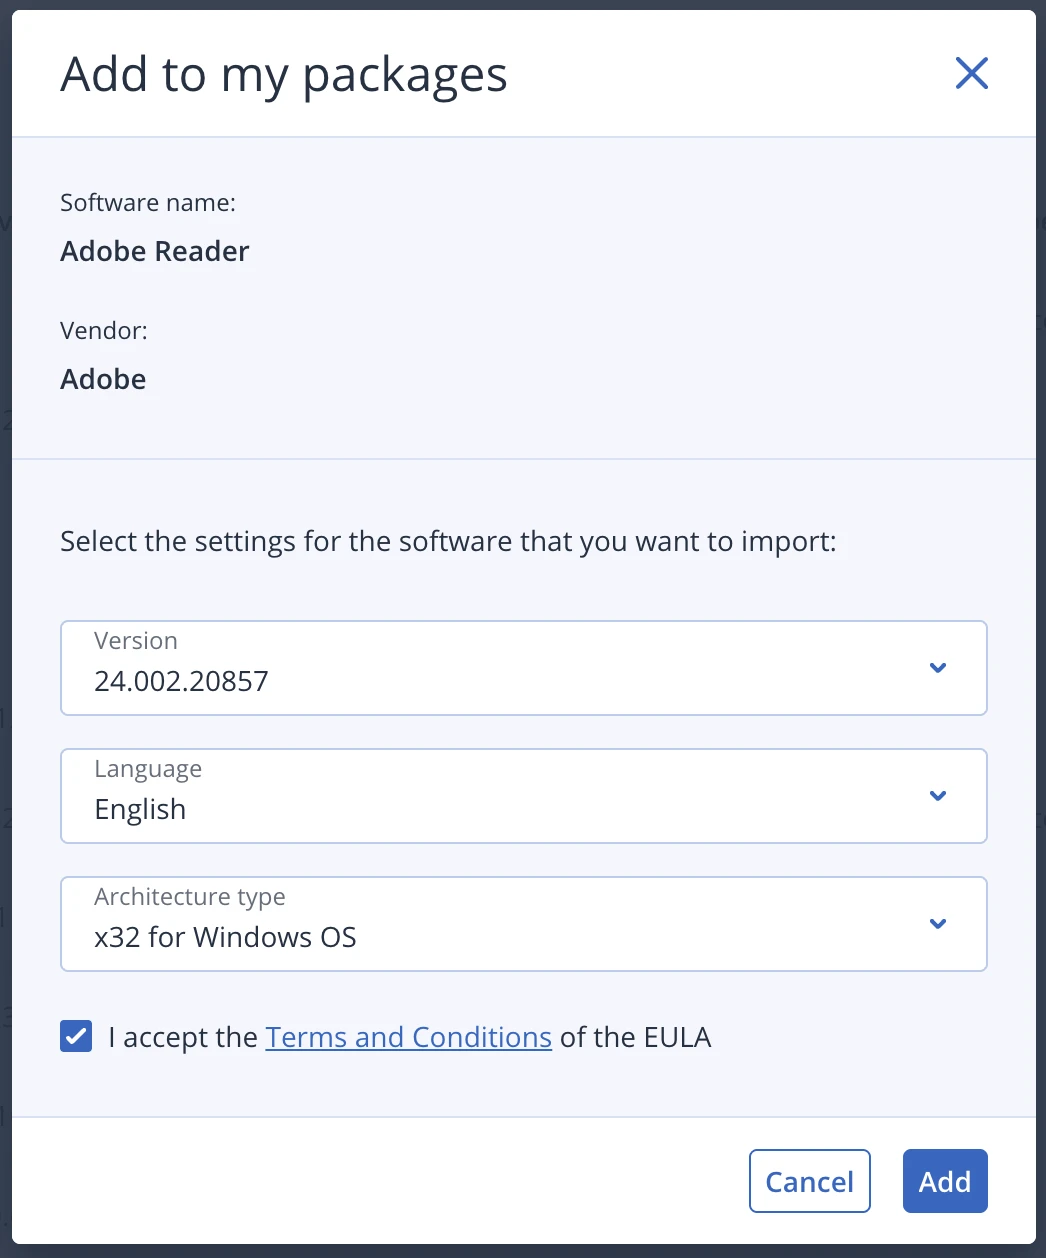
Selecting an application such as Adobe Reader opens a configuration screen. From there, you can choose the exact version, language, and system architecture before adding the package.
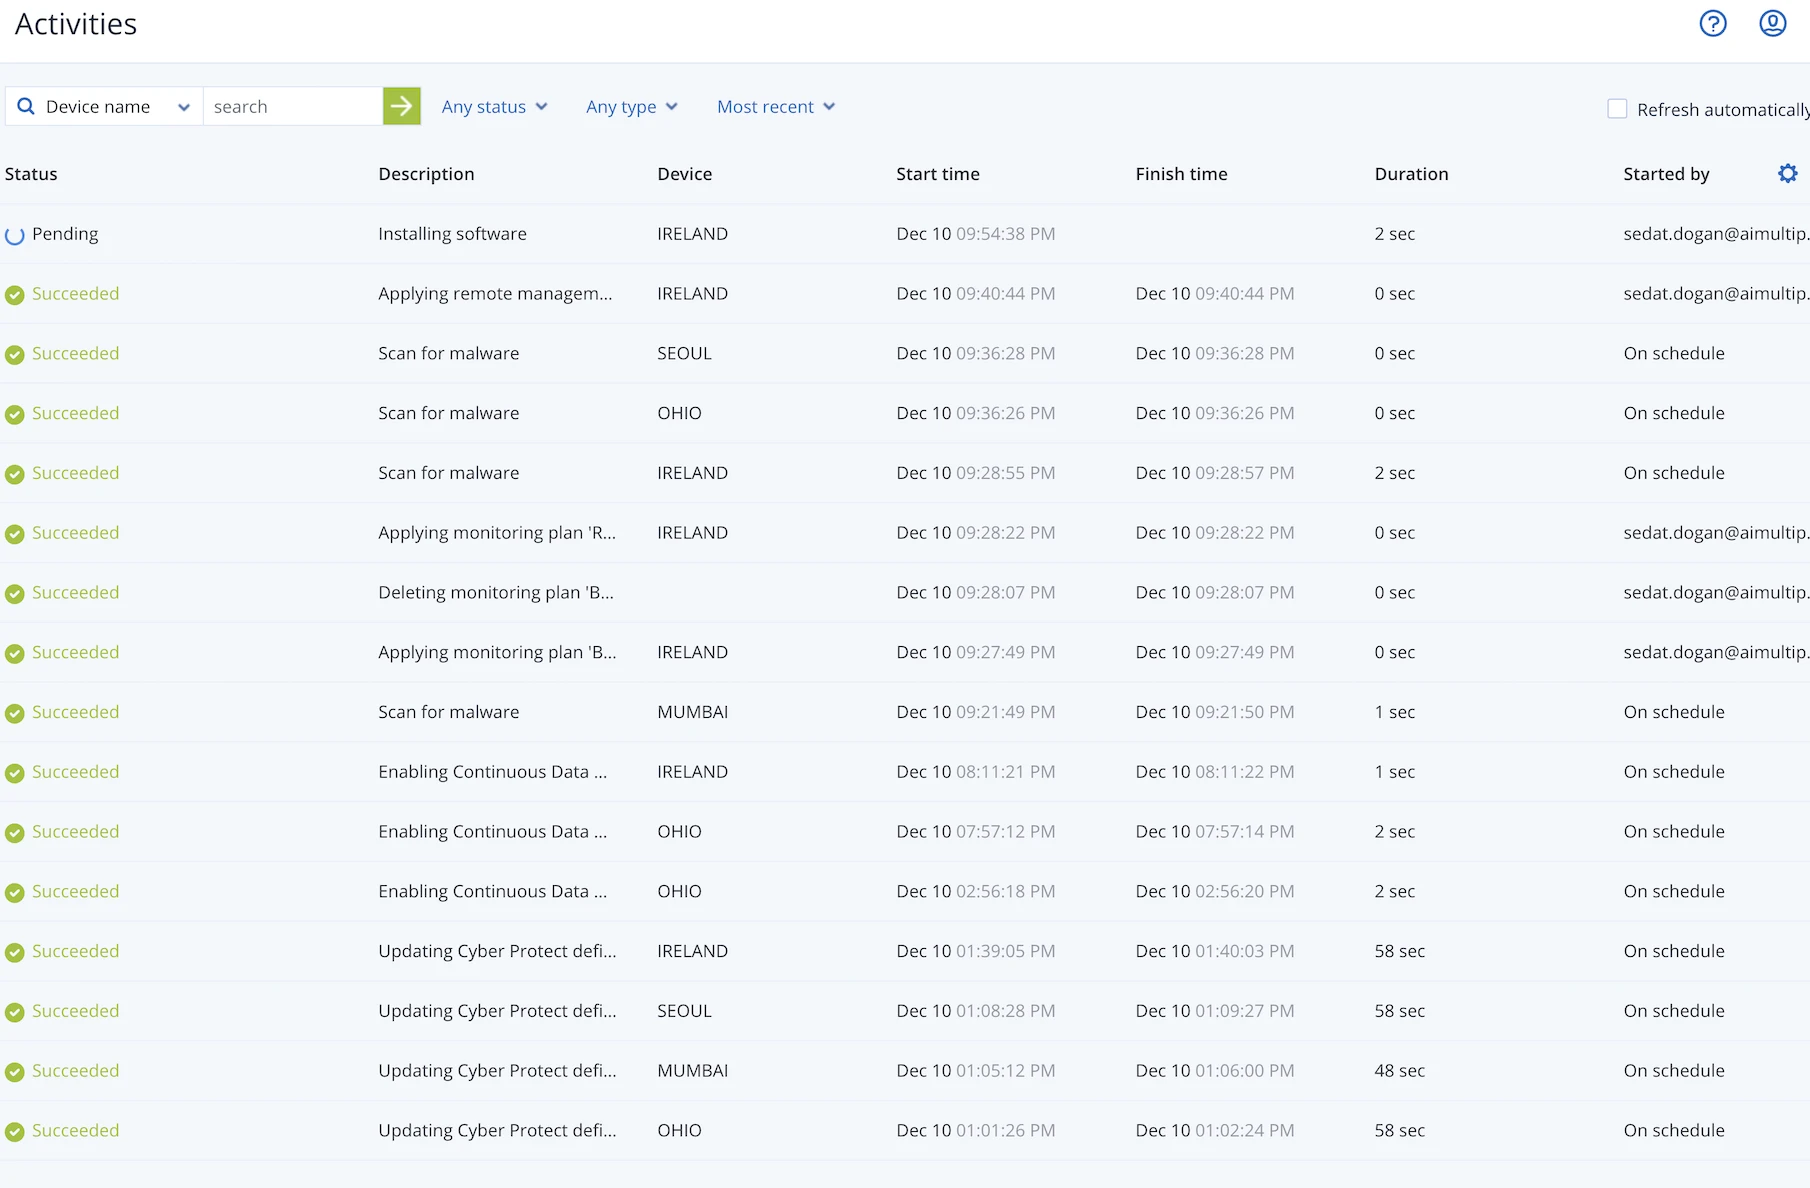
Once added, the software becomes available for deployment. The process does not require manual installers or scripting. After the deployment starts, progress appears in the Activities section.
In this test, Adobe Reader was installed on the server in just over two minutes. The start and finish times were logged clearly, and the application appeared on the desktop immediately after completion. The installation ran silently and did not interrupt the active user session.
This software deployment workflow is significantly more complete than what is available in NinjaOne, mainly due to the built-in library and version-level control.
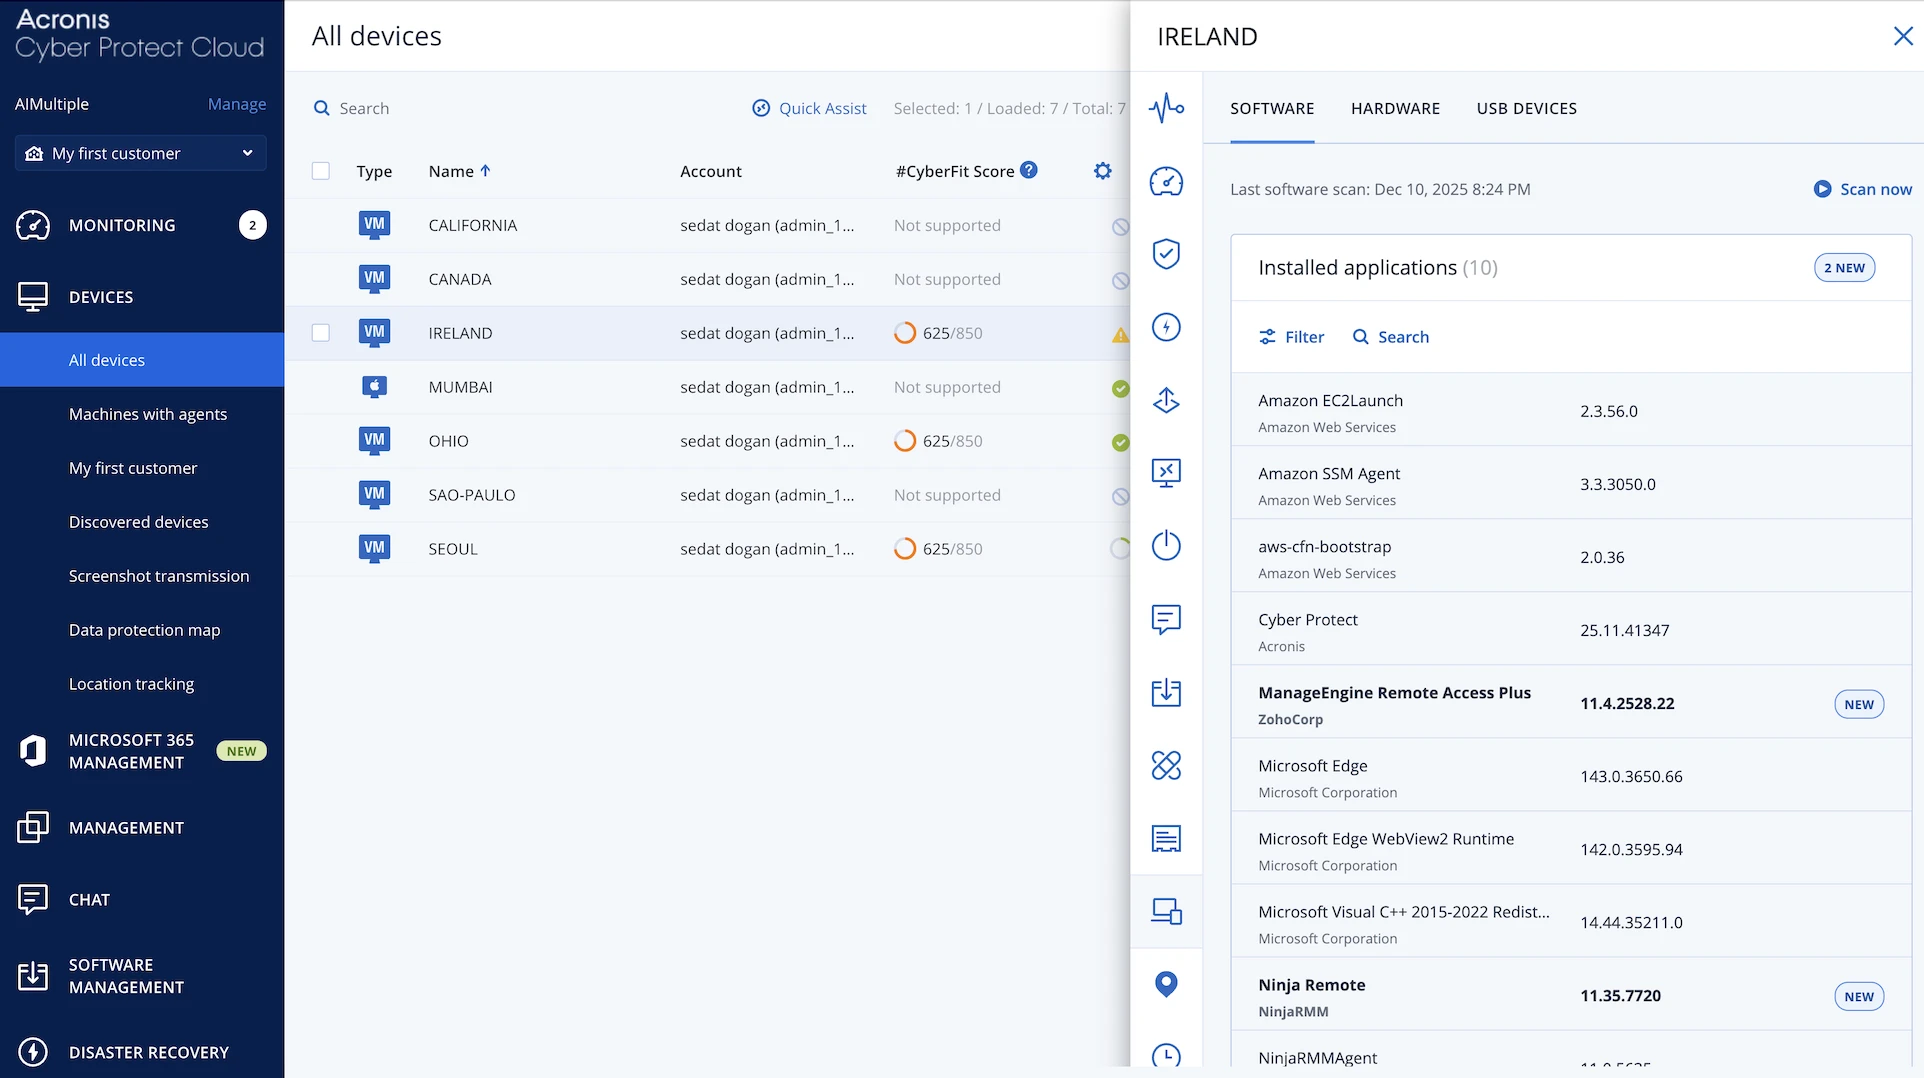
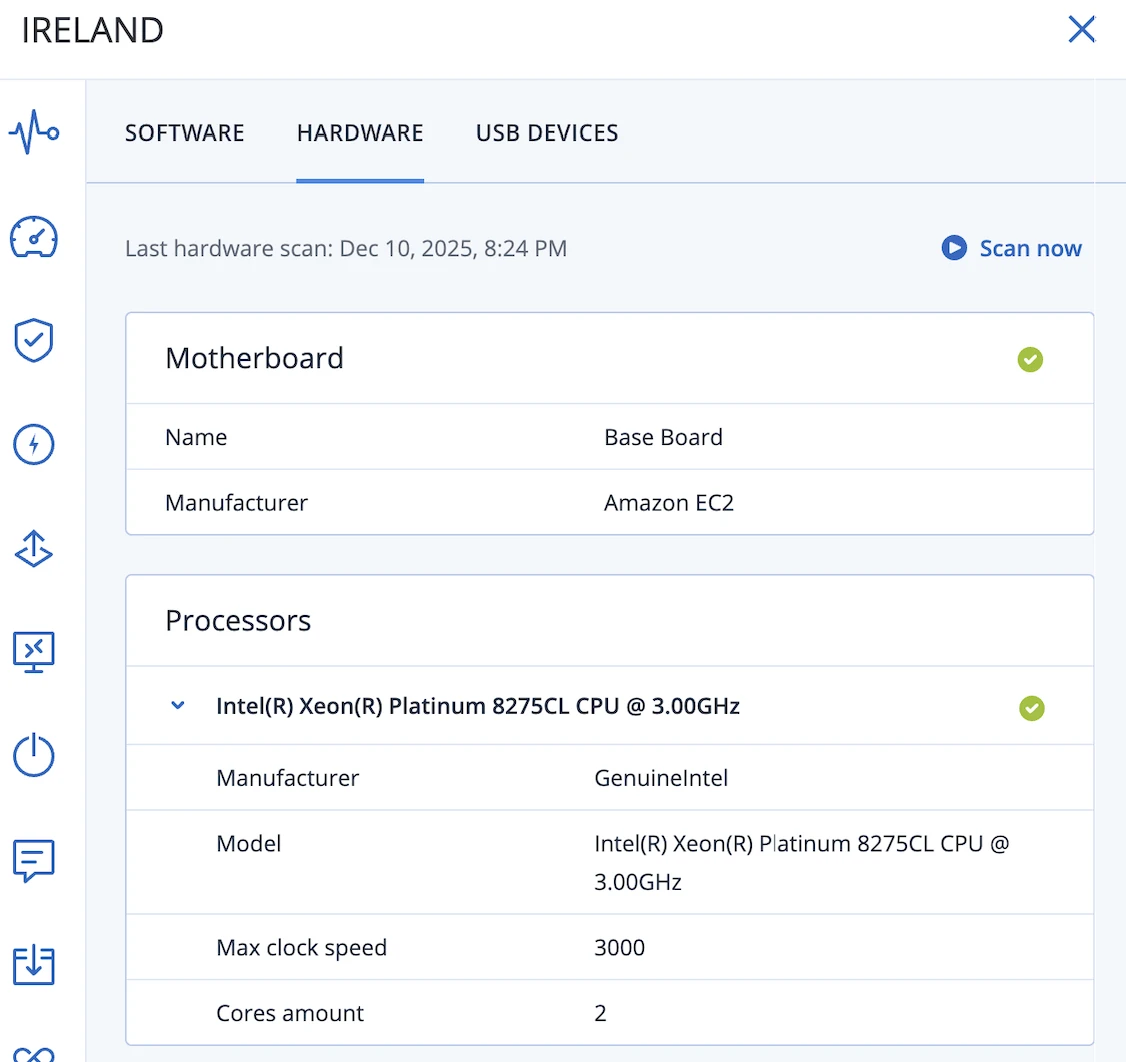
Returning to the server details and opening the Inventory tab provides access to the system’s complete inventory. The information is split into software, hardware, and USB-connected devices.
The software section lists installed programs in detail, including names and versions. Hardware information goes beyond basic specs and includes the motherboard, processor, memory, storage, network adapters, and system-level details.
USB devices are shown separately, making it clear whether any external peripherals are connected.
The inventory is not static. Using the Scan now option triggers a new scan that updates all inventory data manually instead of waiting for a scheduled refresh.
Compared to NinjaOne, the level of detail here is noticeably higher, especially for installed software and hardware components.
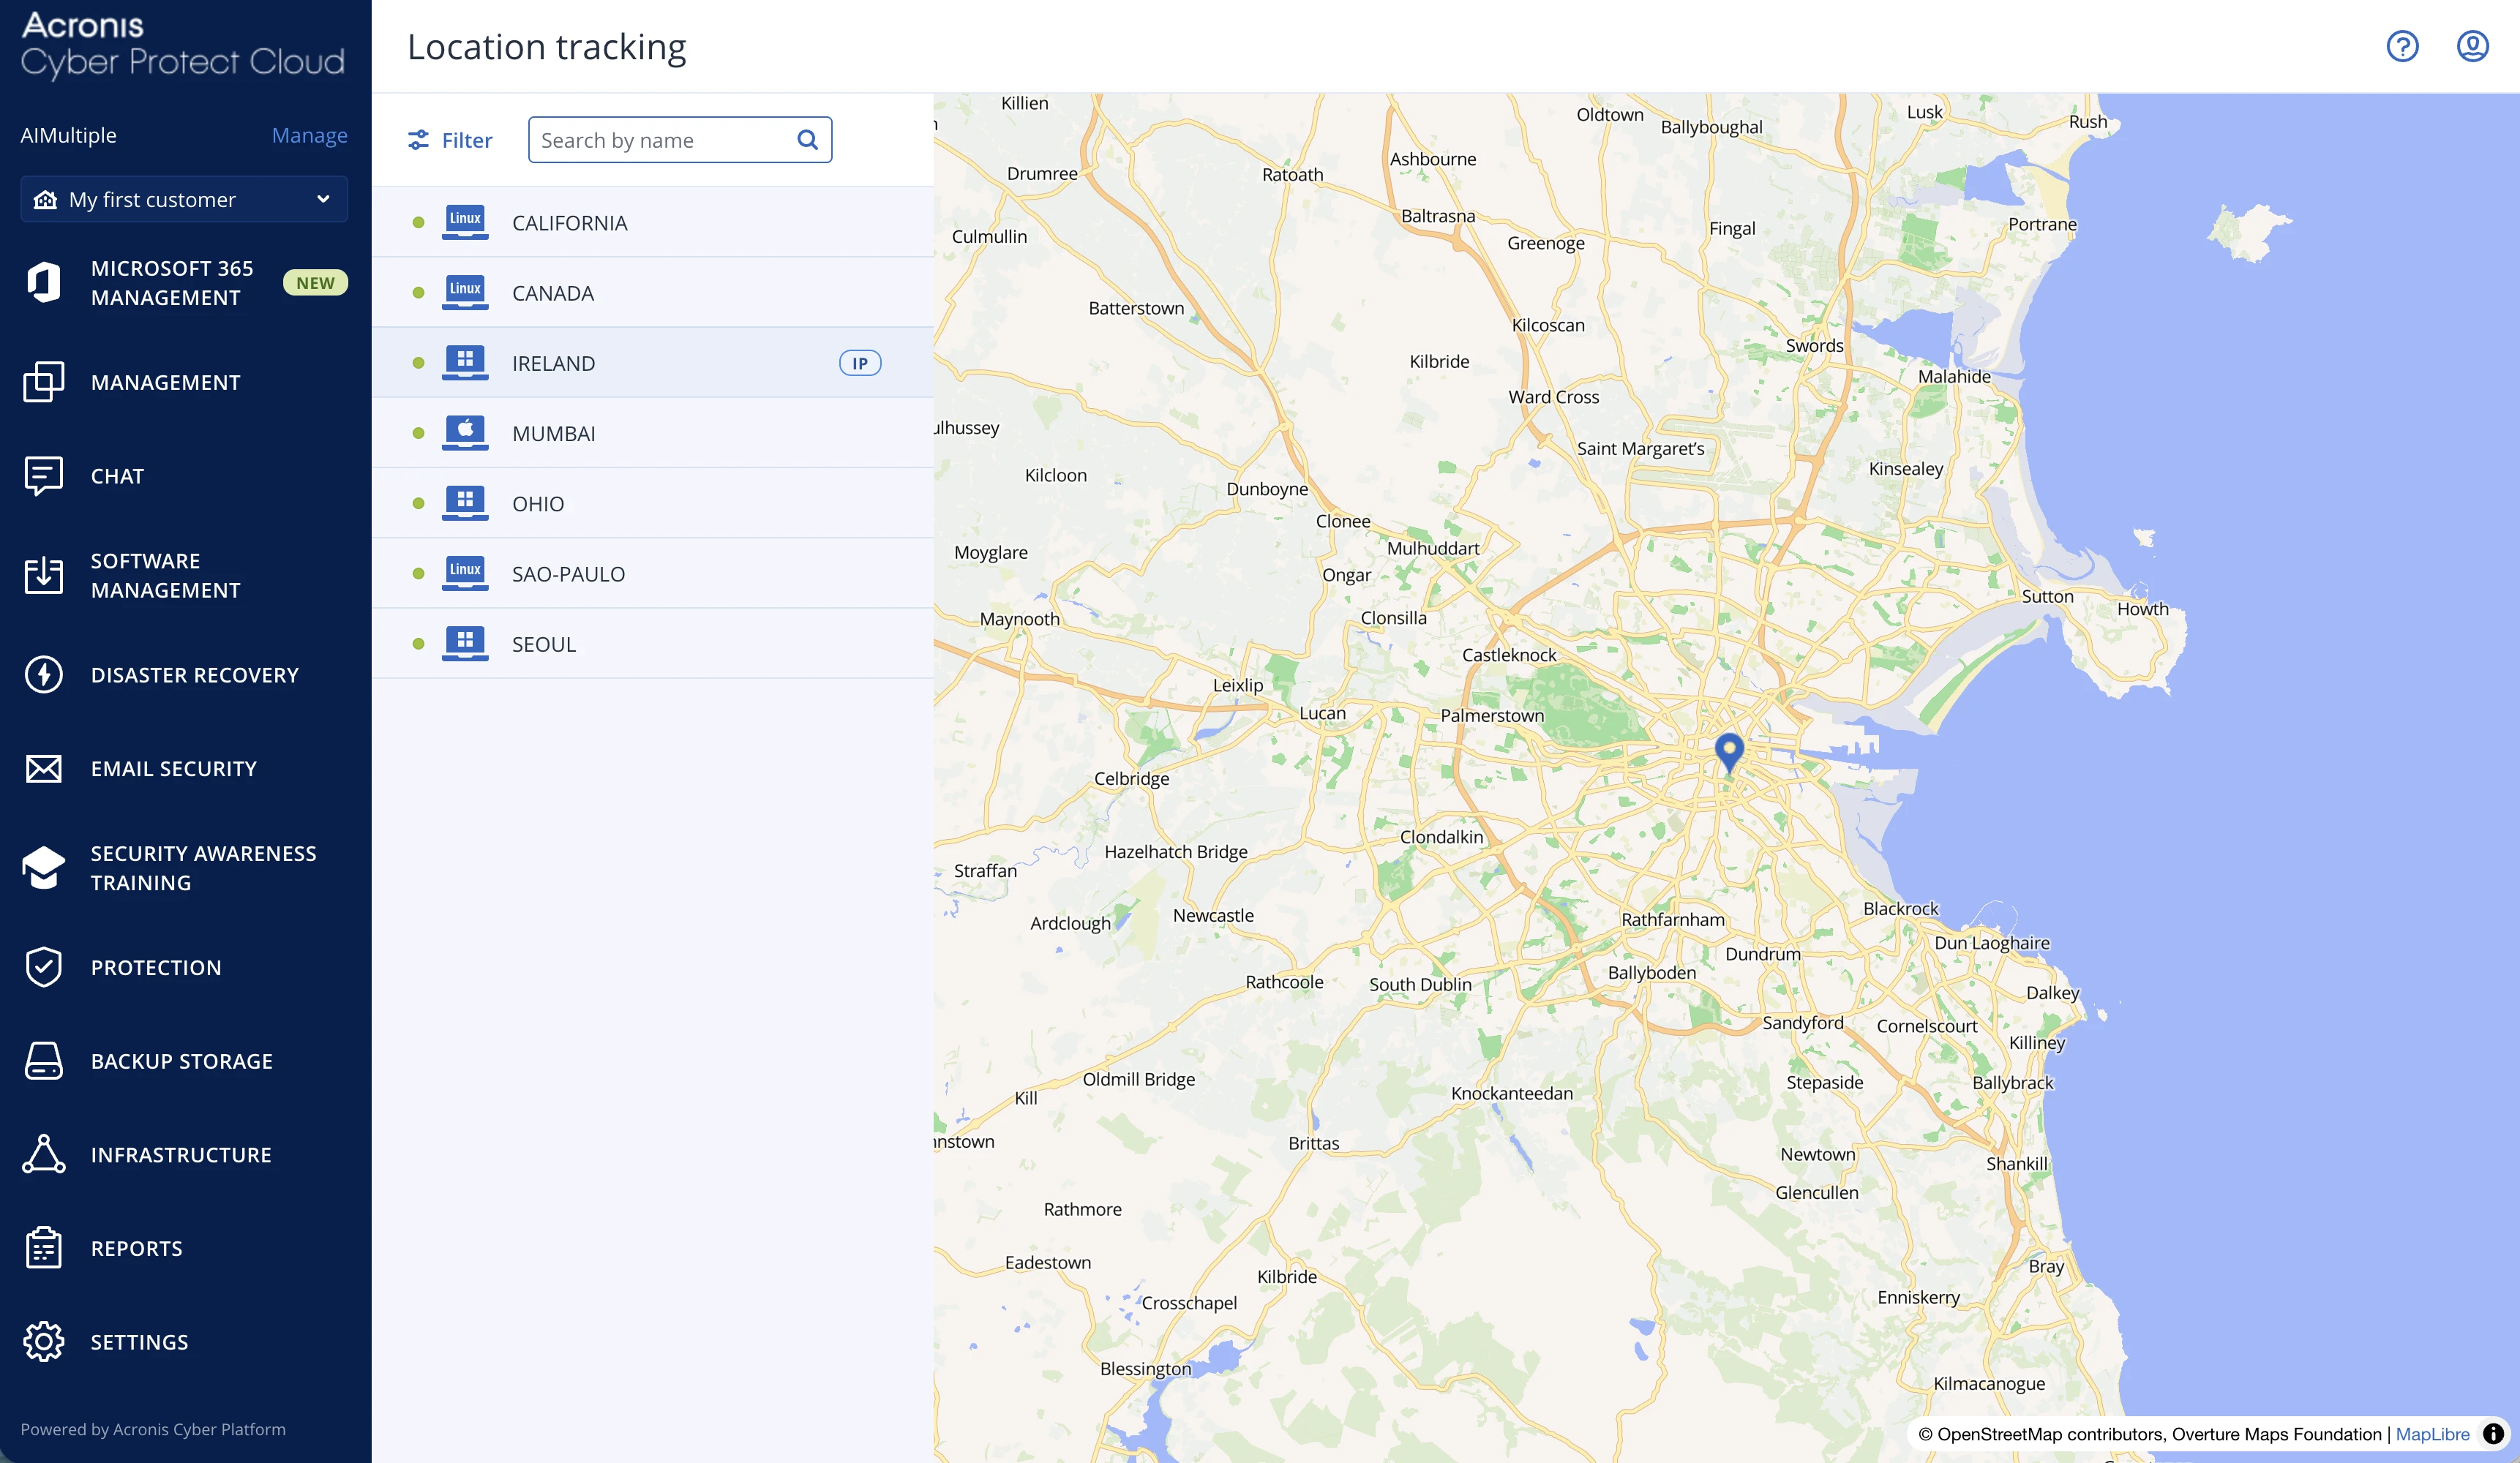
Opening the See on map tab displays the server’s physical location on a map. The view also includes location history and movement when available.
This feature is especially relevant for employee laptops and mobile devices, where location changes matter. The experience feels similar to Apple’s “Find My” feature. This type of location tracking is not something I encountered in NinjaOne, and it adds a different layer of visibility for distributed or remote devices.
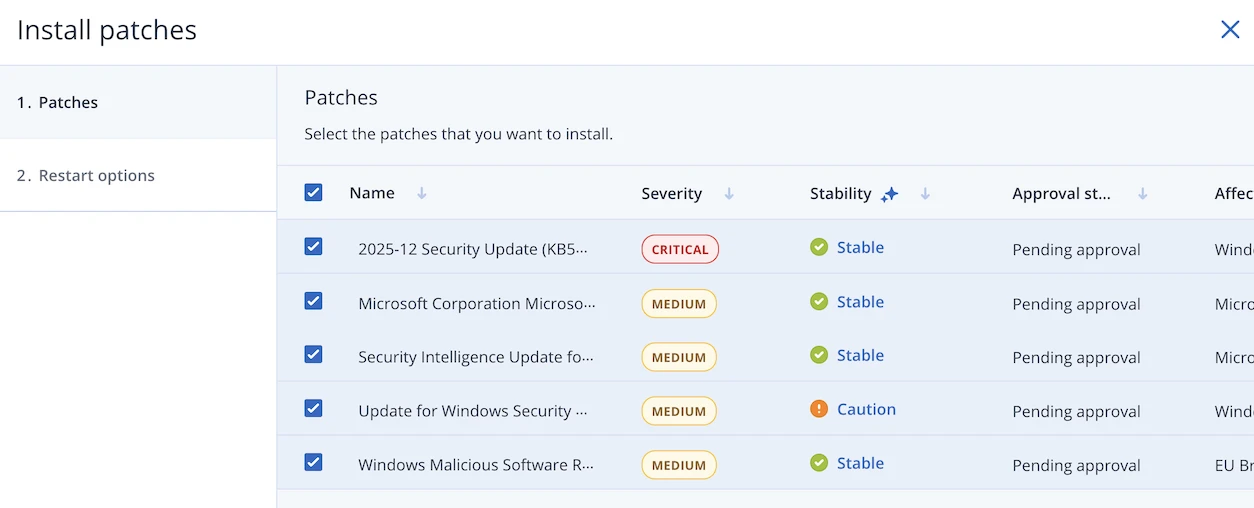
When entering the Patches tab, a large list of available patches appears immediately. None of these patches were visible or manageable from NinjaOne in the same environment.
Each patch entry shows its severity level, which makes prioritization easier. The platform also displays a stability indicator for each patch, helping differentiate between safer updates and those that may require caution.
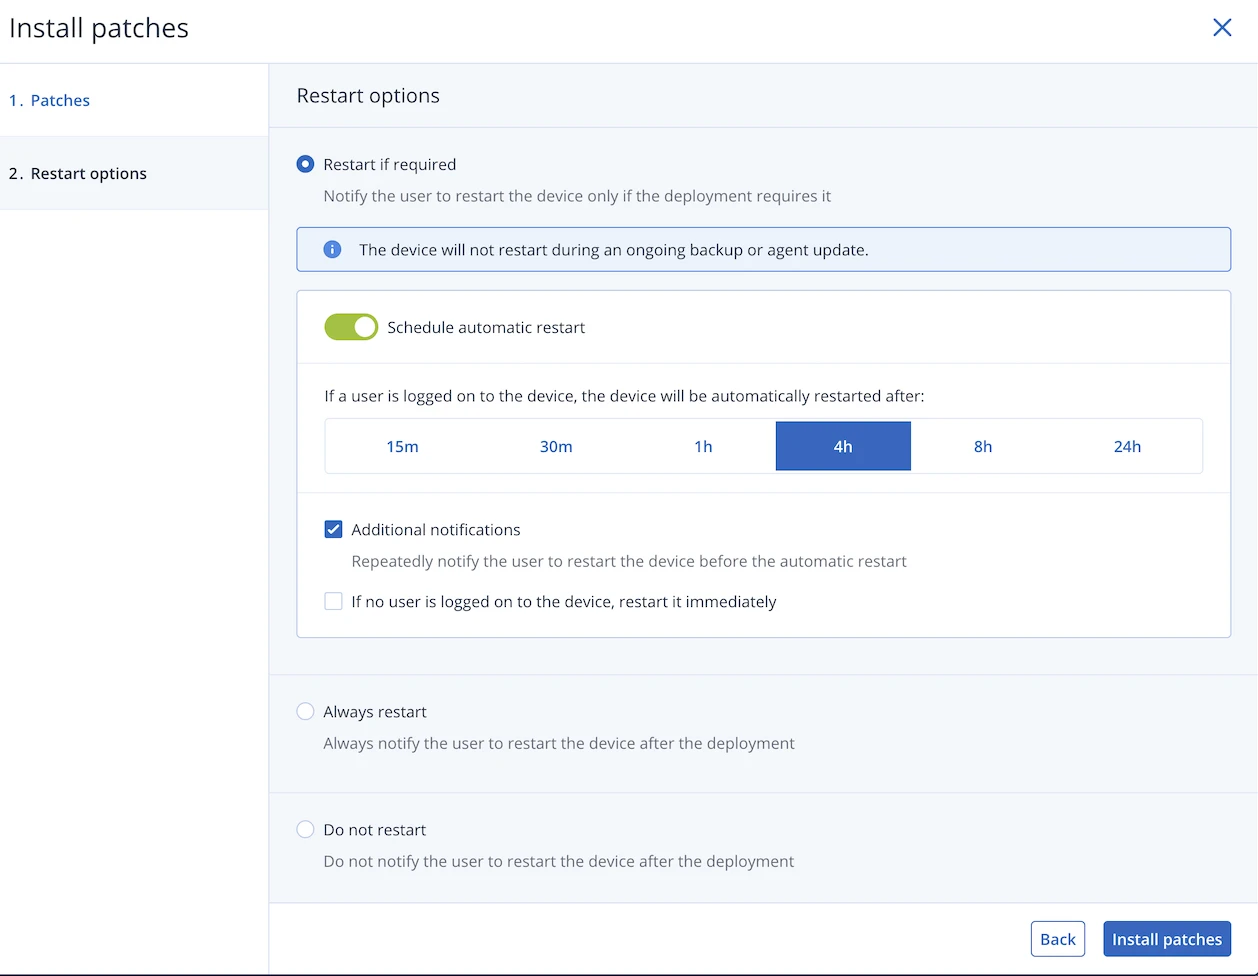
After selecting patches, moving to the Restart options step allows full control over what happens once patch installation finishes. It is possible to install all patches and only restart the system if required. Restart timing can be delayed, scheduled, or skipped entirely, depending on whether a user is logged in.
Opening the Details tab shows a consolidated summary of the device. This includes system identifiers, operating system information, agent version, installed components, and network details.
One limitation stands out here. The IP address shown is the local IP address only. For cloud-based servers, it would be more useful to display both local and public IP addresses. Having only the internal address makes external identification harder.
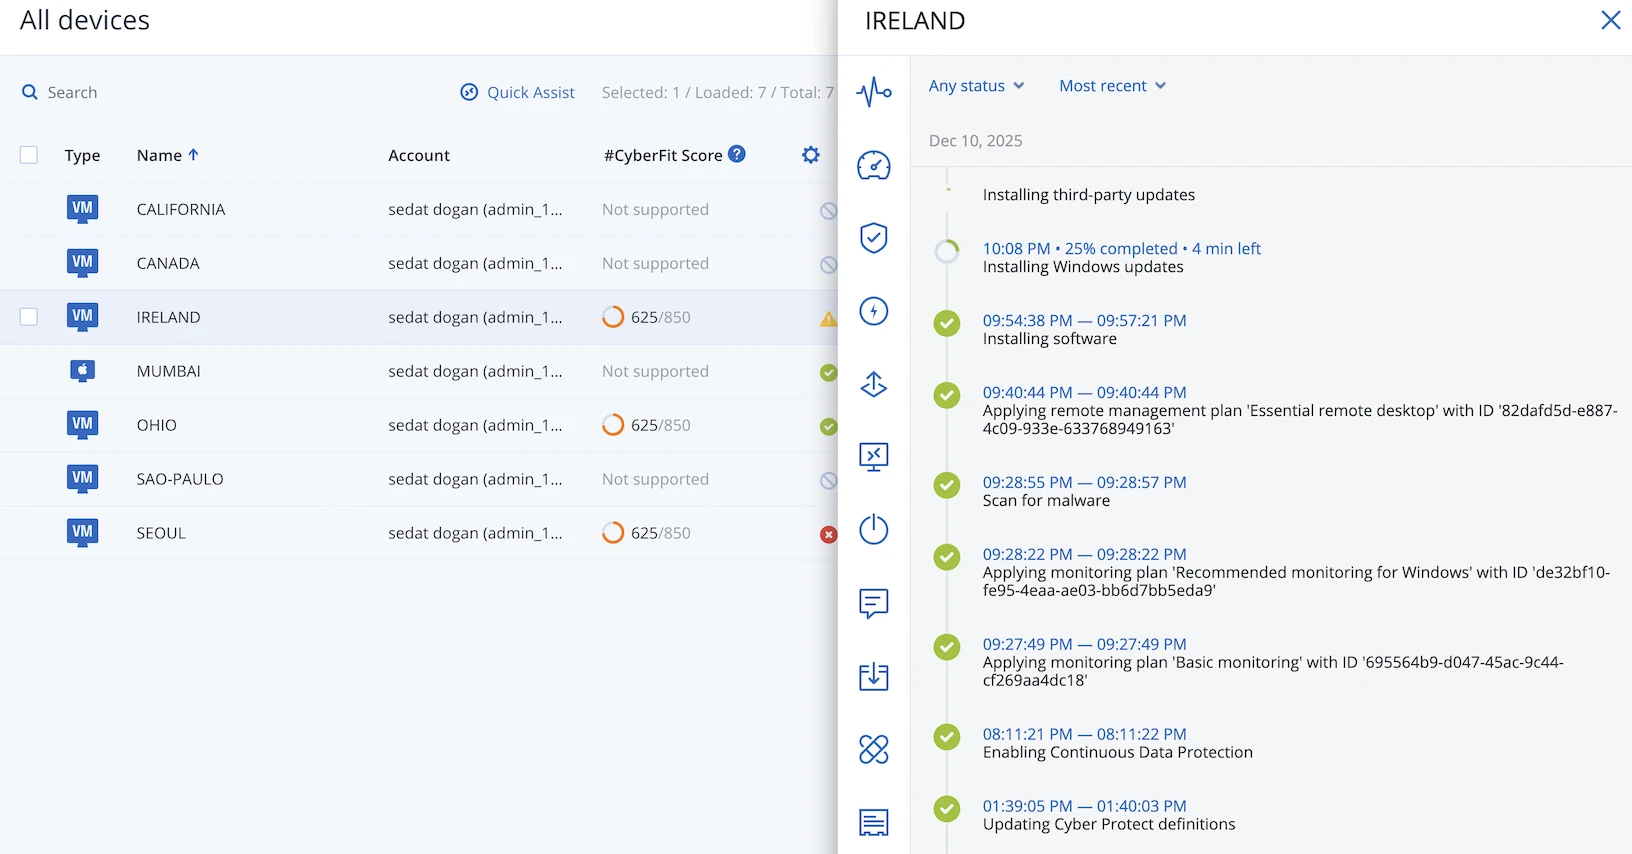
The Activities tab lists a complete timeline of actions performed on the server. This includes monitoring plan changes, software deployments, scans, patch installations, and other system operations.
Each entry includes timestamps and status information, making it easy to understand what happened and when. This acts as a full audit trail for the device.
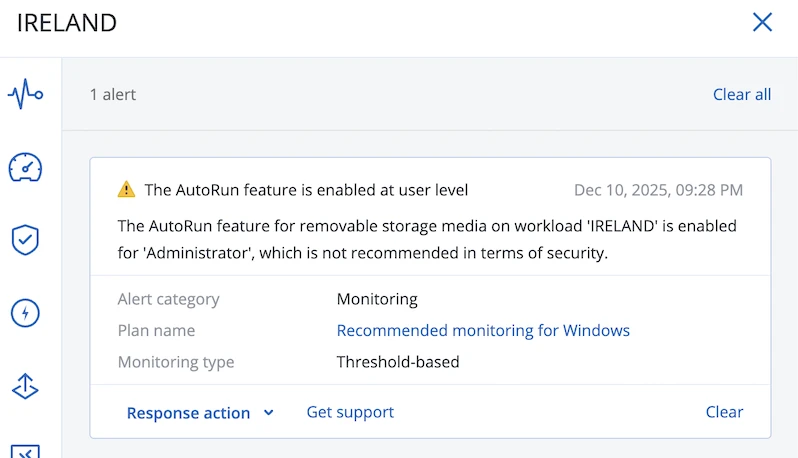
Opening the Alerts tab reveals a security recommendation to disable Windows AutoRun for removable media. The alert explains why this is a security risk and suggests disabling it.
What stands out here is the Response action menu. Instead of only showing a warning, the platform offers multiple ways to respond. It is possible to connect to the machine, run a script, open a command line session, or directly disable the AutoRun feature from the alert itself.
In this case, selecting the option to disable AutoRun resolved the alert immediately. The action was logged, and the warning was cleared. This turns alerts from passive notifications into actionable tasks, which is a clear strength.
The Add to group option allows you to assign the server to one or more groups. Grouping becomes essential later when performing bulk actions, such as patching or running scripts across multiple devices.
The Delete option removes the device from the platform entirely. This is a direct device-level action rather than an account-wide operation.
Returning to the Monitoring tab after setup shows that performance data is now available. CPU, memory, disk activity, and transfer rates are displayed as live charts.
This confirms that monitoring only starts after a plan is applied, but once active, metrics are collected and visualized without further configuration.
Test Environment and Methodology
We provisioned 7 EC2 instances across 6 AWS regions to represent a distributed corporate environment.
Mac instances require dedicated hardware with a 24-hour minimum allocation. We included macOS despite the higher cost because many IT environments manage mixed operating system fleets.
Agent Installation: We measured the time from executing the installer to the device appearing in the dashboard. For silent installers, we noted whether they provided completion feedback. We tracked:
- Installation duration (seconds)
- Required steps (clicks, commands, manual configuration)
- Post-install notifications
- Installer reusability across multiple devices
- Documentation clarity
Dashboard & Monitoring We evaluated information density and usability of device detail pages. We tested:
- Real-time metrics (CPU, Memory, Disk, Network)
- Time-frame options for historical data
- Terminal access types (CMD, PowerShell, Bash, root)
- Process management (viewing, stopping, priority changes)
- File browser capabilities (upload, download, delete, rename)
- Service management (start, stop, modify startup settings)
- Activity logging detail
- Open ports visibility
- Software inventory
- Registry editor (Windows only)
Results reflect our specific AWS infrastructure. Performance may vary based on geography, internet provider, and vendor data center locations.
What does RMM software do?
RMM software lets IT teams and MSPs remotely track and manipulate system objects such as servers, networks, clients, applications, workstations, and peripheral devices in accordance with needs, requirements, and developments. Thanks to developments in artificial intelligence and machine learning, most tasks can be completed by automated tools.
Figure 3. The graphic summarizes the definition of managed service providers (MSPs)
Source: InfoMSP
What are RMM software capabilities?
The functional components of the RMM system are called RMM tools. General definitions of common RMM tools are listed below.
1. Remote monitoring
Servers, workstations, networks, apps, and other devices in an organization’s IT environment are all continuously monitored by RMM software. It gathers information on network traffic, system health indicators, resource usage, log reports, and performance measurements.
2. Remote management
Enabling the remote management and troubleshooting of IT systems and devices by administrators, including the installation of settings, scripts, patches, and software upgrades.
3. Security management
Providing security capabilities to guard against malware, cyberthreats, and security breaches, such as antivirus management, intrusion detection, and vulnerability screening.
4. Reporting and analytics
Creating analytics and reports to offer information on security posture, compliance status, system performance, and other important parameters.
5. Alerting and notifications
Producing messages and alerts in response to important events, like system malfunctions, declining system performance, security lapses, or other thresholds that have been set.
6. Patch management
Automating the process of updating and patching firmware, operating systems, and software on a variety of devices.
7. Back-up and incident management
Assisting in the backup and recovery processes for disaster recovery and data protection; frequently includes settings for off-site storage, recovery point objectives (RPOs), and recovery time targets (RTOs).
8. Asset management
Enabling the tracking of hardware and software assets, along with information on licenses, warranties, serial numbers, and device specs, through inventory management tools.
Industry Trends in RMM Software
The RMM software market is experiencing a significant transformation in 2026, driven by several key trends:
1. AI and Autonomous Operations
AI-powered automation and agentic reasoning are becoming central to RMM platforms. Atera’s IT Autopilot and AI Copilot, along with Kaseya’s Digital Workforce, represent a shift from traditional scripted automation to intelligent agents that can think, assess, and act independently.
2. Unified Cybersecurity Platforms
The industry is moving away from point solutions toward integrated platforms that combine RMM, EDR, XDR, backup, and disaster recovery. Acronis and Kaseya are leading this trend with unified cyber protection platforms that reduce vendor sprawl and operational complexity.12
3. Flexible Pricing Models
MSPs are demanding pricing transparency and flexibility. Kaseya’s elimination of High Watermark pricing in favor of consumption-based models reflects broader industry pressure to align costs with actual usage rather than peak capacity.13
4. Multi-OS Support Expansion
RMM platforms are expanding beyond Windows-centric solutions to support the latest macOS (including macOS 26 Tahoe) and Linux distributions, addressing the growing need for heterogeneous endpoint management in enterprise environments.14
FAQs
Unified endpoint management is a network security product that aims to protect endpoints, including IoT devices and peripheral devices, by enabling IT teams to embed a cloud-based unified platform with tools that ensure data loss prevention, endpoint security, and compliance with regulatory requirements.
RMM software components keep business devices secure and efficient, thanks to features like patch management.
Remote monitoring and management deliver managed service providers (MSPs) software tools to keep the client’s network system secure and functioning properly. These tools include remote monitoring and management, security measures against data exchange between endpoints, mobile device management, ticket management, patch management, automation, and configuration.
Though UEM and RMM are different in terms of their focus points, endpoint vs. client network, they offer common tools such as endpoint management and security, patch management, mobile device management, and remote monitoring and management.
Further reading
Cite this research
Pick the format that matches where you're publishing. Pasting the link version into your CMS preserves the backlink.
@misc{dilmegani2026,
  author = {Dilmegani, Cem and Dogan, Sedat and Sezer, Sena},
  title  = {{Top 12 RMM Software Tested: Features and Pricing}},
  year   = {2026},
  month  = jul,
  howpublished    = {\url{https://aimultiple.com/rmm-software}},
  note   = {AIMultiple. Retrieved July 8, 2026}
}
Reference Links
Cem's work has been cited by leading global publications including Business Insider, Forbes, Washington Post, global firms like Deloitte, HPE and NGOs like World Economic Forum and supranational organizations like European Commission. You can see more reputable companies and resources that referenced AIMultiple.
Throughout his career, Cem served as a tech consultant, tech buyer and tech entrepreneur. He advised enterprises on their technology decisions at McKinsey & Company and Altman Solon for more than a decade. He also published a McKinsey report on digitalization.
He led technology strategy and procurement of a telco while reporting to the CEO. He has also led commercial growth of deep tech company Hypatos that reached a 7 digit annual recurring revenue and a 9 digit valuation from 0 within 2 years. Cem's work in Hypatos was covered by leading technology publications like TechCrunch and Business Insider.
Cem regularly speaks at international technology conferences. He graduated from Bogazici University as a computer engineer and holds an MBA from Columbia Business School.


Be the first to comment
Your email address will not be published. All fields are required. Comments are left in their original language.