


Top 8 softwares de monitoramento de rede

Comparamos as 8 principais ferramentas de monitoramento de rede quanto a desempenho, facilidade de configuração e usabilidade no mundo real.
Os 8 principais softwares de monitoramento de rede comparados
A tabela é classificada com base no número de avaliações. Listamos nossos assinantes no topo.
Critérios de seleção de fornecedores: Restringimos nossa comparação de softwares de monitoramento de rede usando três fatores principais:
- Estabilidade da empresa: Fornecedores com 15 ou mais funcionários
- Validação do usuário: Soluções com avaliações de usuários do G2, Capterra e TrustRadius
- Padrões de desempenho: Avaliação média mínima de 4.4/5 nas plataformas de avaliação
- Presença no mercado: Desenvolvimento ativo e atualizações regulares de recursos
Os principais recursos dos softwares de monitoramento de rede
Para definições dos recursos mencionados acima, consulte os recursos compartilhados das ferramentas de monitoramento de rede.
Análise detalhada dos softwares de monitoramento de rede
NinjaOne
NinjaOne combina monitoramento de rede com ferramentas de gerenciamento remoto. Os usuários podem monitorar o desempenho, aplicar patches nos sistemas e gerenciar backups em um só lugar.
O monitoramento de rede do NinjaOne é um módulo baseado em SNMP integrado ao mesmo console de suas ferramentas de RMM e patch. Um assistente de descoberta varre um intervalo de IP específico e autoidentifica roteadores, switches, firewalls e impressoras com SNMP habilitado. Em seguida, ele os consulta quanto a tempo de atividade, carga de CPU e memória, throughput de largura de banda e erros de interface em tempo real, com mais de 50 modelos OID pré-construídos para hardware comum e suporte a OIDs personalizados.
Os dados de NetFlow e syslog chegam ao mesmo painel, de modo que um pico de largura de banda e um dispositivo gerando erros aparecem lado a lado, em vez de em ferramentas separadas.
A contrapartida para compradores que avaliam plataformas dedicadas de monitoramento de rede: a cobertura depende inteiramente do suporte a SNMP, a qualidade varia conforme o fornecedor do dispositivo e o próprio NinjaOne recomenda verificar a compatibilidade antes de confiar nele para hardware de nicho.
SolarWinds NPM
SolarWinds Network Performance Monitor (NPM) usa monitoramento SNMP, descoberta automática e análise de pacotes para acompanhar a integridade da rede.
- Orion Maps: Mapas de rede dinâmicos exibem dispositivos, conexões e métricas de desempenho em tempo real. A visualização é atualizada automaticamente.
- Mapeamento de camadas 2 e 3: Mostra conexões físicas e relacionamentos lógicos de rede. Você pode solucionar problemas no nível em que o problema existe.
- NetPath: Esse recurso exclusivo rastreia o caminho exato que os pacotes percorrem em redes locais, híbridas e em nuvem. Você pode ver o desempenho salto a salto e identificar onde ocorrem atrasos.
- Descoberta automática com alertas: Usa SNMP, WMI e ICMP para localizar dispositivos automaticamente e depois os monitora em busca de problemas. Os alertas são acionados quando os limites são ultrapassados.
Atera
Atera tem como alvo MSPs e departamentos de TI que precisam de monitoramento, ticketing e automação em uma única plataforma. Lida tanto com monitoramento de rede quanto com funções de central de serviços.
- Descoberta contínua: Verifica domínios e subdomínios constantemente, atualizando listas de dispositivos à medida que sua rede evolui. Você não precisa acionar varreduras manualmente ao adicionar equipamentos.
- Varredura de segurança: Identifica portas abertas, patches ausentes e antivírus desatualizados automaticamente. Isso fornece uma lista de verificação de segurança sem executar scanners de vulnerabilidade separados.
- Integração com Active Directory: Monitora dispositivos conectados ao AD e gera relatórios sobre versões do sistema operacional, integridade do dispositivo e conexões de usuários.
- Relatórios visuais: Após cada varredura, você obtém gráficos que mostram os tipos de dispositivos, sistemas operacionais e o status de integridade em toda a rede.
Datadog
Datadog monitora aplicações nativas em nuvem coletando dados de servidores, contêineres, bancos de dados e serviços. Projetado para equipes que executam sistemas distribuídos em vários provedores de nuvem.
- Topologia de rede ao vivo: Mapas interativos mostram toda a sua infraestrutura automaticamente. Identifique gargalos, rastreie dependências e detecte partições de rede visualmente.
- Monitoramento de tráfego de camada 3: Captura fluxos de rede entre hosts, contêineres, VMs e funções serverless. Você vê exatamente como os dados se movem pela sua infraestrutura.
- Filtragem baseada em tags: Em vez de rastrear endereços IP individuais, você agrupa o tráfego por serviço, função, região ou qualquer outra tag. Isso facilita o monitoramento de ambientes de nuvem dinâmicos, onde os IPs mudam constantemente.
- Monitoramento unificado: Métricas de rede, aplicações e infraestrutura ficam na mesma plataforma. Você pode correlacionar problemas em toda a pilha sem alternar entre ferramentas.
LogicMonitor
O LogicMonitor oferece monitoramento de rede baseado em nuvem para ambientes de TI corporativos, híbridos e distribuídos.
- Descoberta automática de dispositivos: Verifica intervalos de IP de acordo com uma programação para localizar roteadores, switches, firewalls e outros dispositivos de rede. Em seguida, o LogicMonitor pode aplicar modelos de monitoramento automaticamente, enquanto a SNMP Active Discovery detecta componentes individuais, como interfaces e recursos de armazenamento.
- Monitoramento SNMP e em tempo real: Coleta CPU, largura de banda, latência, status da interface e outras métricas de desempenho usando SNMP, WMI e APIs, com intervalos de sondagem tão frequentes quanto 30 segundos.
- Mapeamento de topologia: Cria mapas de topologia dinâmicos de camada 3 mostrando relacionamentos e dependências entre recursos de rede.
- Análise de tráfego e alertas inteligentes: Usa dados de fluxo para detalhar o tráfego por origem, destino, aplicativo e protocolo.
Auvik
O Auvik é executado totalmente na nuvem e se concentra no monitoramento de rede em vários locais. Ele mapeia automaticamente a topologia da sua rede e mantém esses mapas atualizados à medida que sua infraestrutura muda.
- Descoberta zero-touch: Implante o coletor e o Auvik encontra tudo usando SNMP, CDP e LLDP. Os mapas de rede aparecem automaticamente — sem criação manual de diagramas.
- Visibilidade multicamada: Veja conexões físicas (Camada 1) e relacionamentos lógicos (Camadas 2/3). Isso ajuda na solução de problemas, pois você pode rastrear problemas em toda a pilha.
- Visualizações personalizáveis: Filtre dispositivos irrelevantes para se concentrar em segmentos de rede específicos. Alterne entre topologia VLAN, visualizações em cluster ou outras perspectivas.
- Documentação pronta para exportação: Gere mapas em PDF ou SVG para documentação ou relatórios de clientes.
Paessler PRTG Network Monitor
O Paessler PRTG Network Monitor monitora toda a sua infraestrutura de TI a partir de um único painel. Ele acompanha servidores, switches, serviços em nuvem e largura de banda ao mesmo tempo.
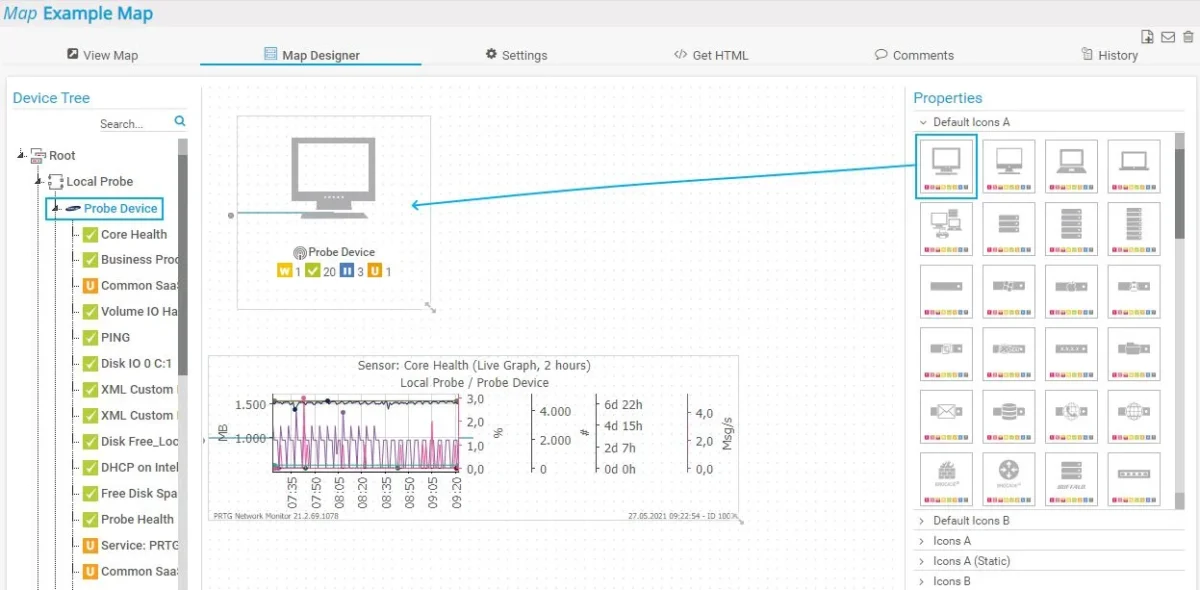
- Mapeamento visual: Arraste os dispositivos para o mapa e veja o status deles mudar em tempo real.
- Monitora qualquer coisa com sensores: Mais de 250 sensores pré-construídos para diferentes dispositivos e protocolos. SNMP, NetFlow, WMI, além de opções personalizadas se você precisar de algo específico.
- Monitoramento nativo em nuvem: Conexões diretas com AWS, Azure e Google Cloud.
- Segurança integrada: Verifica vulnerabilidades e atividades suspeitas como parte do monitoramento normal. Detecta tentativas de intrusão sem adicionar outra ferramenta de segurança.
Site24x7 (ManageEngine)
O Site24x7 monitora sites, servidores, aplicações e infraestrutura de rede a partir da nuvem. Concentra-se em tempo de atividade e desempenho em toda a sua pilha de TI.
- Descoberta automática: Verifica intervalos de IP usando SNMP para localizar dispositivos automaticamente. O mapa de rede é atualizado em tempo real à medida que você adiciona ou remove equipamentos.
- Mapeamento de camada 2 e topologia: Os mapas de camada 2 mostram conexões e interfaces de dispositivos, ajudando você a identificar dispositivos não autorizados. Os mapas de topologia fornecem uma visão hierárquica dos relacionamentos entre dispositivos.
- Visualização de dependências: Mostra como os dispositivos dependem uns dos outros. Ao planejar mudanças, você pode ver quais sistemas podem ser afetados antes de começar.
Recursos compartilhados das ferramentas de monitoramento de rede
 Adicionar como fonte preferencial
Cite esta pesquisa
Escolha o formato adequado ao local onde você vai publicar. Colar a versão com link no seu CMS preserva o backlink.
@misc{dilmegani2026,
  author = {Dilmegani, Cem and Ermut, Sıla},
  title  = {{Top 8 softwares de monitoramento de rede}},
  year   = {2026},
  month  = sep,
  howpublished    = {\url{https://aimultiple.com/network-monitoring-software}},
  note   = {AIMultiple. Acessado em 22 setembro 2026}
}Resultados e carimbos de data/hora de 22 pontos de dados. Baixe os dados resumidos exibidos nos gráficos e tabelas deste artigo como um arquivo ZIP contendo 3 arquivos CSV.
Quer os dados granulares por trás disso? Assine o Premium
Registro de alterações
12 atualizaçõesAdicionados detalhes de monitoramento de rede baseado em SNMP na seção da NinjaOne.
Removidos Prós e Contras da seção Paessler PRTG Network Monitor.
O trabalho de Cem na AIMultiple foi citado por publicações globais líderes, incluindo Business Insider, Forbes, Morning Brew e Washington Post, por empresas globais como Deloitte e HPE, ONGs como o World Economic Forum e organizações supranacionais como a European Commission. [1], [2], [3], [4], [5]
Ao longo de sua carreira, Cem atuou como consultor de tecnologia, comprador de tecnologia e empreendedor de tecnologia. Ele aconselhou empresas sobre suas decisões de tecnologia na McKinsey & Company e na Altman Solon por mais de uma década. Ele também publicou um relatório da McKinsey sobre digitalização.
Ele liderou a estratégia de tecnologia e as compras de uma operadora de telecomunicações, reportando-se ao CEO. Ele também liderou o crescimento comercial da empresa de deep tech Hypatos, que atingiu uma receita recorrente anual de 7 dígitos e uma avaliação de 9 dígitos partindo do zero em 2 anos. O trabalho de Cem na Hypatos foi coberto por publicações de tecnologia líderes como TechCrunch e Business Insider.
Cem fala regularmente em conferências internacionais de tecnologia. Ele se formou como engenheiro da computação pela Bogazici University e possui um MBA pela Columbia Business School.

Ela trabalhou anteriormente como recrutadora em empresas de gerenciamento de projetos e consultoria. Sıla possui mestrado em Psicologia Social e bacharelado em Relações Internacionais.
A seguir, leia
Comparação de Preços de Serviços de Monitoramento de Rede

Melhores 9 ferramentas de monitoramento de rede no Windows

Top 9 Software de Análise de Tráfego de Rede



Seja o primeiro a comentar
Seu endereço de e-mail não será publicado. Todos os campos são obrigatórios. Os comentários são deixados em seu idioma original.