We benchmarked four RAG observability platforms on a 7-node LangGraph pipeline across three practical dimensions: latency overhead, integration effort, and platform trade-offs.
Latency overhead metrics
Metrics explained:
Mean is the average latency across 150 measured graph.invoke() calls. LLM-judge evaluations run after the timer stops.
Median is the 50th percentile latency. LLM API responses have long tails, so the median is a better indicator of typical query performance.
P95 is the 95th percentile, the worst-case latency for 95% of queries.
Overhead vs baseline is the difference in mean latency between the platform and the unmonitored baseline.
To understand our evaluation and metrics in detail, see our benchmark methodology for the RAG observability tools.
Integration effort by the platform
Key findings
LLM API variance dwarfs monitoring overhead
Baseline standard deviation was 2,645 ms. The largest overhead was 169 ms. You’d need to remove the LLM from the pipeline to measure SDK overhead in isolation. Single-run benchmarks of monitoring tools measure API variance, not SDK overhead.
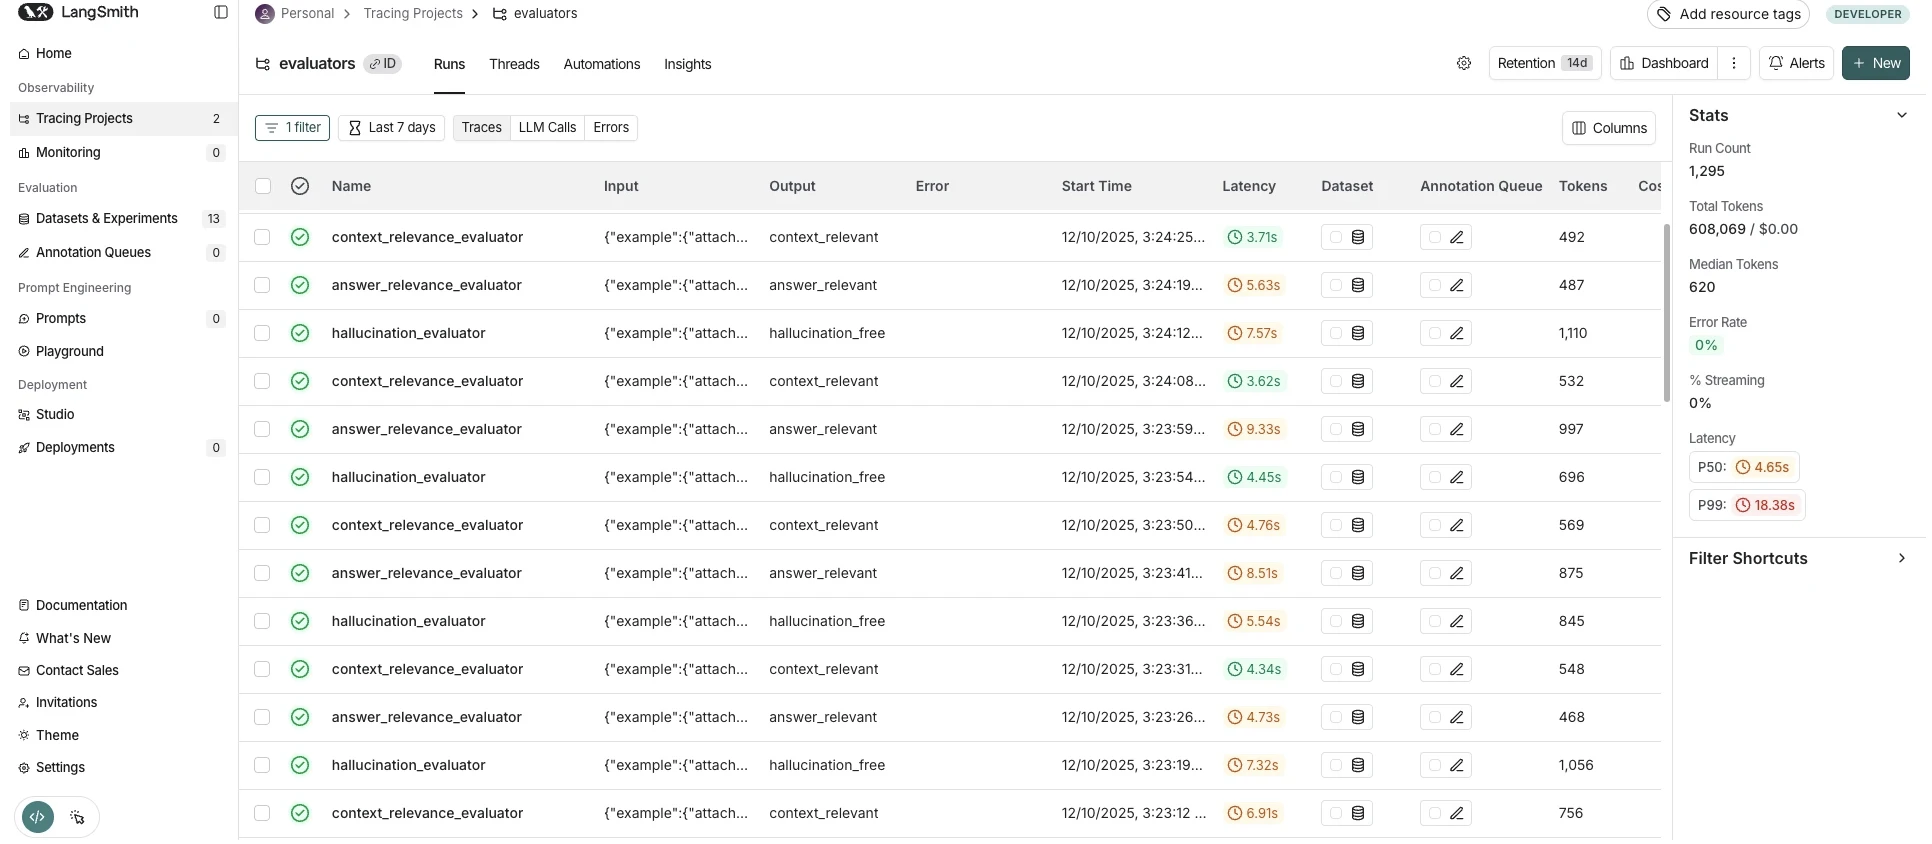
LangSmith requires the least integration code
12 lines added vs baseline (2 env vars). Decorator-based tools (Weave, Laminar, Langfuse) need 29-40 lines. The tradeoff: LangSmith captures everything (including internal LangChain calls you may not need), while decorator-based tools give you explicit control over what gets traced.
Only Langfuse and Laminar offer free self-hosting
Both are open-source (MIT and Apache 2.0). LangSmith and Weave require enterprise contracts for self-hosted deployments.
Weave and LangSmith lead on evaluation orchestration
Both ship full eval orchestrators that handle dataset iteration, prediction, scoring, and aggregation in a single call. Langfuse provides scoring infrastructure (create_score()) but leaves orchestration to the developer. Laminar’s evaluation features are less mature: no experiment comparison UI, limited pre-built scorers.
Langfuse has the lowest per-unit cost at volume
$6/100k units at 50M+. LangSmith charges per-trace ($2.50-5/1k). Weave charges per MB of ingested data ($0.10/MB overage).
Evaluation capabilities by platform
Weights & Biases (Weave)
- Eval orchestrator:
weave.Evaluation.evaluate()handles dataset iteration, prediction, scoring, and aggregation in a single call1 - Custom scorers:
Scorersubclass or any@weave.op()function - Pre-built scorers: Some (correctness, etc.)
- Dataset management:
weave.Datasetwith versioning,publish(),from_pandas() - Experiment comparison: Evals tab with Compare view + Leaderboards
- Online eval:
EvaluationLogger, guardrails/monitors
LangSmith
- Eval orchestrator:
evaluate()function 2 - Custom scorers:
(Run, Example) -> dictfunction - Pre-built scorers: Yes (QA correctness, embedding distance, criteria-based LLM judge)
- Dataset management: Full CRUD API, versioned datasets
- Experiment comparison: Side-by-side comparison per dataset
- Online eval: Annotation queues, automated rules on production traces
Laminar
- Eval orchestrator: Basic
evaluate()available but less commonly used3 - Custom scorers:
@observe()decorated functions - Pre-built scorers: Minimal
- Dataset management: UI + limited SDK
- Experiment comparison: Manual
- Online eval:
@observe()on production functions
Langfuse
- Eval orchestrator: No built-in orchestrator. Manual loop +
create_score()per trace4 - Custom scorers: Any code +
create_score(trace_id, name, value) - Pre-built scorers: Model-based eval configs in UI
- Dataset management: UI + API datasets
- Experiment comparison: Manual (session filtering)
- Online eval:
create_score()on live traces, human annotation queues
Pricing comparison
Free tier and data retention
Paid plans and usage pricing
Pricing is reported as of March 2026 and may change over time. Please refer to each vendor’s website for the most current rates.
Cloud, self-hosted, and open-source deployment
Trace and debug visibility
- Weave shows a tree view of
@weave.op()decorated calls. Clicking a node reveals inputs, outputs, and timing. The Evals tab links traces to evaluation results. - LangSmith captures the full LangChain execution graph automatically, including internal chain steps. The trace view includes token counts, latency breakdown, and cost estimates per LLM call.
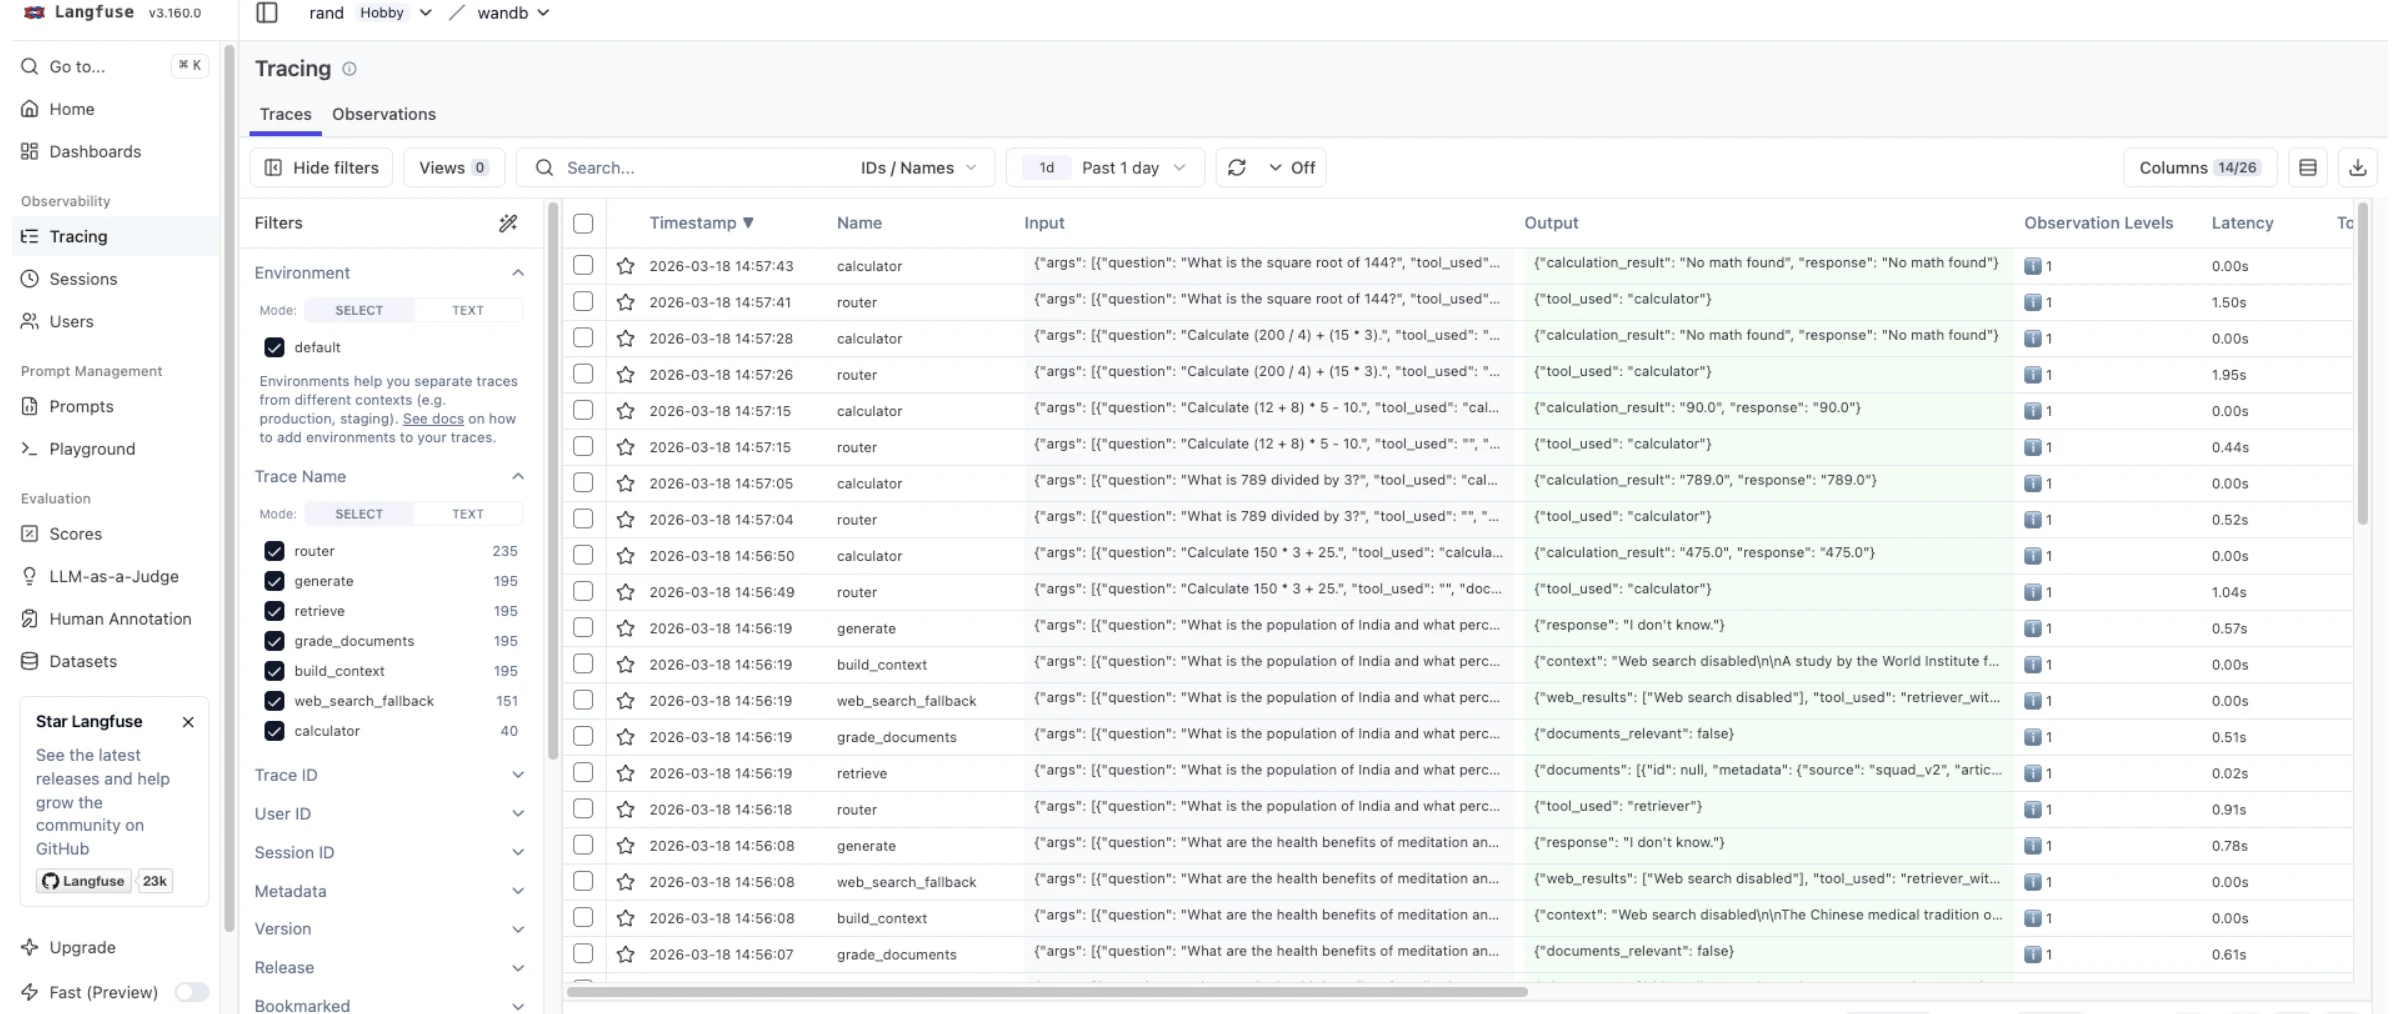
- Langfuse displays traces with spans. Session tracking groups multiple queries from the same user. Cost tracking is built into the trace view.
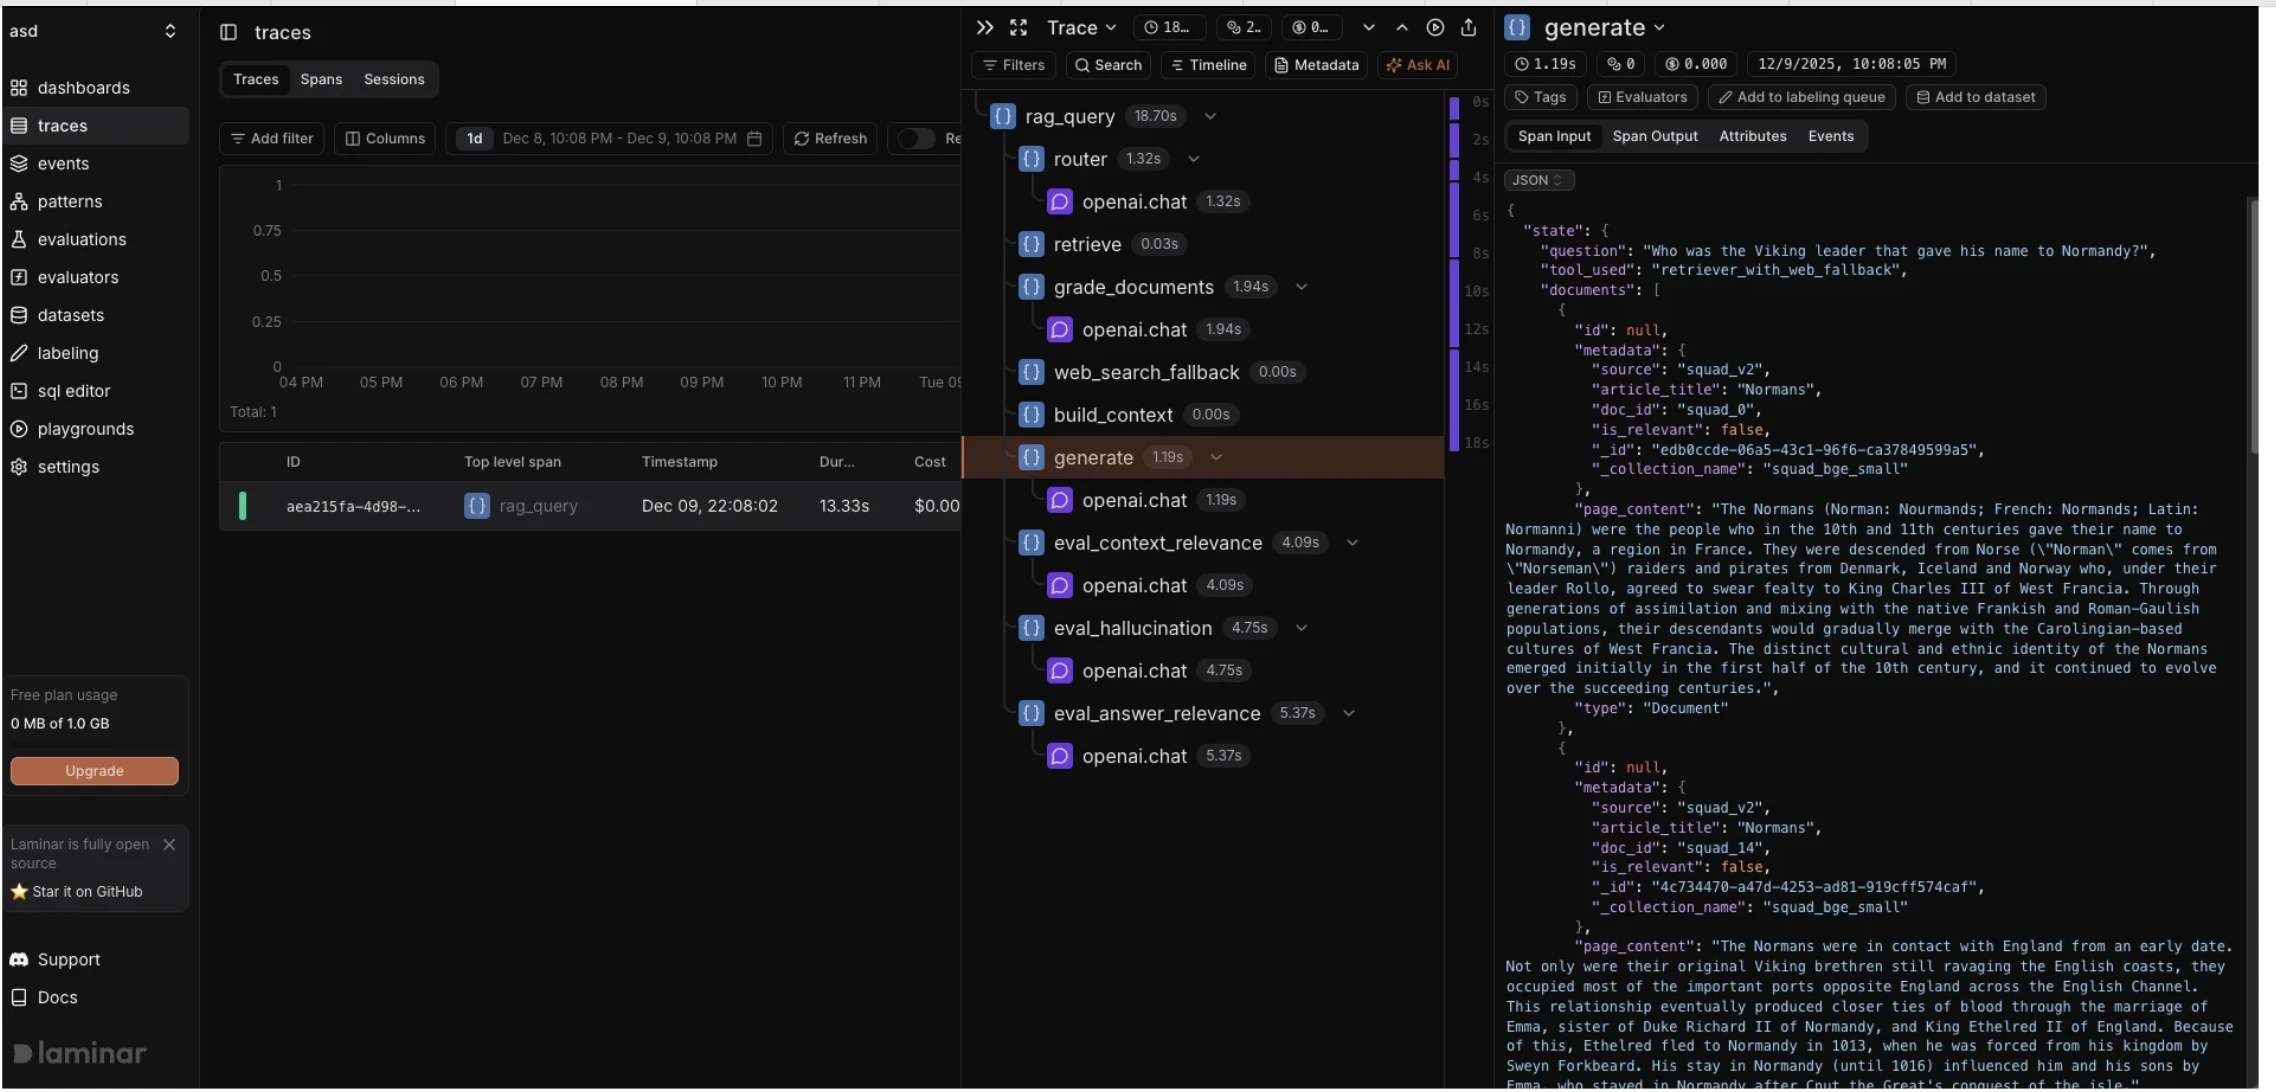
- Laminar shows a span timeline similar to distributed tracing tools. The
@observe()decorated functions appear as spans with input/output capture.
Which tool for which use case
- LangChain pipeline, want zero-effort tracing: LangSmith. Env-var auto-instrumentation, +12 lines of code.
- Already using W&B, need eval orchestration: Weave.
weave.Evaluation+ dataset versioning + leaderboards. - Need self-hosting without enterprise contract: Langfuse. Open-source (MIT), Docker Compose, EU data region.
- Want OSS observability, don’t need eval orchestrator: Laminar. Apache 2.0, lightweight
@observe()decorator. - High-volume production, cost-sensitive: Langfuse. $6/100k units at 50M+ volume.
- Need both tracing and built-in evaluation: Weave or LangSmith. Full eval orchestrators with dataset management.
Benchmark methodology for RAG observability tools
Hardware: Apple M4, 16 GB RAM, macOS 26.3
RAG pipeline: LangGraph StateGraph with 7 nodes (router, retriever, document grader, web search fallback, calculator, context builder, generator)
LLM: openai/gpt-4.1-nano via OpenRouter (temperature 0.0)
Router LLM: google/gemini-2.5-flash via OpenRouter (structured output)
Evaluation LLM: google/gemini-2.5-pro via OpenRouter
Vector database: Qdrant 1.12 (local Docker), cosine distance, 1,204 SQuAD documents
Embeddings: BAAI/bge-small-en-v1.5 (384-dim, CPU inference)
Candidate retrieval: top-5 documents per query
Query set: 30 curated queries, 20 factual (knowledge base retrieval), 5 multi-hop (require combining information), 5 math (routed to calculator node).
Pipeline: 3-query warmup discarded. 5 complete passes over all 30 queries per platform. Total: 150 measured executions per platform. Timer: time.perf_counter() wraps graph.invoke(). LLM-judge evaluations run after the timer stops. gc.collect() between iterations and platforms. Baseline first, then each platform sequentially.
Controlled variable: All platforms share identical pipeline code, LLM instances, retriever config, and query set. The variable is the observability layer.
Statistical tests: 95% CI via t-distribution, Mann-Whitney U (non-parametric, two-sided) for significance, Cohen’s d for effect size, IQR method for outlier detection.
Tools tested
How RAG observability works
Each tool packages instrumented function calls as a “trace” (a tree of “spans”) and sends them to a backend. The overhead comes from three operations on each call: (1) span creation at entry, (2) payload serialization at return, and (3) background transmission. Most tools transmit asynchronously, but span creation and serialization happen inline.
Env-var vs decorator vs SDK instrumentation
Environment-variable instrumentation (LangSmith). Setting LANGCHAIN_TRACING_V2=true activates tracing hooks built into LangChain and LangGraph. Every LLM call, retriever invocation, and graph node is captured automatically. No pipeline code changes required.
Decorator-based instrumentation (Weave, Laminar, Langfuse). The developer wraps each function with a decorator (@weave.op(), @observe()). Undecorated functions are not traced.
LangSmith captures everything (including internal LangChain calls you may not need) and works with LangChain-based pipelines. Decorator-based tools work with any Python code. The per-node wrapping code is nearly identical across Weave, Laminar, and Langfuse.
Limitations
Single-threaded, sequential query workload. Production concurrent requests may change the overhead profile due to async flush contention.
External LLM APIs (OpenRouter) dominate total latency, compressing relative monitoring overhead. Local inference (e.g., Ollama) would make overhead proportionally larger.
Cloud backends only. Langfuse and Laminar self-hosted deployments could have different overhead since they skip network transmission to an external tracing service.
Warm-up phase removes cold-start costs. Serverless deployments would see higher first-request overhead from SDK initialization.
LangSmith captures all LangChain internal calls, not just the 7 pipeline nodes. Other platforms trace decorated functions. This makes the comparison one of different instrumentation scopes, not equivalent workloads.
Pricing data scraped as of March 2026. Verify current rates at each vendor’s website.
Conclusion
Latency overhead is not a useful criterion for choosing between these tools. All four added less than 170 ms to a pipeline where LLM API calls take 1,000-3,000 ms, and none of the differences were statistically significant.
LangSmith is the fastest to integrate if you’re on LangChain 12 lines and you have full tracing. Weave and LangSmith both offer evaluation orchestration that Langfuse and Laminar lack. Langfuse and Laminar are the only options if you need to self-host without an enterprise contract.
Further reading
Explore other RAG benchmarks, such as:
- Embedding Models: OpenAI vs Gemini vs Cohere
- Top 16 Open Source Embedding Models for RAG
- Top Vector Database for RAG: Qdrant vs Weaviate vs Pinecone
- Reranker Benchmark: Top 8 Models Compared
- Multimodal Embedding Models: Apple vs Meta vs OpenAI
- Graph RAG vs Vector RAG Benchmark
- Top 10 Multilingual Embedding Models for RAG
Cite this research
Pick the format that matches where you're publishing. Pasting the link version into your CMS preserves the backlink.
@misc{sar2026,
  author = {Sarı, Ekrem},
  title  = {{RAG Observability Tools Benchmark}},
  year   = {2026},
  month  = mar,
  howpublished    = {\url{https://aimultiple.com/rag-monitoring}},
  note   = {AIMultiple. Retrieved March 23, 2026}
}
Be the first to comment
Your email address will not be published. All fields are required. Comments are left in their original language.