


Best 9 Network Monitoring Tools in Windows

We tested network monitoring tools designed for Windows environments to evaluate their performance in real-world deployments. Our goal was to find solutions balancing reliability, usability, and deep integration with Microsoft systems.
Each tool had to meet three criteria:
Protocol Support: Tools needed to handle multiple communication protocols: SNMP, TCP, ICMP, and IPMI.
Compatibility: Each tool had to work smoothly with Windows Servers and clients.
Real-Time Monitoring: Ability to analyze live network activity and identify performance issues quickly.
* Reviews are based on Capterra and G2.
1. NinjaOne
NinjaOne combines endpoint management and network monitoring for distributed IT environments, including multi-office networks.
Source: NinjaOne Website 1
Core Features
- Combines network monitoring with patch and backup management.
- Supports remote access, automation, and policy enforcement.
- Includes built-in PowerShell scripting and Windows update control.
- Adds Digital Employee Experience (DEX) tools: self-service portals (web and mobile), user-focused IT dashboards, and automated fixes for common endpoint issues.2
- The Network Discovery wizard finds SNMP v1/v2/v3 devices from the NinjaOne console and assigns device roles automatically.3
Network monitoring on Windows
NinjaOne’s SNMP monitoring runs through an NMS agent installed on a designated Windows device inside the customer’s network.3 This probe queries devices for OIDs, receives SNMP traps, and relays results to the NinjaOne cloud. It supports NetFlow, jFlow, sFlow, and IPFIX, plus configuration backups for HP and Cisco devices. It includes 50+ OID templates for device types such as Dell iDRAC, HP iLO, Synology NAS, and APC UPS.
Windows management
- PowerShell script library and automation
- Windows update deployment and tracking
- Software inventory and deployment
- Group Policy integration
Best for: IT service providers and distributed organizations that manage many Windows environments from one console.
Deployment notes: Monitoring, patching, backup, and remote access sit in one platform, which reduces the number of separate tools. Complex automation workflows and custom management reports take extra setup.
Choose NinjaOne to streamline your IT operations with a powerful, all-in-one tool.
2. Paessler PRTG Network Monitor
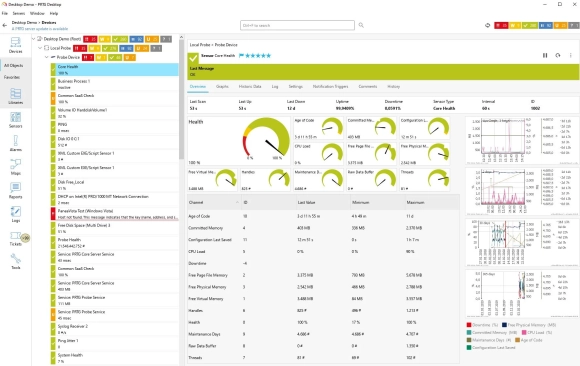
Paessler PRTG monitors network and system performance with prebuilt sensors for Windows devices.
Core features
- PRTG Data Exporter sends monitoring data to external databases and tools. It now supports lightweight worker agents on remote machines to collect data from PRTG servers in isolated networks.4
- One-second polling intervals for near real-time data
- Custom monitoring through PowerShell
- Automatic discovery and network maps
- More than 300 native sensor types
Windows-specific features
PRTG tracks performance counters, reads Windows Event Logs, and monitors Active Directory, Exchange, and SharePoint servers.
Windows system monitoring includes:
- Windows system uptime through WMI or performance counters
- Windows Updates status (PowerShell-based)
- WMI Event Log monitoring
- WMI Security Center monitoring
- IIS, SQL Server, and Windows process monitoring
- Active Directory, SharePoint, and Office 365
Automatic Network Discovery
During setup, enter IP address range and PRTG searches for available devices and adds predefined sensors. Enables initial monitoring immediately after first opening the software.
Pricing
PRTG offers a free tier of up to 100 sensors. Paid plans are billed annually: PRTG 500 costs €137/month and covers approximately 50 devices; PRTG 1000 costs €242/month for around 100 devices; PRTG 2500 costs €508/month for up to 250 devices; PRTG 5000 costs €908/month for up to 500 devices; and PRTG 10000 costs €1,225/month for up to 1,000 devices.5
3. Auvik
Auvik is a cloud-based platform for network discovery, traffic analysis, and configuration backup.
Core Features
Windows integration
- Endpoint Network Monitoring extends network visibility to Windows and macOS devices used by remote and hybrid staff.6
- Expanded server monitoring adds deeper visibility into Windows server environments.
- SNMP monitoring of Windows servers
Best for: MSPs managing many client networks and enterprises with many office locations.
Deployment notes: Topology maps update automatically when the network changes. As a cloud service, Auvik needs an internet connection. On-premises tools such as PRTG and Zabbix keep working during an internet outage.
4. Zabbix
Zabbix is an open-source monitoring platform. The server runs on Linux, FreeBSD, and macOS; Windows is supported through the agent.
Source: Zabbix7
Core Features
- No license fees, with full source code access
- Multi-tenant support with detailed permissions
- Templates for Windows environments
- Zabbix introduces multi-level nested device discovery, OAuth 2.0 SMTP authentication, TLS encryption between frontend and server, and a new Host Wizard for guided host setup. 8
Windows integration
- Native Windows agent with WMI support
- Active Directory authentication
- Custom Windows metric collection
- PowerShell script execution
Best for: Organizations with staff who can configure and maintain open-source tools.
Deployment notes: There are no license fees, but setup, tuning, and upgrades take staff time. Documentation for advanced configurations can be thin.
5. Prometheus
Prometheus is an open-source monitoring system built for microservices and containers. It monitors Windows through exporters.
Source: Prometheus9
Core features
- Time-series database built for metrics
- Pull-based data collection
- PromQL for advanced queries
- Grafana integration for dashboards
Windows monitoring
windows_exporter, maintained by the Prometheus community, includes collectors for Active Directory, DHCP, DNS, Exchange, CPU, disk, and container metrics. It supports Windows Server 2008 R2 and later, and desktop Windows 7 and later.10
Best for: DevOps teams running containerized applications on Windows servers, especially teams already using Kubernetes.
Deployment notes: Prometheus fits application and container monitoring. It is not a traditional network monitor. It offers less coverage of routers and switches than PRTG or SolarWinds, and it needs a separate Grafana installation for dashboards.
6. LogicMonitor
LogicMonitor is a SaaS observability platform for on-premises and cloud infrastructure.
Core features
- SaaS deployment with light setup
- Anomaly detection that flags metrics outside normal ranges
- Edwin AI supports root cause analysis using log data, AI-based categorization of enrichment fields, and incident investigation workflows.11
- After acquiring Catchpoint, LogicMonitor added Internet Performance Monitoring, Digital Experience Monitoring, and synthetic tests from global vantage points. This extends visibility to internet paths and end-user experience.12
Operational notes
- No on-premises monitoring servers to maintain; collectors run on Windows or Linux.
- Updates are applied automatically.
- Pre-built integrations cover 2,000+ technologies.
Best for: Organizations with hybrid on-premises and cloud estates.
Deployment notes: Like other SaaS tools, LogicMonitor needs internet connectivity. Costs rise with large deployments. Advanced features take time to learn.
7. SolarWinds Network Performance Monitor (NPM)
SolarWinds NPM covers network performance, fault detection, and real-time monitoring of network components. SolarWinds became a private company after Turn/River completed its acquisition in April 2025. NPM features are also available as part of SolarWinds Observability Self-Hosted.13
Core Features
- Network discovery and topology maps
- Real-time bandwidth monitoring
- Collection of availability, response time, packet loss, bandwidth use, errors and discards, and hardware health data such as CPU, memory, temperature, and fan speed
- NetPath views that show performance across each hop, including service provider and cloud segments
Windows-specific features
- WMI-based Windows server monitoring
- Windows service dependency mapping
- Performance counter integration
- Windows Event Log correlation
Technical specifications
- Custom dashboards and reports
- Integration with other SolarWinds modules
- REST API for custom integrations
Best for: Large enterprise networks with dedicated network teams.
Deployment notes: The interface is simple enough for junior engineers. Uptime percentage reports help with SLA and budget reviews. Cost, setup complexity, and hardware requirements make NPM a harder fit for small organizations.
 Add as preferred source
8. LiveAction LiveNX
LiveNX is a network performance monitoring and diagnostics tool for large, complex networks. BlueCat closed its acquisition of LiveAction’s network observability platform in late 2024. BlueCat now offers LiveNX to partners through its BlueCatalyst channel program.14
Core features:
- Integrated flow and deep packet analysis, dynamic visualizations, and root cause analysis
- Network path visualization and mapping
- Application performance monitoring
- Bandwidth utilization tracking
Windows environment support:
- Windows-based deployment options
- Integration with Windows domain infrastructure
- Support for Windows-based network applications
- Windows performance correlation
9. ManageEngine OpManager
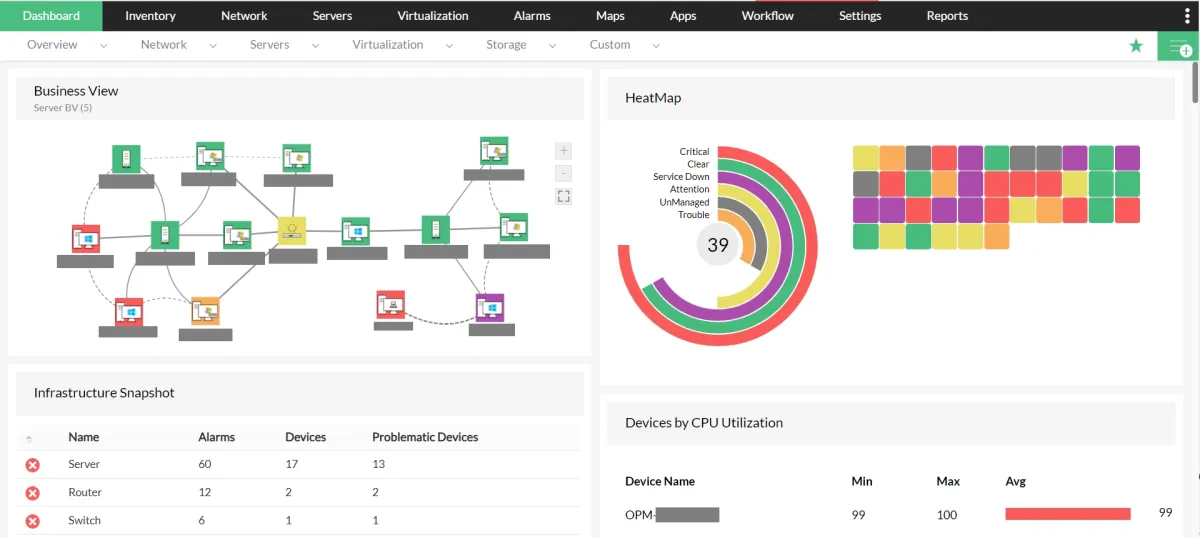
OpManager monitors network devices through SNMP and Windows hosts through WMI.
Core Features:
- Monitors over 2,000 performance metrics
- Compatibility with non-SNMP devices and the capacity to function as an SNMP trap receiver
- Native Windows Server and Linux deployment options
- Service pack adds approximately 300 new device templates, dynamic CVE ID search in the Firmware Vulnerability page, SNMPv3 handshake stability fixes, and improved interface discovery syncing. 15
Built-in Windows tools for network monitoring
Windows includes free tools for checking network activity on a single machine. They help with quick troubleshooting. They lack central dashboards, alerting, and long-term history across many devices.
- Resource Monitor (resmon.exe): The Network tab shows which processes send and receive data, plus open TCP connections and listening ports.
- Performance Monitor (perfmon.exe): Tracks counters such as Network Interface\Bytes Total/sec and saves them to log files.
- Packet Monitor (pktmon.exe): A built-in tool for packet capture, packet drop detection, filtering, and counting, also available through Windows Admin Center extensions. It ships with Windows 10 and Windows Server 2019 (version 1809 and later), and its logs can be converted to pcapng format.16
- PowerShell: Get-NetTCPConnection lists active connections. Get-NetAdapterStatistics shows bytes sent and received per adapter. Get-CimInstance queries WMI data and replaces WMIC.
- netstat -ano: Lists connections with the ID of the process that owns each one.
When checks must run across many servers with alerts and stored history, a dedicated monitoring tool is the next step.
FAQs
Network monitoring tools in Windows are software solutions designed to oversee and manage the health, performance, and security of network infrastructure within Windows environments. They utilize key features like real-time analysis, network mapping, and device monitoring to ensure smooth network operations.
By continuously tracking network traffic and device status, network monitoring tools in Windows servers enable administrators to identify and address issues promptly. This proactive approach helps maintain optimal server performance and minimizes downtime.
Essential features to consider include real-time traffic analysis, support for Simple Network Management Protocol (SNMP), customizable alerts, detailed network observability, and the ability to monitor a wide range of devices and services across your network infrastructure.
Yes, network monitoring tools in Windows can significantly aid in managing network traffic monitoring. They provide visibility into traffic patterns, identify bottlenecks, and help in allocating bandwidth more efficiently to ensure a smooth flow of data across the network.
Network mapping is a critical component of network monitoring in Windows as it offers a visual representation of your network’s architecture. This visualization makes it easier to understand the relationships between devices, pinpoint problem areas, and plan for network expansions or optimizations.
Cite this research
Pick the format that matches where you're publishing. Pasting the link version into your CMS preserves the backlink.
@misc{dilmegani2026,
  author = {Dilmegani, Cem and Arslan, Ezgi},
  title  = {{Best 9 Network Monitoring Tools in Windows}},
  year   = {2026},
  month  = sep,
  howpublished    = {\url{https://aimultiple.com/network-monitoring-tools-in-windows}},
  note   = {AIMultiple. Retrieved September 21, 2026}
}Results and timestamps of 9 data points. Download the summary data shown in this article's charts and tables as a ZIP file containing one CSV file.
Want the granular data behind it? Join Premium
Changelog
11 updatesRemoved transparency statement on vendor ranking methodology from introduction.
Updated the number of native sensor types for monitoring in PRTG.
Expanded the "Paessler PRTG Network Monitor" section with new Windows-specific features and automatic network discovery details.
Reference Links
Cem's work at AIMultiple has been cited by leading global publications including Business Insider, Forbes, Morning Brew, and Washington Post, global firms like Deloitte and HPE, NGOs like World Economic Forum, and supranational organizations like European Commission. [1], [2], [3], [4], [5]
Throughout his career, Cem served as a tech consultant, tech buyer and tech entrepreneur. He advised enterprises on their technology decisions at McKinsey & Company and Altman Solon for more than a decade. He also published a McKinsey report on digitalization.
He led technology strategy and procurement of a telco while reporting to the CEO. He has also led commercial growth of deep tech company Hypatos that reached a 7 digit annual recurring revenue and a 9 digit valuation from 0 within 2 years. Cem's work in Hypatos was covered by leading technology publications like TechCrunch and Business Insider.
Cem regularly speaks at international technology conferences. He graduated from Bogazici University as a computer engineer and holds an MBA from Columbia Business School.











Be the first to comment
Your email address will not be published. All fields are required. Comments are left in their original language.