


Compare Multimodal AI Models on Visual Reasoning

We benchmarked 40 leading multimodal AI models on visual reasoning using 200 visual-based questions. The evaluation consisted of two tracks: 100 chart understanding questions testing data visualization interpretation, and 100 visual logic questions assessing pattern recognition and spatial reasoning.
Visual reasoning benchmark
See our benchmark methodology to learn our testing procedures.
Every model scores lower on visual logic than on charts. The gap is smallest for qwen3.8-flash (58% vs 78%) and largest for claude-sonnet-4.5 (35% vs 77%).
- gemini-4-argon has the highest score in both categories: 62% on visual logic and 87% on chart understanding. It also ranks first overall at 74.5%, 1 point ahead of gemini-3.7-flash and claude-opus-5.5 (73.5% each). That is a 2-question difference out of 200, so the top three are within a few questions of each other.
- gemini-3.5-flash-lite (36.5%) and llama-4-maverick (38.5%) are last overall because of visual logic. They answer 22% and 19% of these questions correctly, and claude-haiku-4.5 answers 20%. All three are near the 20% that random guessing gives with five options. On charts the same three models also rank last, at 51% to 61%.
Cost & latency comparison
Benchmark questions on where LLMs excel and struggle most
Chart question with the lowest LLM success rate
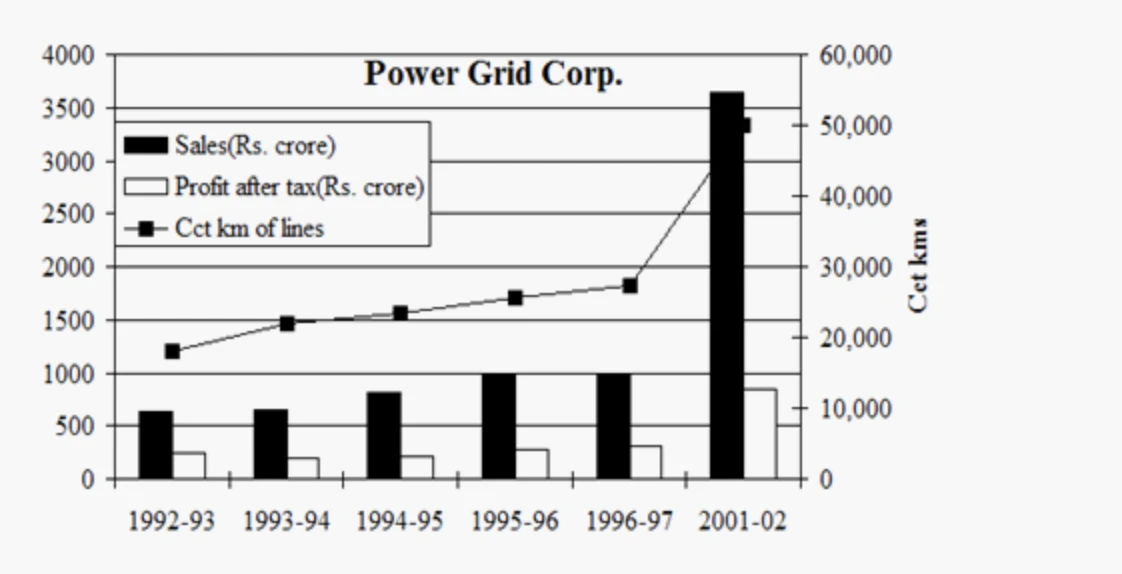
Figure 1: Bar chart of Power Grid Corp. showing Sales (black bars) and Profit after tax (white bars) for 1992-93 to 1996-97 and 2001-02, with a line for circuit km of lines on a second y-axis.
Note: All charts were obtained from Hitbullseye.1
Question: Profitability (Profit / Sales) is the highest in: A. 1992-93 B. 1993-94 C. 2001-02 D. 1996-97
None of the 40 models answered correctly (the answer is D, 1996-97), and 38 of them chose 1992-93. The calculation is a single division per year, so the difficulty lies in reading the chart.
The profit bars are small and white, only a few hundred crore on a 0-4,000 axis with gridlines every 500. The differences between years come down to a few pixels. The second y-axis and the overlaid line add clutter. Models had to compare these short white bars against much taller black ones, and a small misreading of bar height was enough to change the answer.
Chart question with the highest LLM success rate
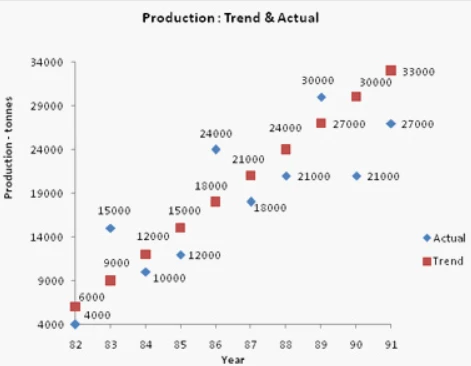
Figure 2: Scatter plot showing actual and trend production (in tonnes) from 1982 to 1991. Blue diamonds mark actual values, red squares mark trend values, and every point is labeled with its value.
Question: The trend has been established as: A. This year’s production is one and a half times last year’s. B. This year’s production is twice last year’s. C. This year’s production is three thousand tonnes more than last year’s. D. This year’s production is four thousand five hundred tonnes more than last year’s.
All models answered this question correctly. The trend points rise by the same amount every year (6,000, 9,000, 12,000 and so on up to 33,000). Because each point carries its value as a label, models could read the numbers directly instead of estimating positions against the axis.
The Power Grid chart required comparing the heights of small bars. Here no height estimation is needed: the labels give exact values, and the only step left is a simple subtraction.
Visual logic question with the highest LLM success rate
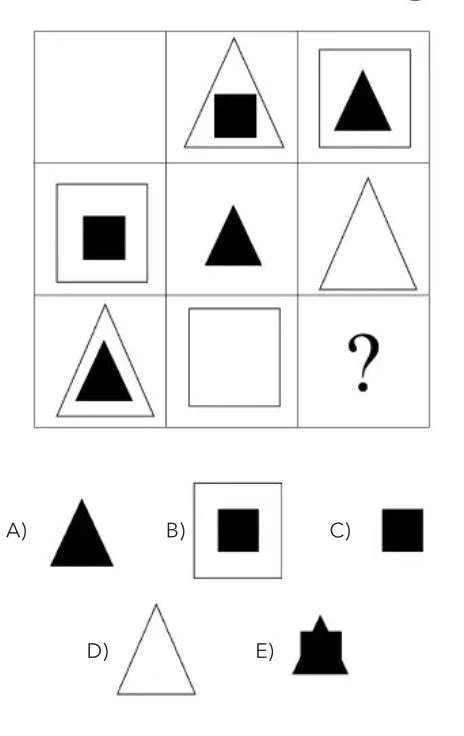
Figure 4: A 3×3 grid in which each cell holds a white or black triangle or square, either alone or nested inside one another. The bottom-right cell is missing, and five options are given.
Question: Which option completes the grid?
38 of the 40 models answered correctly (the answer is C, a black square). Only claude-haiku-4.5 and llama-4-maverick missed it. Each row and column contains a white triangle, a white square, a black triangle and a black square exactly once. The missing piece can therefore be found by listing what is already there.
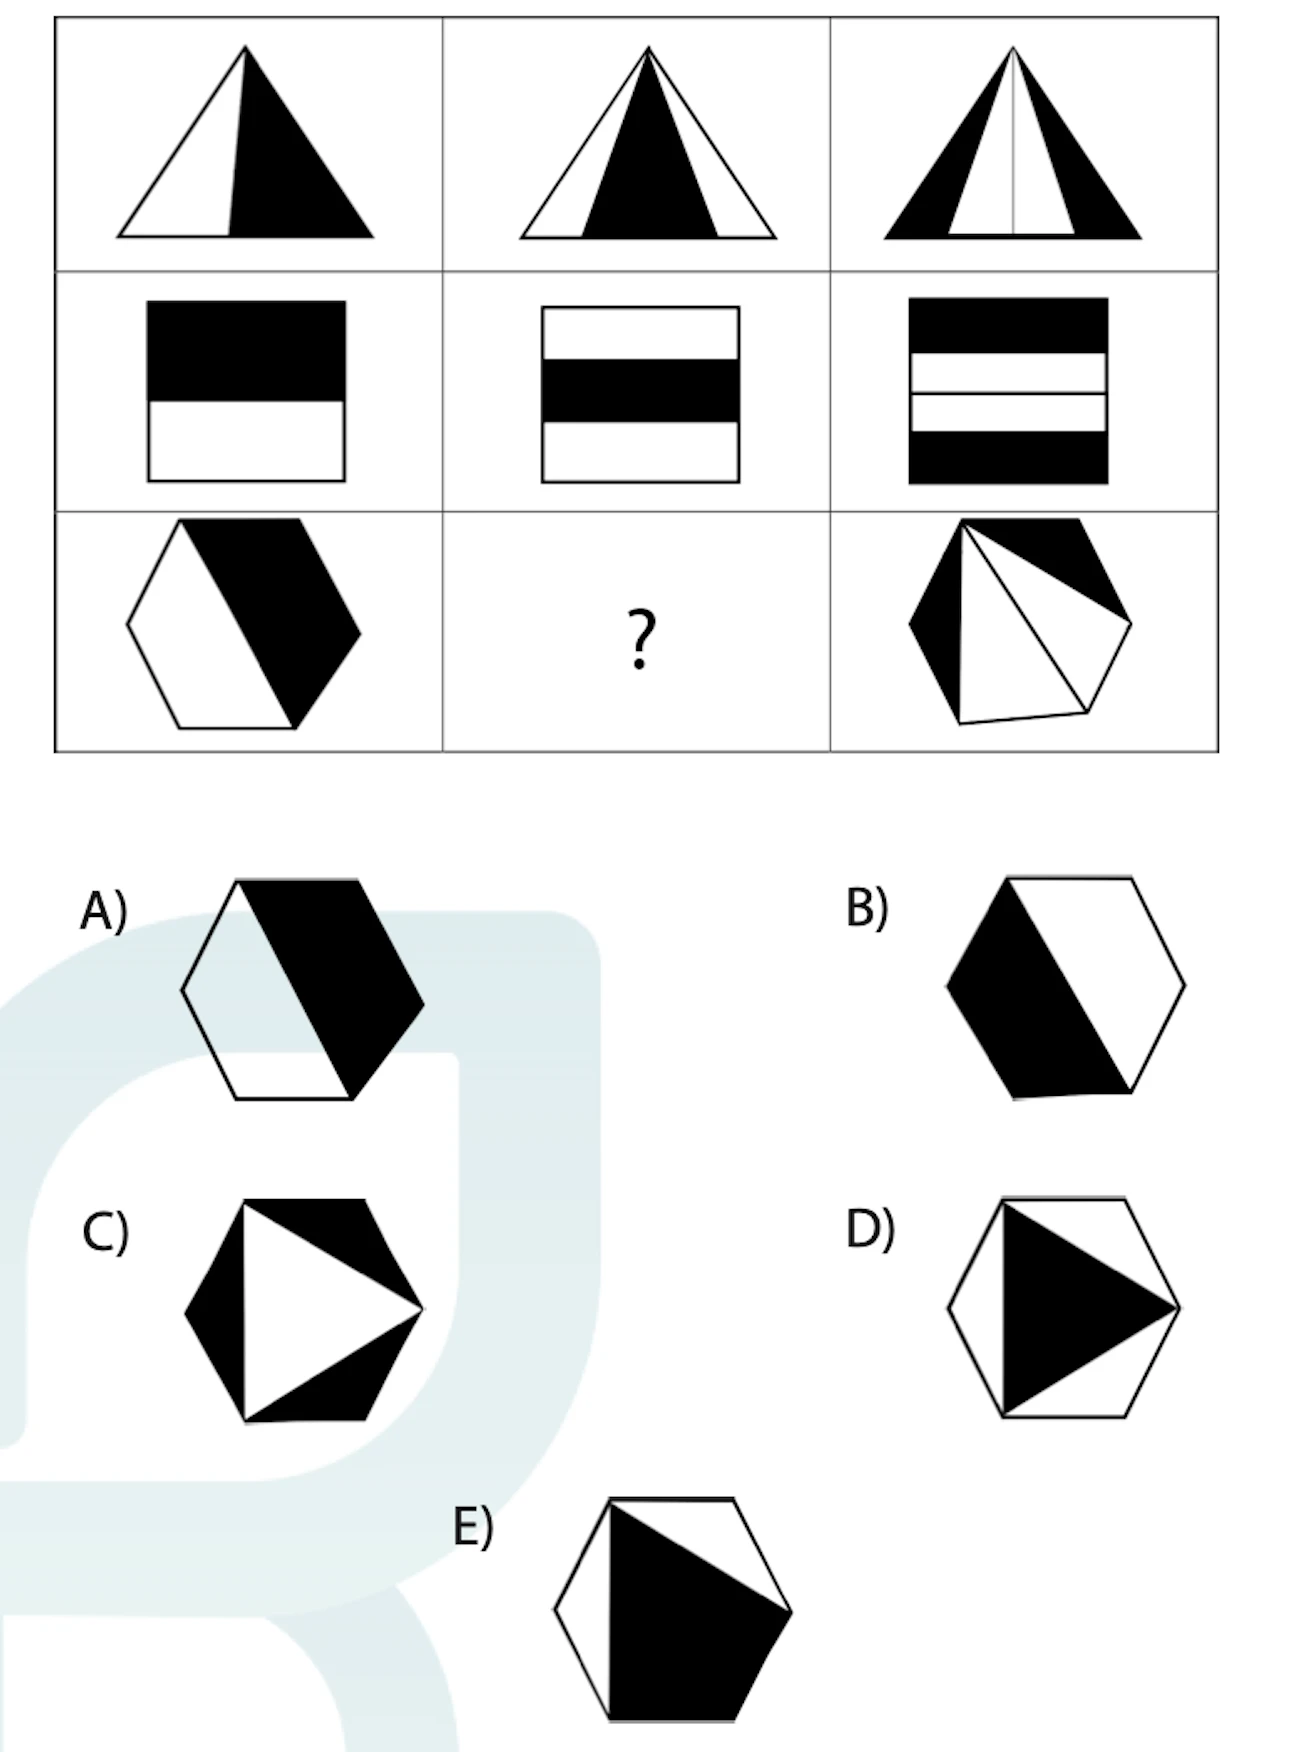
In the hexagon grid, the rule depended on how the shapes were split into regions. Here every element is a separate, clearly drawn shape that models can identify and count.
Visual logic question with the lowest LLM success rate
Figure 3: A 3×3 grid of shapes: triangles in the first row, rectangles in the second and hexagons in the third. Each shape is divided into black and white regions, and the middle hexagon is missing. Five hexagons are given as options.
Question: Which option completes the grid?
None of the 40 models answered correctly. The question has no numbers or calculations; the only task is to see how the black and white regions change across each row.
Benchmark methodology
We evaluated 40 vision-capable models on 200 image-based multiple-choice questions.
- Reasoning: Each model was set to the highest reasoning effort it supports (max, xhigh or high, depending on the model). For some models, no reasoning-effort parameter was accepted, so the provider’s default applied:
- gemini-3.1-pro-preview, gemini-3.6-flash, gemini-3.7-flash, gemini-3.8-flash, gpt-5.2-pro and qwen3.8-flash still reasoned by default.claude-haiku-4.5 and gemini-3.5-flash-lite produced no reasoning tokens.kimi-k2.5 reasoned on only 34 of its 200 calls.
- Temperature: Not set, so each provider’s default applied.
- Max tokens: Set to 1,000,000 so that output length would not limit reasoning. If a provider rejected this value, the model’s own maximum output limit was used.
- Runs: Each question was run once per model, for 7,600 calls in total.
- Retries: Failed calls were retried up to 3 times, 60 seconds apart. On 4 visual logic questions, muse-wonder never returned an answer: its provider closed the connection after about 6.5 minutes on every attempt. These 4 questions count as wrong, so no question was excluded.
- Cost and latency: Cost is the billed cost the gateway reported for each call. Latency is the duration of the successful call, excluding retry waits.
The benchmark consisted of 200 questions in two categories: Chart Understanding (100 questions) and Visual Logic (100 questions). Chart questions send the chart as an image, with the question and options as text. Visual logic questions put the whole question, including the options, inside the image. Most chart questions have four options (89 of 100), and the rest have five or fewer. Visual logic questions have five options (A-E).
Questions:
- Chart understanding (100 questions). We evaluated models on their ability to extract, interpret, and analyze information from data visualizations:
- Bar charts (40): single, grouped and dual-axis bar charts
- Scatter plots (26): reading values and trends from labeled points
- Pie charts (14): percentage distributions and proportional reasoning
- Line graphs (10): single and multi-series trends over time
- Combined displays (10): a chart shown together with a second chart or a data table
- Visual logic (100 questions). We assessed abstract reasoning and spatial intelligence through:
- Pattern recognition: identifying sequences and completing visual patterns
- Spatial reasoning: shape transformations and overlaying figures
- Mathematical logic: numerical patterns, algebraic reasoning, and combinatorics
- Abstract thinking: symbol manipulation, logical deduction, and rule inference
 Add as preferred source
Cite this benchmark
Pick the format that matches where you're publishing. Pasting the link version into your CMS preserves the backlink.
@misc{sipi2026,
  author = {Şipi, Nazlı},
  title  = {{Compare Multimodal AI Models on Visual Reasoning}},
  year   = {2026},
  month  = jun,
  howpublished    = {\url{https://aimultiple.com/visual-reasoning}},
  note   = {AIMultiple. Retrieved June 10, 2026}
}Results and timestamps of 22.8 thousand data points. Download the summary data shown in this article's charts and tables as a ZIP file containing 2 CSV files and a README.
Want the granular data behind it? Join Premium
Changelog
6 updatesUpdated the number of benchmarked models in the visual reasoning benchmark section.
Replaced the max tokens parameter setting in the Benchmark methodology.







Be the first to comment
Your email address will not be published. All fields are required. Comments are left in their original language.