


Top 5 AI Network Monitoring Tools & Real Life Examples

We compared the top 5 AI network monitoring tools with real-world deployments that show what AI monitoring looks like in practice.
Top 5 AI Network Monitoring Tools
Vendors | Reviews | Free Trial | Pricing |
|---|---|---|---|
NinjaOne | 4.7 based on 3,437 reviews | 14-day | Not shared publicly. |
Dynatrace | 4.4 based on 1,735 reviews | 15-day | Full-Stack: $0.08 per hour / 8 GiB host Infrastructure: $0.04 per hou Application Security: $0.018 per hour / 8 GiB host Real User: $0.00225 Per session Synthetic: $0.001 Per synthetic request |
Datadog | 4.4 based on 927 reviews | 14-day free trial & free plan with up to 5 hosts | $5/host/month for cloud network monitoring |
LogicMonitor | 4.5 based on 876 reviews | 14-day | Infrastructure Monitoring: $22 USD per resource/month Cloud IaaS Monitoring: $22 USD per resource/month and more options. |
Auvik | 4.3 based on 518 reviews | 14-day | Not shared publicly. |
Note: Reviews are based on Capterra and G2. Vendors are ranked according to the number of reviews.
NinjaOne
NinjaOne is a unified IT operations platform combining remote monitoring, endpoint management, automated patching, and network discovery in a single console.
Key features include:
- Automated anomaly detection and alerts.
- Predictive analytics to catch problems before escalation.
- Automated network discovery using SNMP v1/v2/v3.
- Autonomous Patch Management that prioritizes vulnerabilities by risk rather than schedule.
Dynatrace
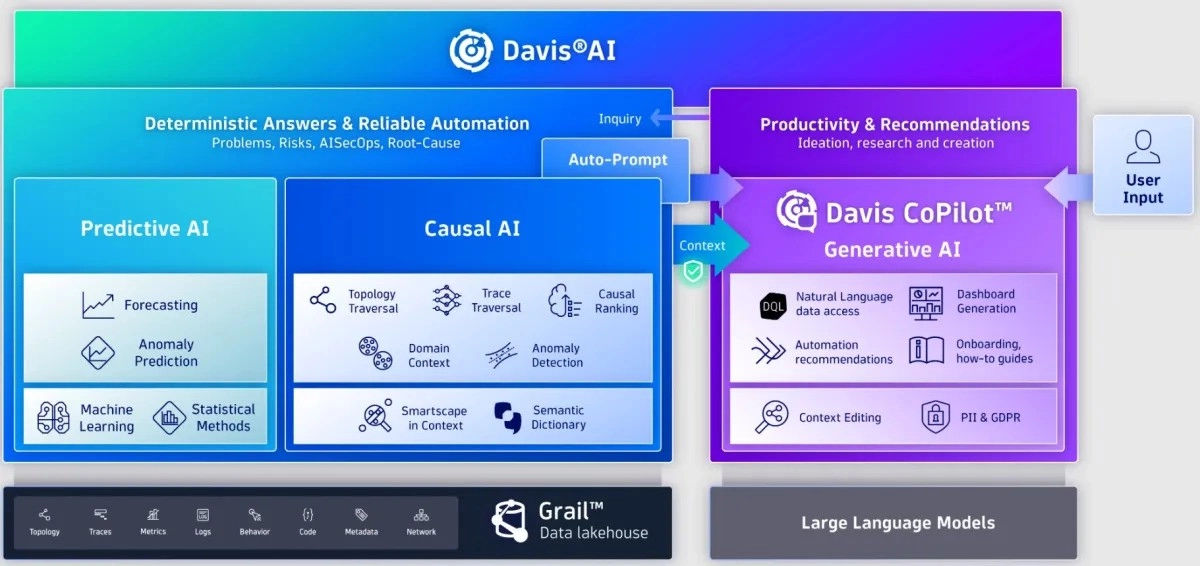
Dynatrace’s Davis AI engine automates root cause analysis, anomaly detection, and predictive insights.
In 2026, Dynatrace launched Dynatrace Intelligence at its annual Perform conference, an agentic AI layer that fuses deterministic analytics with autonomous remediation capabilities, moving the platform from passive insight toward supervised self-healing operations.1
Datadog
Watchdog, Datadog’s built-in AI engine, continuously analyzes billions of data points across infrastructure, applications, and logs to surface anomalies without requiring manual threshold configuration.
Watchdog builds a two-week baseline of expected behavior and improves accuracy over six weeks. Watchdog Insights automatically surfaces performance issues and optimization opportunities.
LogicMonitor
LogicMonitor is an AI-first hybrid observability platform. Its Edwin AI engine provides automated root cause analysis, log-based anomaly detection, and predictive alerting.
LogicMonitor completed the acquisition of Catchpoint for over $250 million, adding internet performance monitoring from thousands of global vantage points to its infrastructure monitoring platform.
Catchpoint’s synthetic, network, and real-user monitoring data feeds directly into Edwin AI, extending visibility from the enterprise perimeter to internet paths, CDNs, and SaaS dependencies.2
Auvik
Auvik is built for Managed Service Providers managing multiple client networks. Its AI auto-discovers and maps network topology as devices come and go and identifies unusual network behavior patterns using ML.
AI network monitoring use cases with case studies
Root cause identification across interconnected systems
When a network issue surfaces, the symptom and the cause are rarely in the same place. An application slowdown may trace back to a DHCP misconfiguration, a VLAN error, or a third-party service that degraded ten minutes earlier. Manually correlating those data points takes hours.
Real-life example: Expert Warenvertrieb GmbH and Juniper Mist AI
Expert Warenvertrieb GmbH is Germany’s second-largest electronics retailer, with 500 specialty stores and a growing e-commerce channel. Expert had deployed three different WiFi products across its facilities and was satisfied with none of them. Forklift drivers regularly reported coverage failures, and the IT team had no reliable way to identify whether the problem was the network infrastructure or something else.
Expert deployed Juniper’s Mist AI platform and Marvis Virtual Network Assistant. When connectivity problems occur, Marvis identifies the root cause: VLAN misconfigurations, DHCP errors, or interference patterns, and distinguishes between network infrastructure failures and external factors. The team can now prove whether the network is responsible rather than defaulting to it as the assumed culprit.3
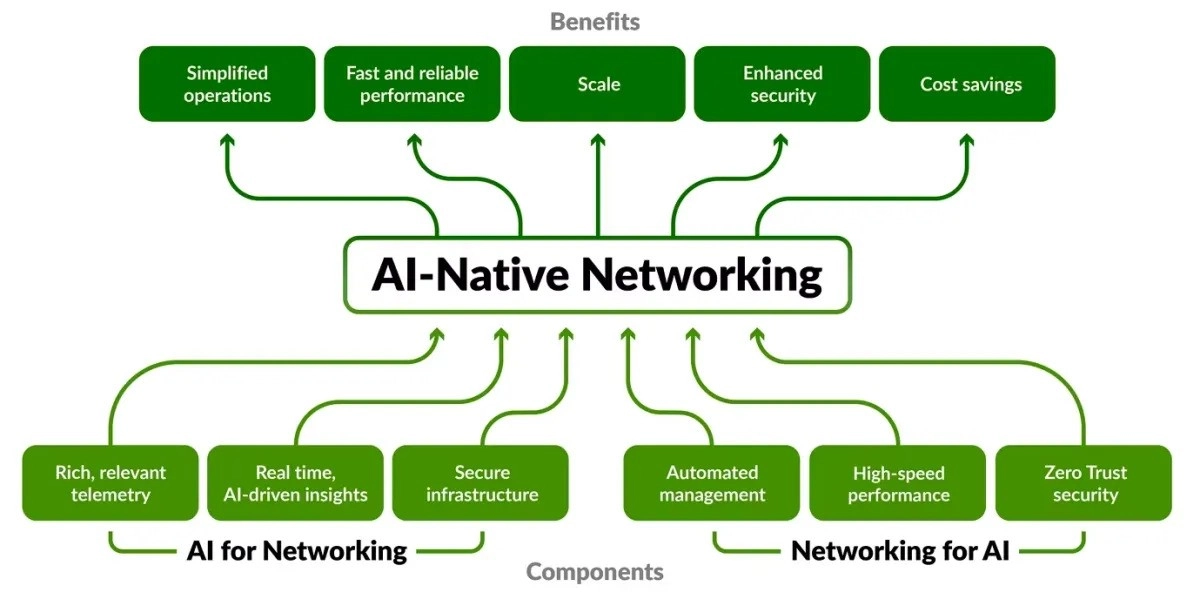
Figure 1: AI-Native Networking Diagram.
Real-life example: Toyota Motor North America and Datadog Watchdog
Toyota’s manufacturing plants in North America use Automated Guided Vehicles (AGVs) to move parts across production floors. These AGVs must maintain continuous WiFi connectivity to operate. When the vehicles began randomly disconnecting, production halted without warning.
Toyota’s IT team and the AGV vendor investigated but couldn’t identify the cause. Each party pointed to the other’s infrastructure. The disconnections appeared random, showed no obvious pattern in manual log reviews, and were difficult to reproduce.
Datadog’s Watchdog AI engine analyzed network and infrastructure telemetry in real time, correlating disconnection events with specific network conditions that were not visible through manual log inspection.
As a result of the collaboration, the company reported an 80% reduction in mean time to resolution.4
Dynamic scaling visibility in cloud environments
Cloud infrastructure does not stay static. Resources scale up and down in response to traffic, and the monitoring layer must keep pace. BARBRI’s Azure environment scaled rapidly during bar exam periods, and Dynatrace’s Davis AI extended monitoring coverage automatically as resources adjusted. When issues occurred during peak periods, the platform provided real-time root cause analysis rather than requiring engineers to piece together data after the fact.
Real-life example: BARBRI and Dynatrace Davis AI
BARBRI provides bar exam preparation courses to law school graduates across the United States. After migrating from on-premises servers to Azure, BARBRI faced a monitoring challenge with no on-premises equivalent: during exam registration and exam periods, thousands of students log in simultaneously, placing extreme, time-compressed demand on the cloud infrastructure that must scale and return to baseline within days.
Manual monitoring could not keep up with the dynamic scaling environment. Engineers lacked visibility into how services behaved as Azure resources changed, making it difficult to diagnose issues when reliability mattered most.
BARBRI deployed Dynatrace with its Davis AI engine integrated into Azure Monitor. Davis learned BARBRI’s typical traffic patterns and automatically extended monitoring as the Azure environment scaled during peak periods.5
Figure 2: Dynatrace Davis AI User Interface1
Anomaly detection
Traditional monitoring requires engineers to set alert thresholds for every metric they want to watch. AI-driven tools instead build a continuous baseline of normal behavior and flag deviations, including failure modes no one thought to alert on.
Real-life example: LivePerson and Anodot
LivePerson runs a conversational AI platform serving global enterprise customers. The company monitors nearly two million metrics every 30 seconds across data centers worldwide.
By the time engineers identified anomalies through manual review, customers had been affected. The team needed a system that could detect deviations across millions of data points faster than any human review cycle.
Anodot’s real-time AI analytics engine automatically identifies deviations from expected patterns and alerts engineers to emerging issues before they reach customers.
As a result, the company maintained 24/7 uptime, catching problems before customers file complaints. The team shifted from reactive incident response to proactive issue detection.6
Cite this research
Pick the format that matches where you're publishing. Pasting the link version into your CMS preserves the backlink.
@misc{dilmegani2026,
  author = {Dilmegani, Cem and Ermut, Sıla},
  title  = {{Top 5 AI Network Monitoring Tools & Real Life Examples}},
  year   = {2026},
  month  = aug,
  howpublished    = {\url{https://aimultiple.com/ai-network-monitoring}},
  note   = {AIMultiple. Retrieved August 21, 2026}
}Results and timestamps of 5 data points. Download the summary data shown in this article's charts and tables as a ZIP file containing one CSV file.
Want the granular data behind it? Join Premium
Changelog
8 updatesRemoved the AI Use Cases in Network Monitoring section.
Updated the Datadog and HPE Mist AI product descriptions.
Reference Links
Cem's work at AIMultiple has been cited by leading global publications including Business Insider, Forbes, Morning Brew, and Washington Post, global firms like Deloitte and HPE, NGOs like World Economic Forum, and supranational organizations like European Commission. [1], [2], [3], [4], [5]
Throughout his career, Cem served as a tech consultant, tech buyer and tech entrepreneur. He advised enterprises on their technology decisions at McKinsey & Company and Altman Solon for more than a decade. He also published a McKinsey report on digitalization.
He led technology strategy and procurement of a telco while reporting to the CEO. He has also led commercial growth of deep tech company Hypatos that reached a 7 digit annual recurring revenue and a 9 digit valuation from 0 within 2 years. Cem's work in Hypatos was covered by leading technology publications like TechCrunch and Business Insider.
Cem regularly speaks at international technology conferences. He graduated from Bogazici University as a computer engineer and holds an MBA from Columbia Business School.

She previously worked as a recruiter in project management and consulting firms. Sıla holds a Master of Science degree in Social Psychology and a Bachelor of Arts degree in International Relations.



Be the first to comment
Your email address will not be published. All fields are required. Comments are left in their original language.