


Las 10 mejores plataformas AIOps comparadas

Las plataformas AIOps aplican aprendizaje automático y TI agéntica a tareas de operaciones de TI como la detección de anomalías, la correlación de eventos y el análisis de causa raíz. Hemos comparado las 10 mejores plataformas AIOps según sus funciones clave y diferenciadoras, sus planes de precios y sus principales casos de uso.
Funciones principales de las plataformas AIOps
Producto | Detección de anomalías con ML | Corrección automatizada | Correlación de eventos / reducción de ruido | RCA automatizado / con IA | Analítica predictiva |
|---|---|---|---|---|---|
Limitado | ✓ | Limitado | Limitado | Limitado | |
BigPanda | Limitado | Limitado | ✓ | ✓ | Limitado |
Datadog | ✓ | ✓ | ✓ | ✓ | Limitado |
Dynatrace | ✓ | ✓ | ✓ | ✓ | ✓ |
IBM Instana | ✓ | Limitado | ✓ | ✓ | Limitado |
LogicMonitor | ✓ | Limitado | ✓ | ✓ | ✓ |
New Relic | ✓ | Limitado | ✓ | ✓ | Limitado |
OpenText OpsBridge | ✓ | ✓ | ✓ | ✓ | ✓ |
Splunk ITSI | ✓ | ✓ | ✓ | ✓ | ✓ |
Zenoss Cloud | ✓ | Limitado | ✓ | ✓ | ✓ |
Nota: todas las tablas están ordenadas alfabéticamente. Nuestros suscriptores aparecen primero.
Funciones diferenciadoras de las herramientas AIOps
Las 10 mejores plataformas AIOps comparadas
NinjaOne
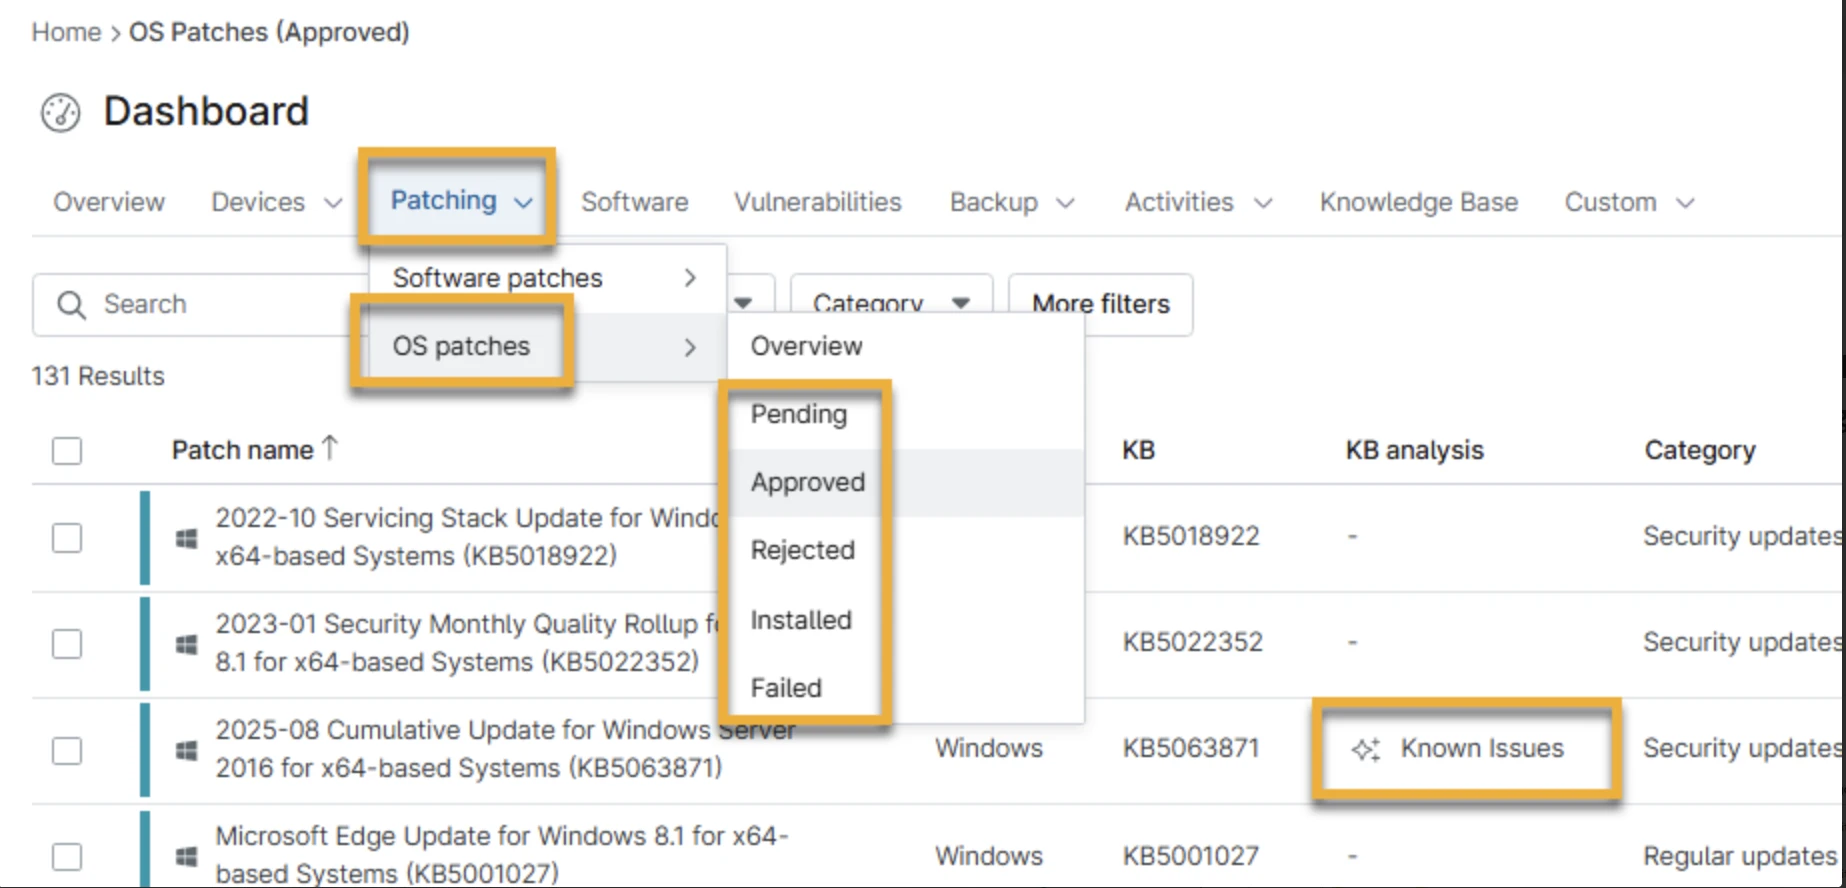
Patch Intelligence IA de NinjaOne combina IA generativa, información de parches de terceros y telemetría anonimizada de fallos/reversiones de NinjaOne. Reevalúa el estado de los parches cada seis horas y puede cambiar automáticamente un parche aprobado a Manual o Rechazar cuando detecta problemas conocidos o tasas elevadas de fallos/reversiones.
Katana IA, que está en acceso anticipado, es un agente integrado en el producto con RBAC y un interruptor de apagado.
Figura 1: imagen que muestra cómo aparecen los datos de Patch Intelligence IA en la columna KB Analysis dentro de Patching.
BigPanda
El L1 Agent de BigPanda ejecuta runbooks predefinidos del cliente mediante un worker en contenedores local. El worker establece conexiones mTLS salientes, no mantiene credenciales permanentes, obtiene credenciales de corta duración a través de un rol de servicio definido por el cliente y ejecuta flujos de trabajo preregistrados. Los pasos de diagnóstico de solo lectura pueden ejecutarse sin aprobación; las acciones correctivas, como reiniciar un servicio, requieren aprobación explícita.
Datadog
Bits Investigation de Datadog ejecuta un ciclo iterativo: formula una hipótesis de causa raíz, consulta la telemetría, evalúa la evidencia y luego revisa o descarta hipótesis.
Puede inspeccionar métricas, registros, trazas, estado de monitores, RUM, Synthetics, dependencias de servicios, incidentes, paneles y fuentes externas como Confluence. La interfaz registra la investigación tanto como un registro cronológico de pasos como un árbol de hipótesis.
Dynatrace
Dynatrace almacena su topología Smartscape como nodos y relaciones en Grail. DQL puede buscar en esta topología y seguir las relaciones entre servicios, procesos, hosts, recursos en la nube y componentes de Kubernetes.
Davis, de Dynatrace, correlaciona los eventos que comparten una causa raíz inferida en un único problema y almacena la entidad Smartscape de causa raíz identificada, además de las entidades afectadas. Como Grail almacena la topología junto con registros, spans, métricas y eventos, las consultas DQL pueden recorrer dependencias y enriquecer la telemetría con el contexto de las entidades.
IBM Instana
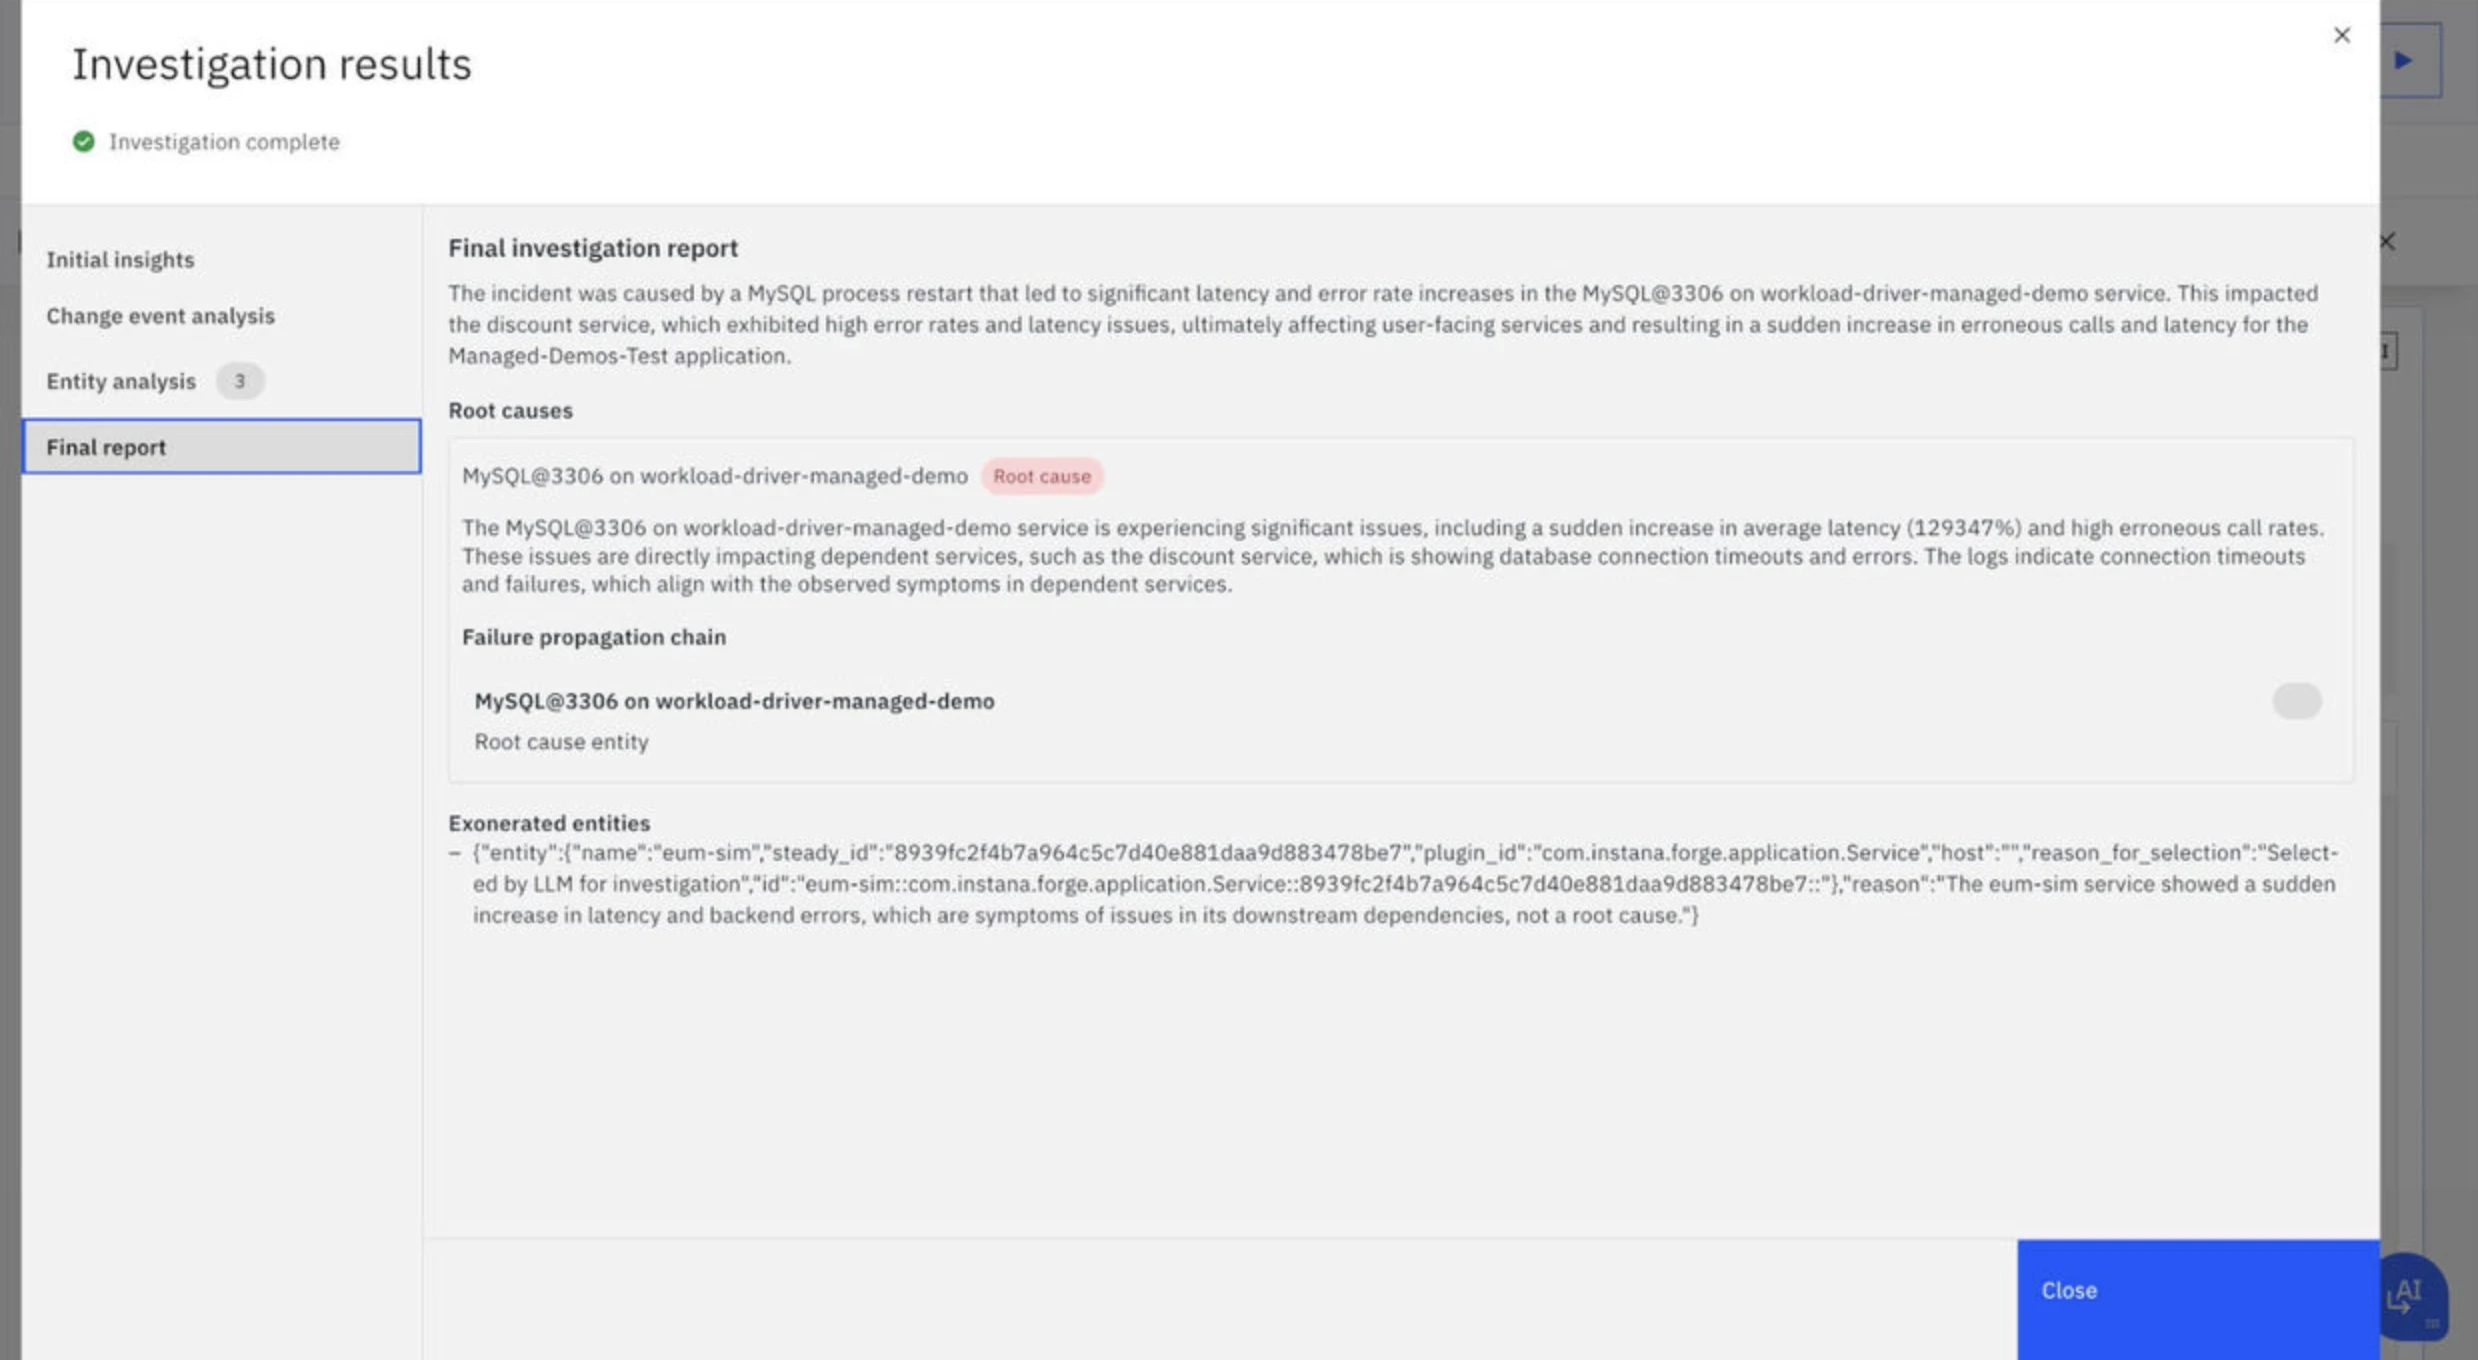
Intelligent Incident Investigation de Instana crea y prueba hipótesis frente al entorno monitorizado. La investigación registra qué hipótesis probó, qué evidencia recopiló y qué componentes inspeccionó.
Una vez aceptada una causa, Instana puede generar un runbook de corrección paso a paso y producir un script de Bash o un playbook de Ansible para pasos de corrección individuales, y luego lo exporta para su revisión e implementación.
Figura 2: panel de investigación de IA agéntica de IBM Instana.1
LogicMonitor
Edwin IA Investigation de LogicMonitor consume alertas, métricas, registros, solicitudes de cambio, resultados de diagnóstico y salidas de remediación para construir una cronología del incidente, un análisis de impacto y la causa probable.
Edwin correlaciona las alertas en «Insights», y su agente puede operar tanto de forma global como en el contexto de una alerta/Insight específica. El sistema de investigación trabaja sobre los objetos de incidente correlacionados de LogicMonitor y sus metadatos asociados.
New Relic
El servidor MCP de New Relic da a agentes de IA externos acceso a funciones específicas de observabilidad. Las herramientas disponibles incluyen convertir preguntas en lenguaje natural a NRQL, generar informes de alertas e impacto en el usuario, analizar el impacto de los despliegues, buscar trazas, detectar trazas anómalas y mapear las dependencias de servicios ascendentes y descendentes.
OpenText OpsBridge
Para las operaciones de TI, Aviator de OpenText puede funcionar con los productos de observabilidad, gestión de servicios, automatización, CMDB y gestión de activos de OpenText.
OpenText también ofrece Aviator Studio para crear y desplegar agentes personalizados, mientras que Service Management Aviator gestiona flujos de trabajo privados de IA generativa para casos de uso de soporte y gestión de servicios.
Splunk ITSI
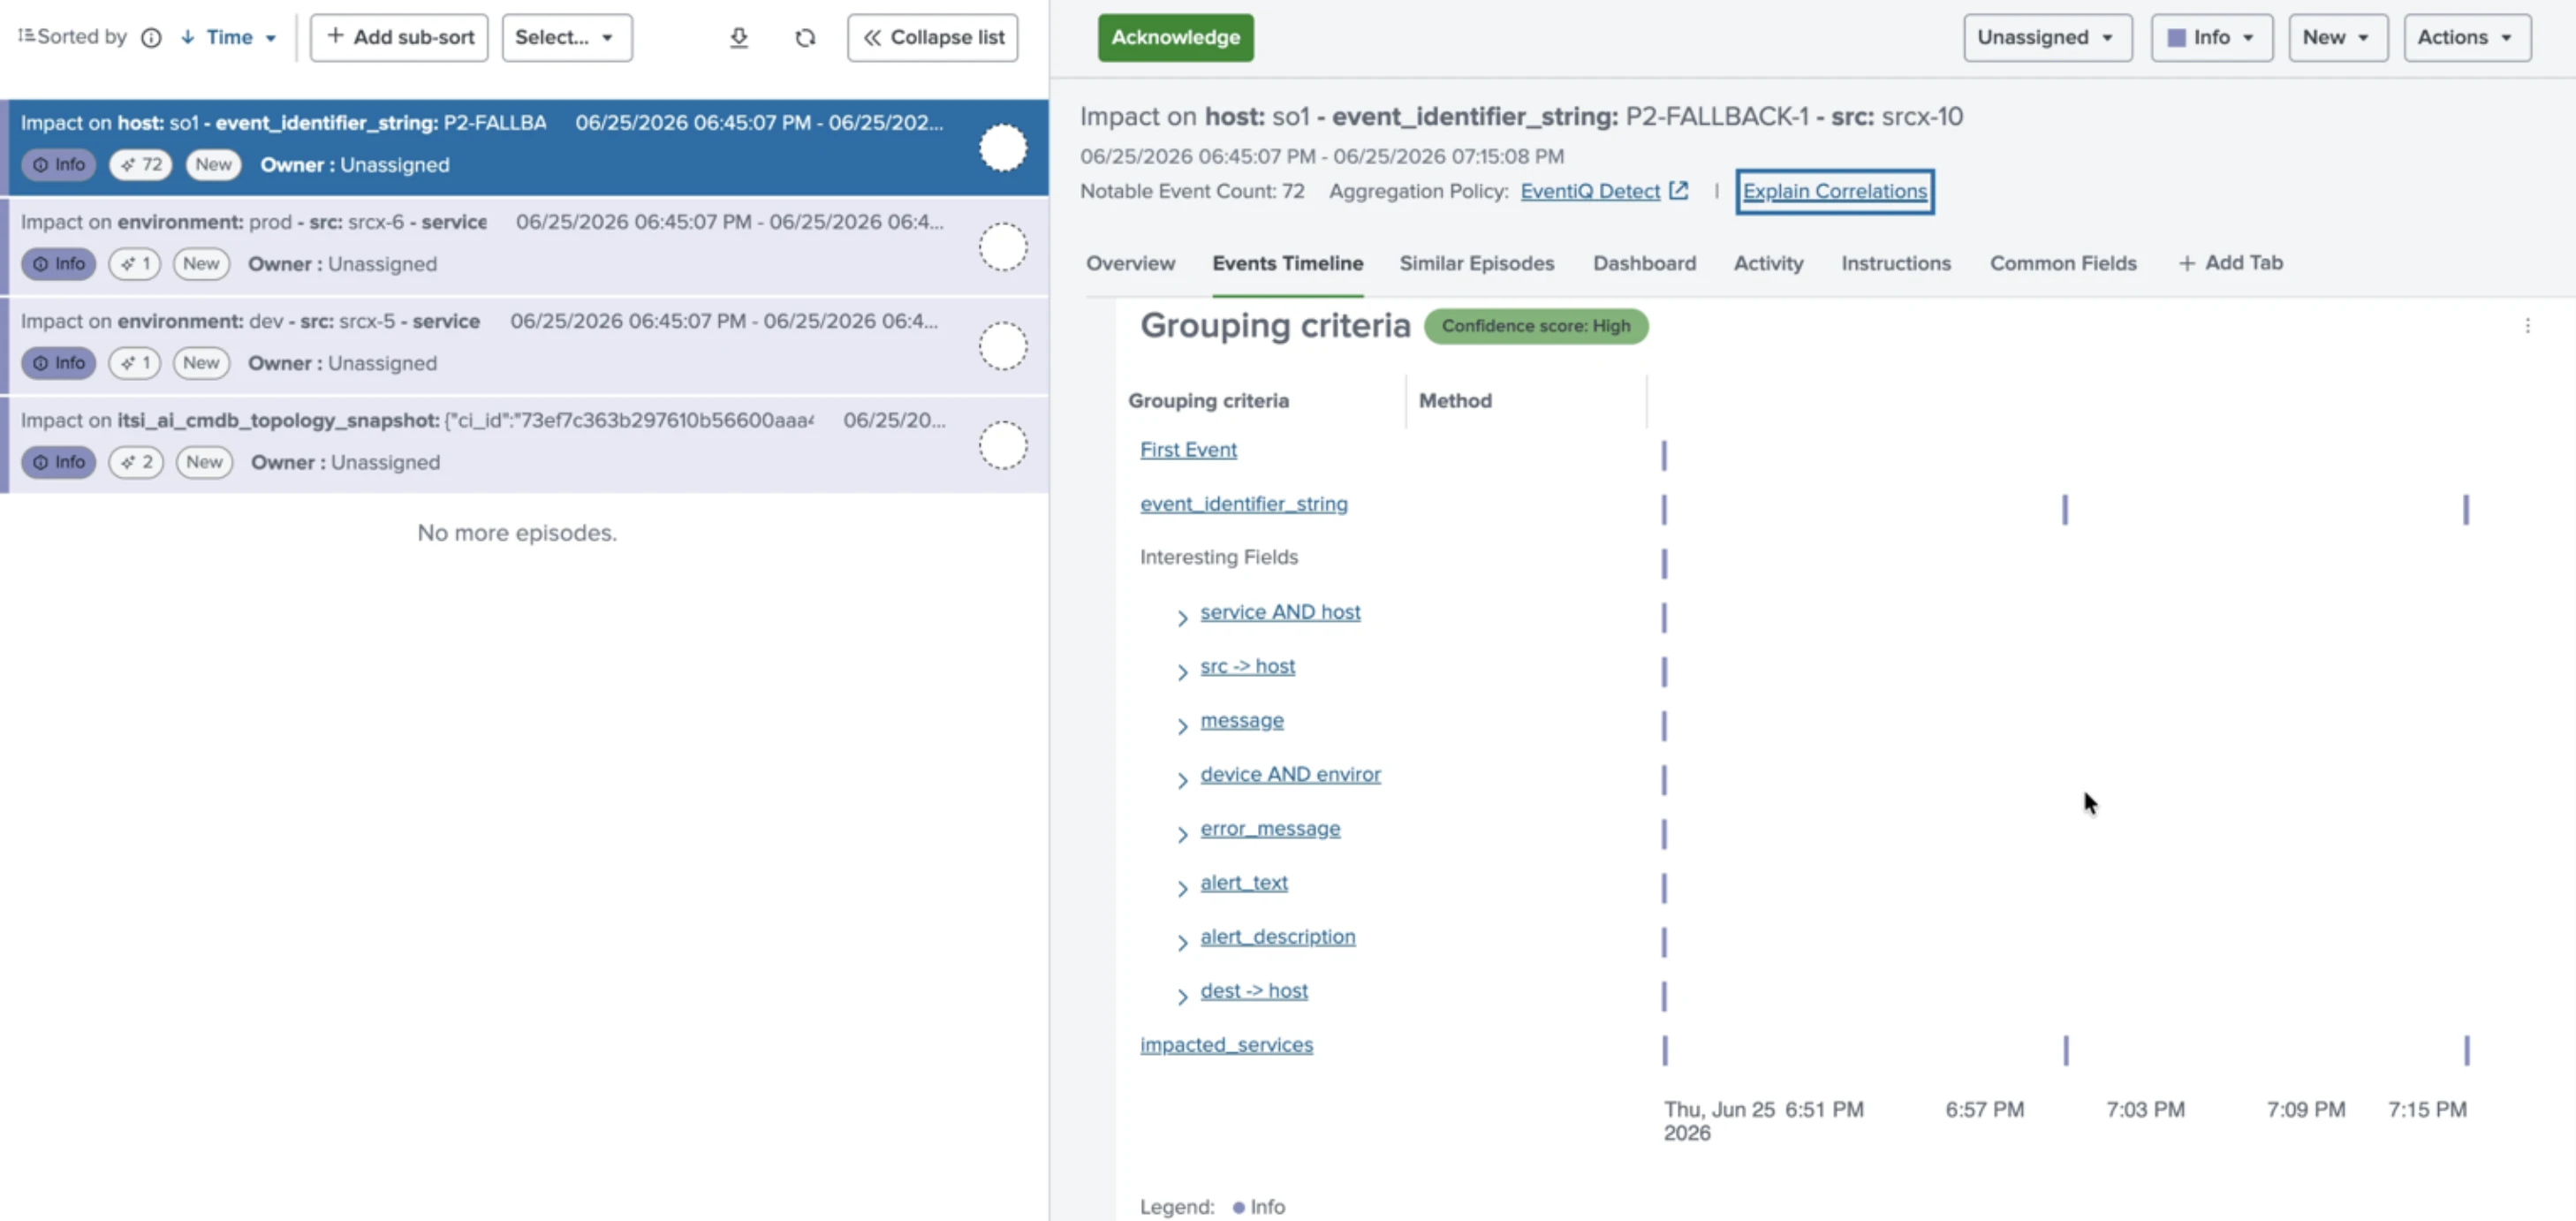
Event iQ Detect analiza datos históricos de eventos notables para recomendar qué campos deben usarse para agrupar alertas en episodios.
La correlación actual admite coincidencia exacta, coincidencia normalizada, extracción de patrones, coincidencia aproximada, similitud semántica, topología de servicios compartida y relaciones CMDB padre/hijo. La similitud semántica utiliza umbrales de confianza configurables, mientras que las políticas de agregación pueden clasificar campos y combinarlos con lógica AND/OR.
Figura 3: ejemplo de agrupación de alertas de Event iQ Detect en ITSI.2
Zenoss Cloud
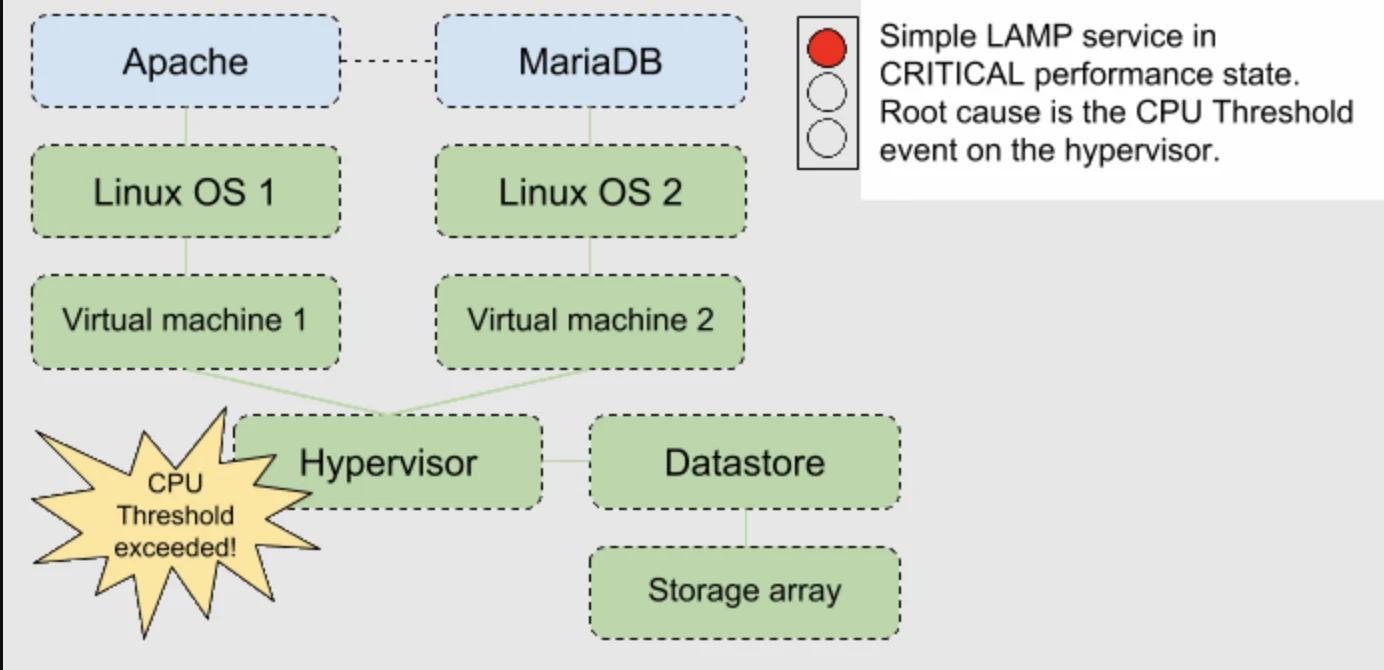
Zenoss Service Impact mantiene un modelo de dependencias que vincula los servicios con la infraestructura de la que dependen: por ejemplo, procesos de aplicación → SO → VM → hipervisor → almacén de datos/almacenamiento. El modelo se actualiza cuando la infraestructura monitorizada se mueve o cambia.
Cuando una dependencia genera un evento de estado o de umbral, Service Impact propaga su efecto a través del modelo de dependencias y puede identificar el evento de infraestructura subyacente responsable del estado a nivel de servicio.
Figura 4: ejemplo de un evento de hipervisor de Zenoss Service Impact.3
Casos de uso de AIOps con ejemplos reales
Detección de Anomaly
La detección de Anomaly señala desviaciones del comportamiento normal antes de que se produzcan interrupciones. Watchdog de Datadog calcula de forma proactiva una línea base del comportamiento esperado y detecta patrones anómalos sin configurar alertas manualmente, mirando hasta tres semanas atrás para tener en cuenta la estacionalidad.
Watchdog también analiza los registros ingeridos en el momento de la entrada en busca de patrones anómalos, como aumentos repentinos del estado de advertencia o error.4
Análisis automatizado de causa raíz
El análisis automatizado de causa raíz rastrea un incidente hasta el fallo que lo originó en sistemas distribuidos. El motor de causalidad Davis IA de Dynatrace recopila todas las trazas distribuidas a lo largo de la pila horizontal cuando se activa un evento y continúa el análisis automáticamente cuando un servicio llamado también se marca como no saludable.5
Reducción del ruido de alertas
La reducción del ruido de alertas agrupa alertas relacionadas para disminuir la fatiga operativa. Intelligent Alert Grouping de PagerDuty consolida alertas relacionadas en un único incidente mediante aprendizaje automático.6
BigPanda aplica mecanismos de deduplicación exacta, temporal y basada en patrones para fusionar alertas en incidentes.7
Monitorización del estado de la infraestructura
La monitorización predictiva del estado de la infraestructura se centra en endpoints y dispositivos. NinjaOne ofrece visibilidad en tiempo real de métricas a nivel de dispositivo, como la carga de CPU, la utilización de memoria y el estado del disco, con alertas basadas en umbrales que se activan antes de que los usuarios finales informen de problemas.
Corrección asistida por IA
La corrección automatizada o asistida por IA pasa de la detección a la acción. Dynatrace Davis CoPilot for Workflows incorpora IA generativa para auto-resumir problemas, proponer pasos de corrección y editar de forma autónoma manifiestos de Kubernetes para el auto-escalado mediante automatizaciones de GitHub. 8
 Añadir como fuente preferida
Cita esta investigación
Elige el formato que se ajuste al lugar donde vas a publicar. Pegar la versión con enlace en tu CMS conserva el enlace de retroceso.
@misc{ermut2026,
  author = {Ermut, Sıla},
  title  = {{Las 10 mejores plataformas AIOps comparadas}},
  year   = {2026},
  month  = oct,
  howpublished    = {\url{https://aimultiple.com/aiops-platforms}},
  note   = {AIMultiple. Recuperado el 2 de octubre de 2026}
}Resultados y marcas de tiempo de 30 puntos de datos. Descargue los datos resumidos que se muestran en los gráficos y las tablas de este artículo como un archivo ZIP que contiene 3 archivos CSV.
¿Quieres los datos granulares que hay detrás? Únete a Premium
Enlaces de referencia
Anteriormente trabajó como reclutadora en empresas de gestión de proyectos y consultoría. Sıla tiene un máster en Psicología Social y una licenciatura en Relaciones Internacionales.
Siguiente para leer
Creación de agentes personales de IA + 18 plataformas y herramientas de agentes


Las 9 mejores plataformas de CRM agénticas
Comparar más de 20 plataformas y bibliotecas de IA responsable

Herramientas de agentes de IA: comparación de 15+ plataformas
Las mejores 10+ plataformas SOAR

Comparativa de las 10 mejores plataformas de orquestación de servicios

Sé el primero en comentar
Tu dirección de correo electrónico no será publicada. Todos los campos son obligatorios. Los comentarios se dejan en su idioma original.