


Comparatif des 10 meilleures plateformes AIOps

Les plateformes AIOps appliquent le machine learning et l'IT agentique aux tâches d'exploitation informatique telles que la détection d'anomalies, la corrélation d'événements et l'analyse des causes racines. Nous avons comparé les 10 meilleures plateformes AIOps selon leurs fonctionnalités clés et différenciantes, leurs tarifs et leurs principaux cas d'usage.
Fonctionnalités principales des plateformes AIOps
Produit | Détection d'anomalies par ML | Remédiation automatisée | Corrélation d'événements / réduction du bruit | RCA automatisée / par IA | Analyse prédictive |
|---|---|---|---|---|---|
Limitée | ✓ | Limitée | Limitée | Limitée | |
BigPanda | Limitée | Limitée | ✓ | ✓ | Limitée |
Datadog | ✓ | ✓ | ✓ | ✓ | Limitée |
Dynatrace | ✓ | ✓ | ✓ | ✓ | ✓ |
IBM Instana | ✓ | Limitée | ✓ | ✓ | Limitée |
LogicMonitor | ✓ | Limitée | ✓ | ✓ | ✓ |
New Relic | ✓ | Limitée | ✓ | ✓ | Limitée |
OpenText OpsBridge | ✓ | ✓ | ✓ | ✓ | ✓ |
Splunk ITSI | ✓ | ✓ | ✓ | ✓ | ✓ |
Zenoss Cloud | ✓ | Limitée | ✓ | ✓ | ✓ |
Remarque : tous les tableaux sont classés par ordre alphabétique. Nos abonnés sont listés en premier.
Fonctionnalités différenciantes des outils AIOps
Comparatif des 10 meilleures plateformes AIOps
NinjaOne
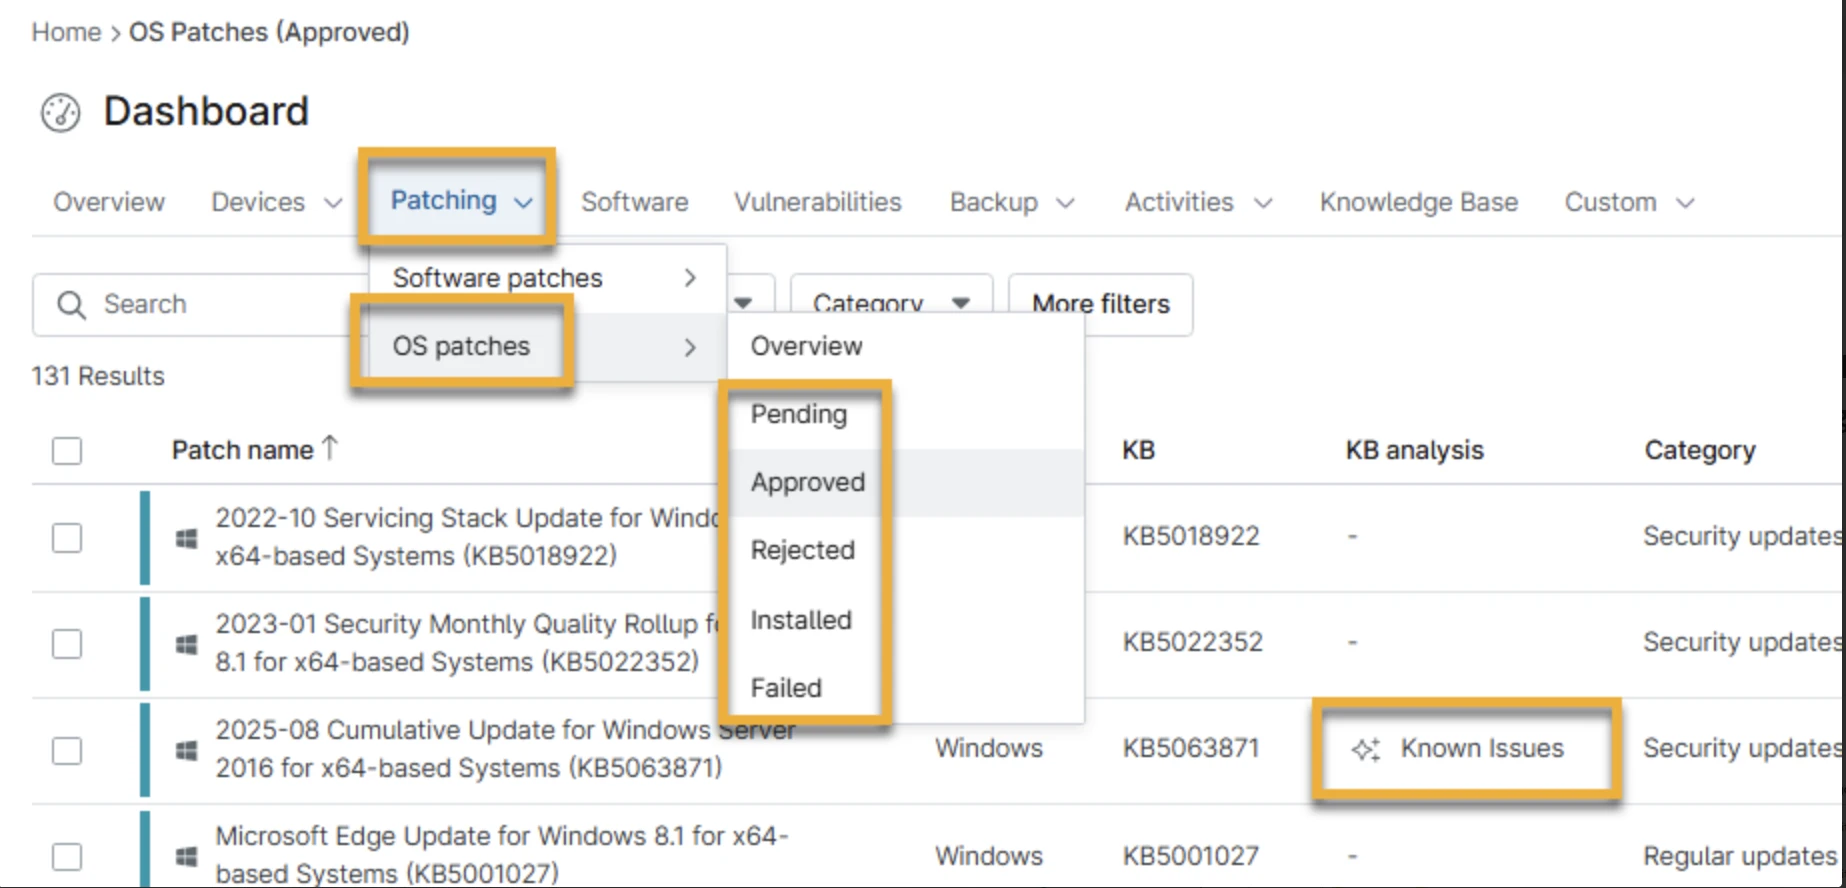
Patch Intelligence IA de NinjaOne combine l'IA générative, les informations de correctifs tierces et la télémétrie anonymisée des échecs et retours en arrière de NinjaOne. Il réévalue l'état des correctifs toutes les six heures et peut automatiquement faire passer un correctif approuvé en mode Manuel ou Rejeté lorsqu'il détecte des problèmes connus ou des taux d'échec/de retour en arrière élevés.
Katana IA, en accès anticipé, est un agent intégré au produit doté d'un RBAC et d'un kill switch.
Figure 1 : image montrant comment les données de Patch Intelligence IA apparaissent dans la colonne KB Analysis sous Patching.
BigPanda
L'agent L1 de BigPanda exécute des runbooks clients prédéfinis via un worker conteneurisé sur site. Le worker établit des connexions mTLS sortantes, ne conserve aucun identifiant permanent, obtient des identifiants à courte durée de vie via un rôle de service défini par le client et exécute des workflows préenregistrés. Les étapes de diagnostic en lecture seule peuvent s'exécuter sans approbation ; les actions correctives, comme le redémarrage d'un service, nécessitent une approbation explicite.
Datadog
Bits Investigation de Datadog exécute une boucle itérative : formuler une hypothèse de cause racine, interroger la télémétrie, évaluer les preuves, puis réviser ou écarter les hypothèses.
Il peut inspecter les métriques, journaux, traces, états des moniteurs, RUM, Synthetics, dépendances de services, incidents, tableaux de bord et sources externes comme Confluence. L'interface enregistre l'investigation à la fois sous forme de journal chronologique des étapes et d'arbre d'hypothèses.
Dynatrace
Dynatrace stocke sa topologie Smartscape sous forme de nœuds et de relations dans Grail. DQL permet de rechercher dans cette topologie et de suivre les relations entre services, processus, hôtes, ressources cloud et composants Kubernetes.
Davis de Dynatrace corrèle les événements partageant une cause racine déduite en un seul problème et enregistre l'entité Smartscape de cause racine identifiée ainsi que les entités affectées. Comme Grail stocke la topologie avec les journaux, spans, métriques et événements, les requêtes DQL peuvent parcourir les dépendances et enrichir la télémétrie avec le contexte des entités.
IBM Instana
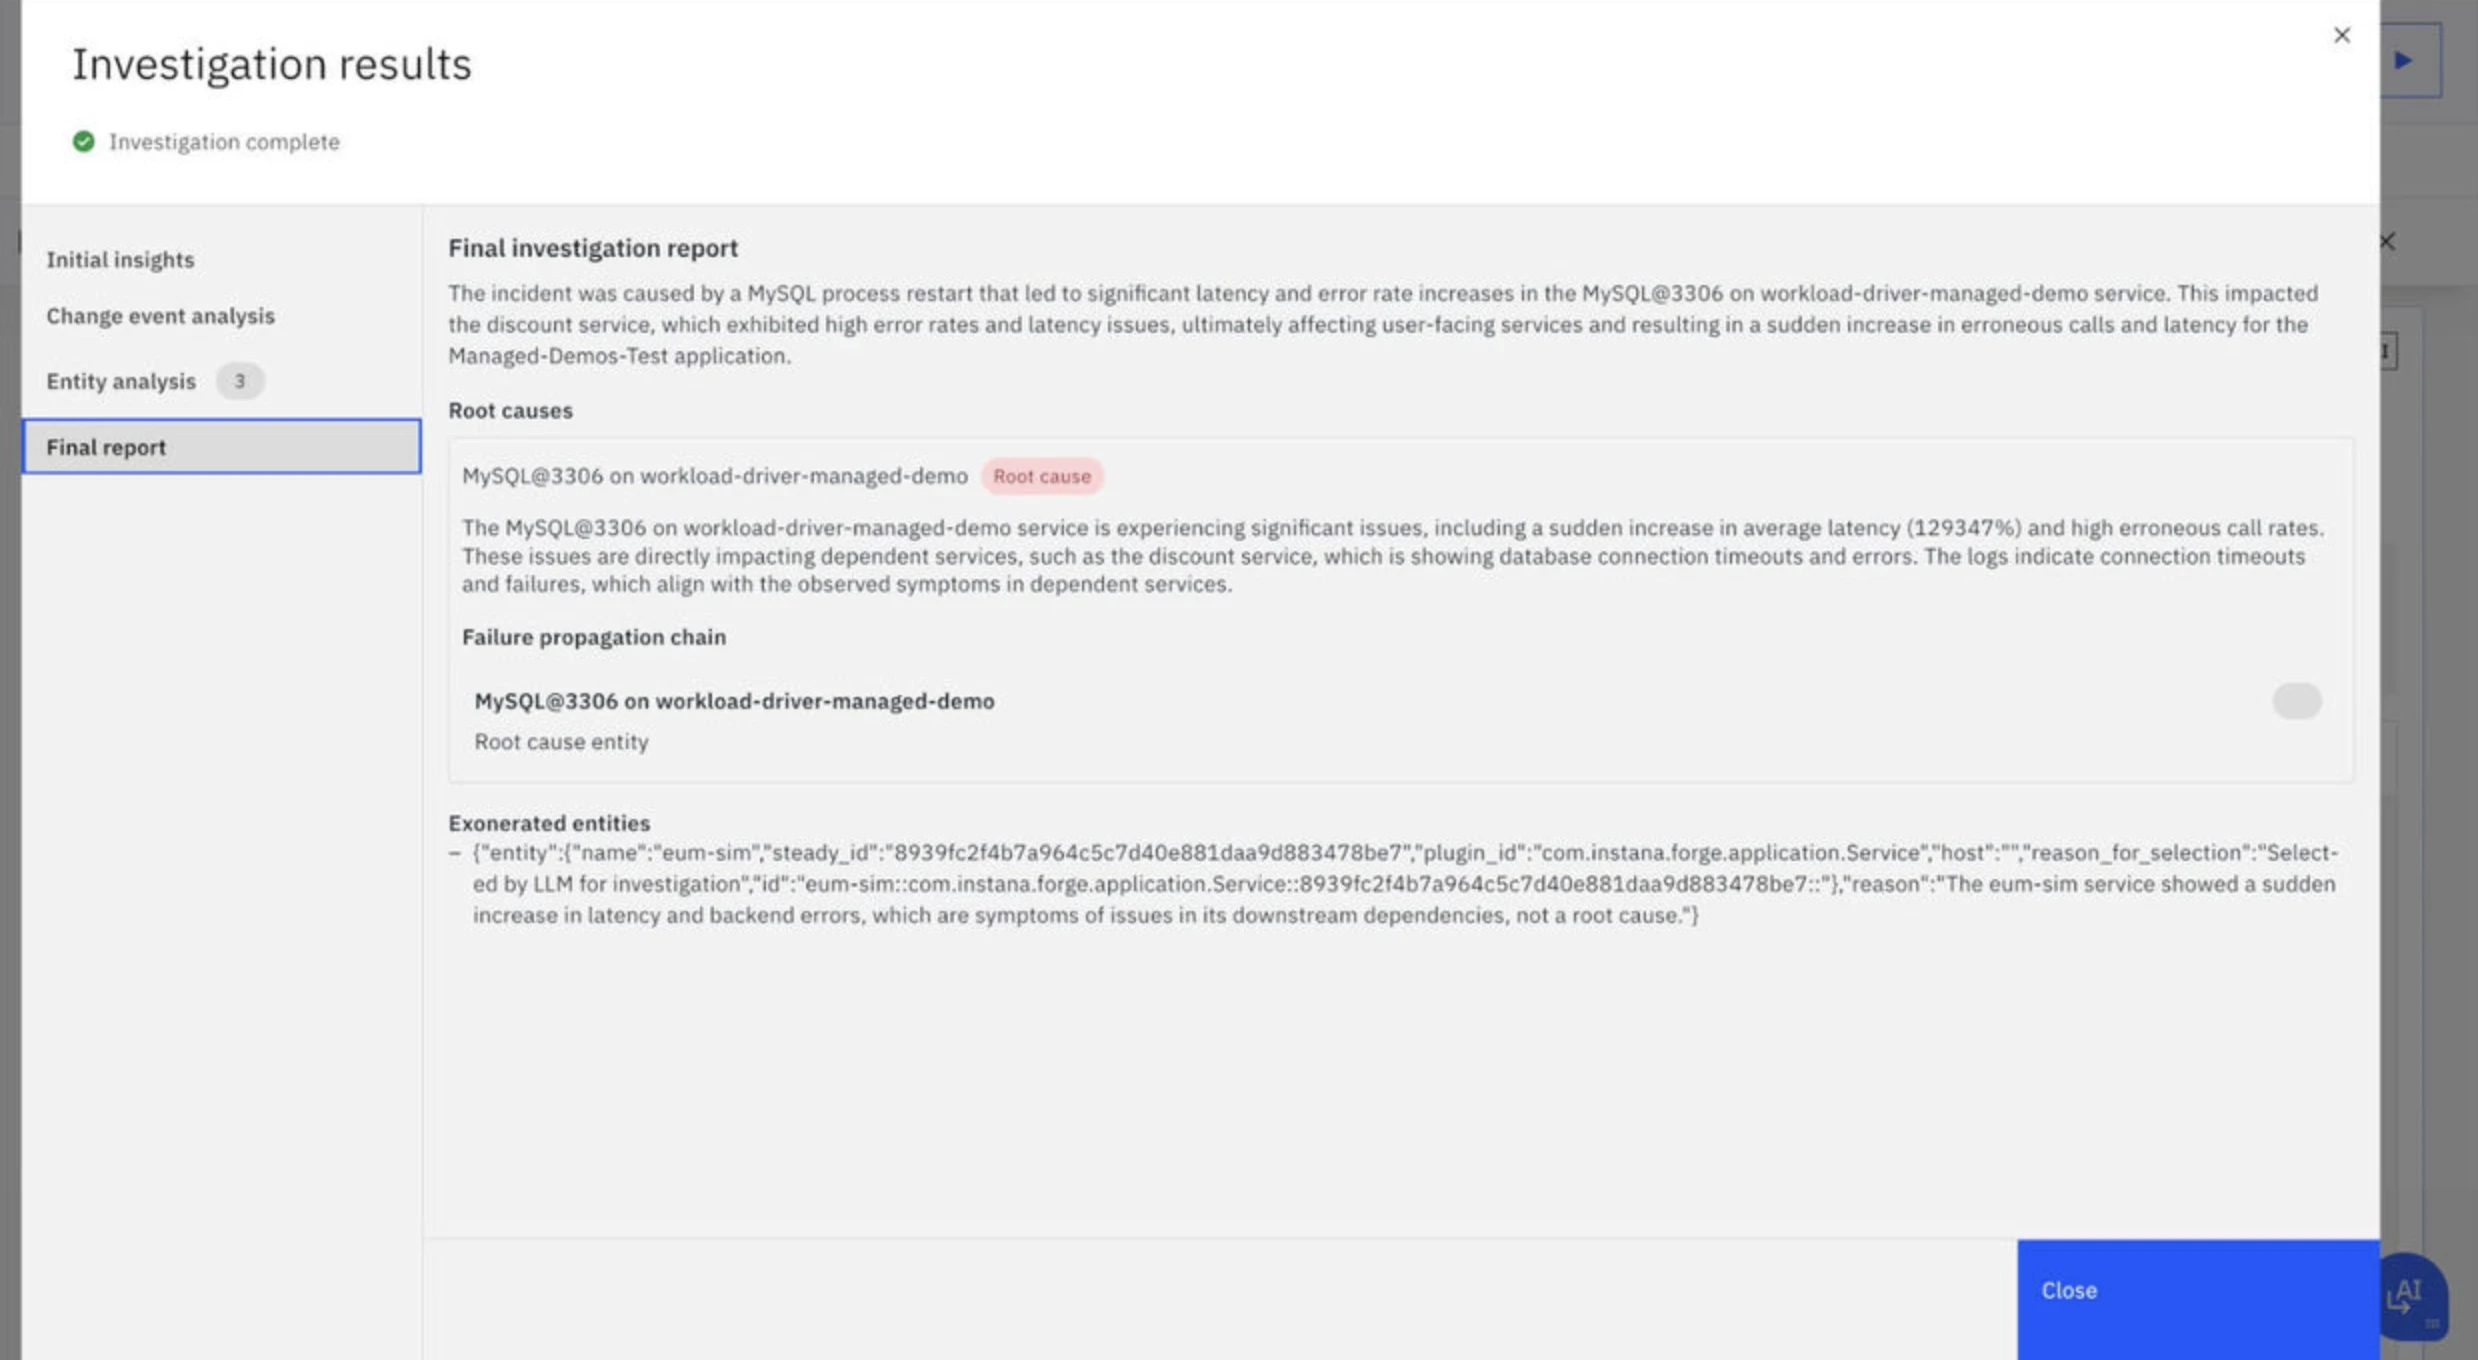
Intelligent Incident Investigation d'Instana crée et teste des hypothèses sur l'environnement supervisé. L'investigation consigne les hypothèses testées, les preuves recueillies et les composants inspectés.
Une fois la cause acceptée, Instana peut générer un runbook de remédiation étape par étape et produire un script Bash ou un playbook Ansible pour chaque étape de remédiation, puis l'exporte pour relecture et déploiement.
Figure 2 : tableau de bord d'investigation IBM Instana Agentic IA.1
LogicMonitor
Edwin IA Investigation de LogicMonitor exploite les alertes, métriques, journaux, demandes de changement, résultats de diagnostic et sorties de remédiation pour construire une chronologie de l'incident, une analyse d'impact et une cause probable.
Edwin corrèle les alertes en « Insights », et son agent peut fonctionner soit globalement, soit dans le contexte d'une alerte/Insight spécifique. Le système d'investigation travaille sur les objets d'incident corrélés de LogicMonitor et leurs métadonnées associées.
New Relic
Le serveur MCP de New Relic donne à des agents IA externes l'accès à des fonctions d'observabilité spécifiques. Les outils disponibles permettent notamment de convertir des questions en langage naturel en NRQL, de générer des rapports d'alertes et d'impact utilisateur, d'analyser l'impact des déploiements, de rechercher des traces, de détecter les traces anormales et de cartographier les dépendances de services en amont et en aval.
OpenText OpsBridge
Pour l'exploitation informatique, Aviator d'OpenText peut fonctionner avec les produits OpenText d'observabilité, de gestion des services, d'automatisation, de CMDB et de gestion des actifs.
OpenText propose également Aviator Studio pour créer et déployer des agents personnalisés, tandis que Service Management Aviator gère des workflows d'IA générative privés pour les cas d'usage de support et de gestion des services.
Splunk ITSI
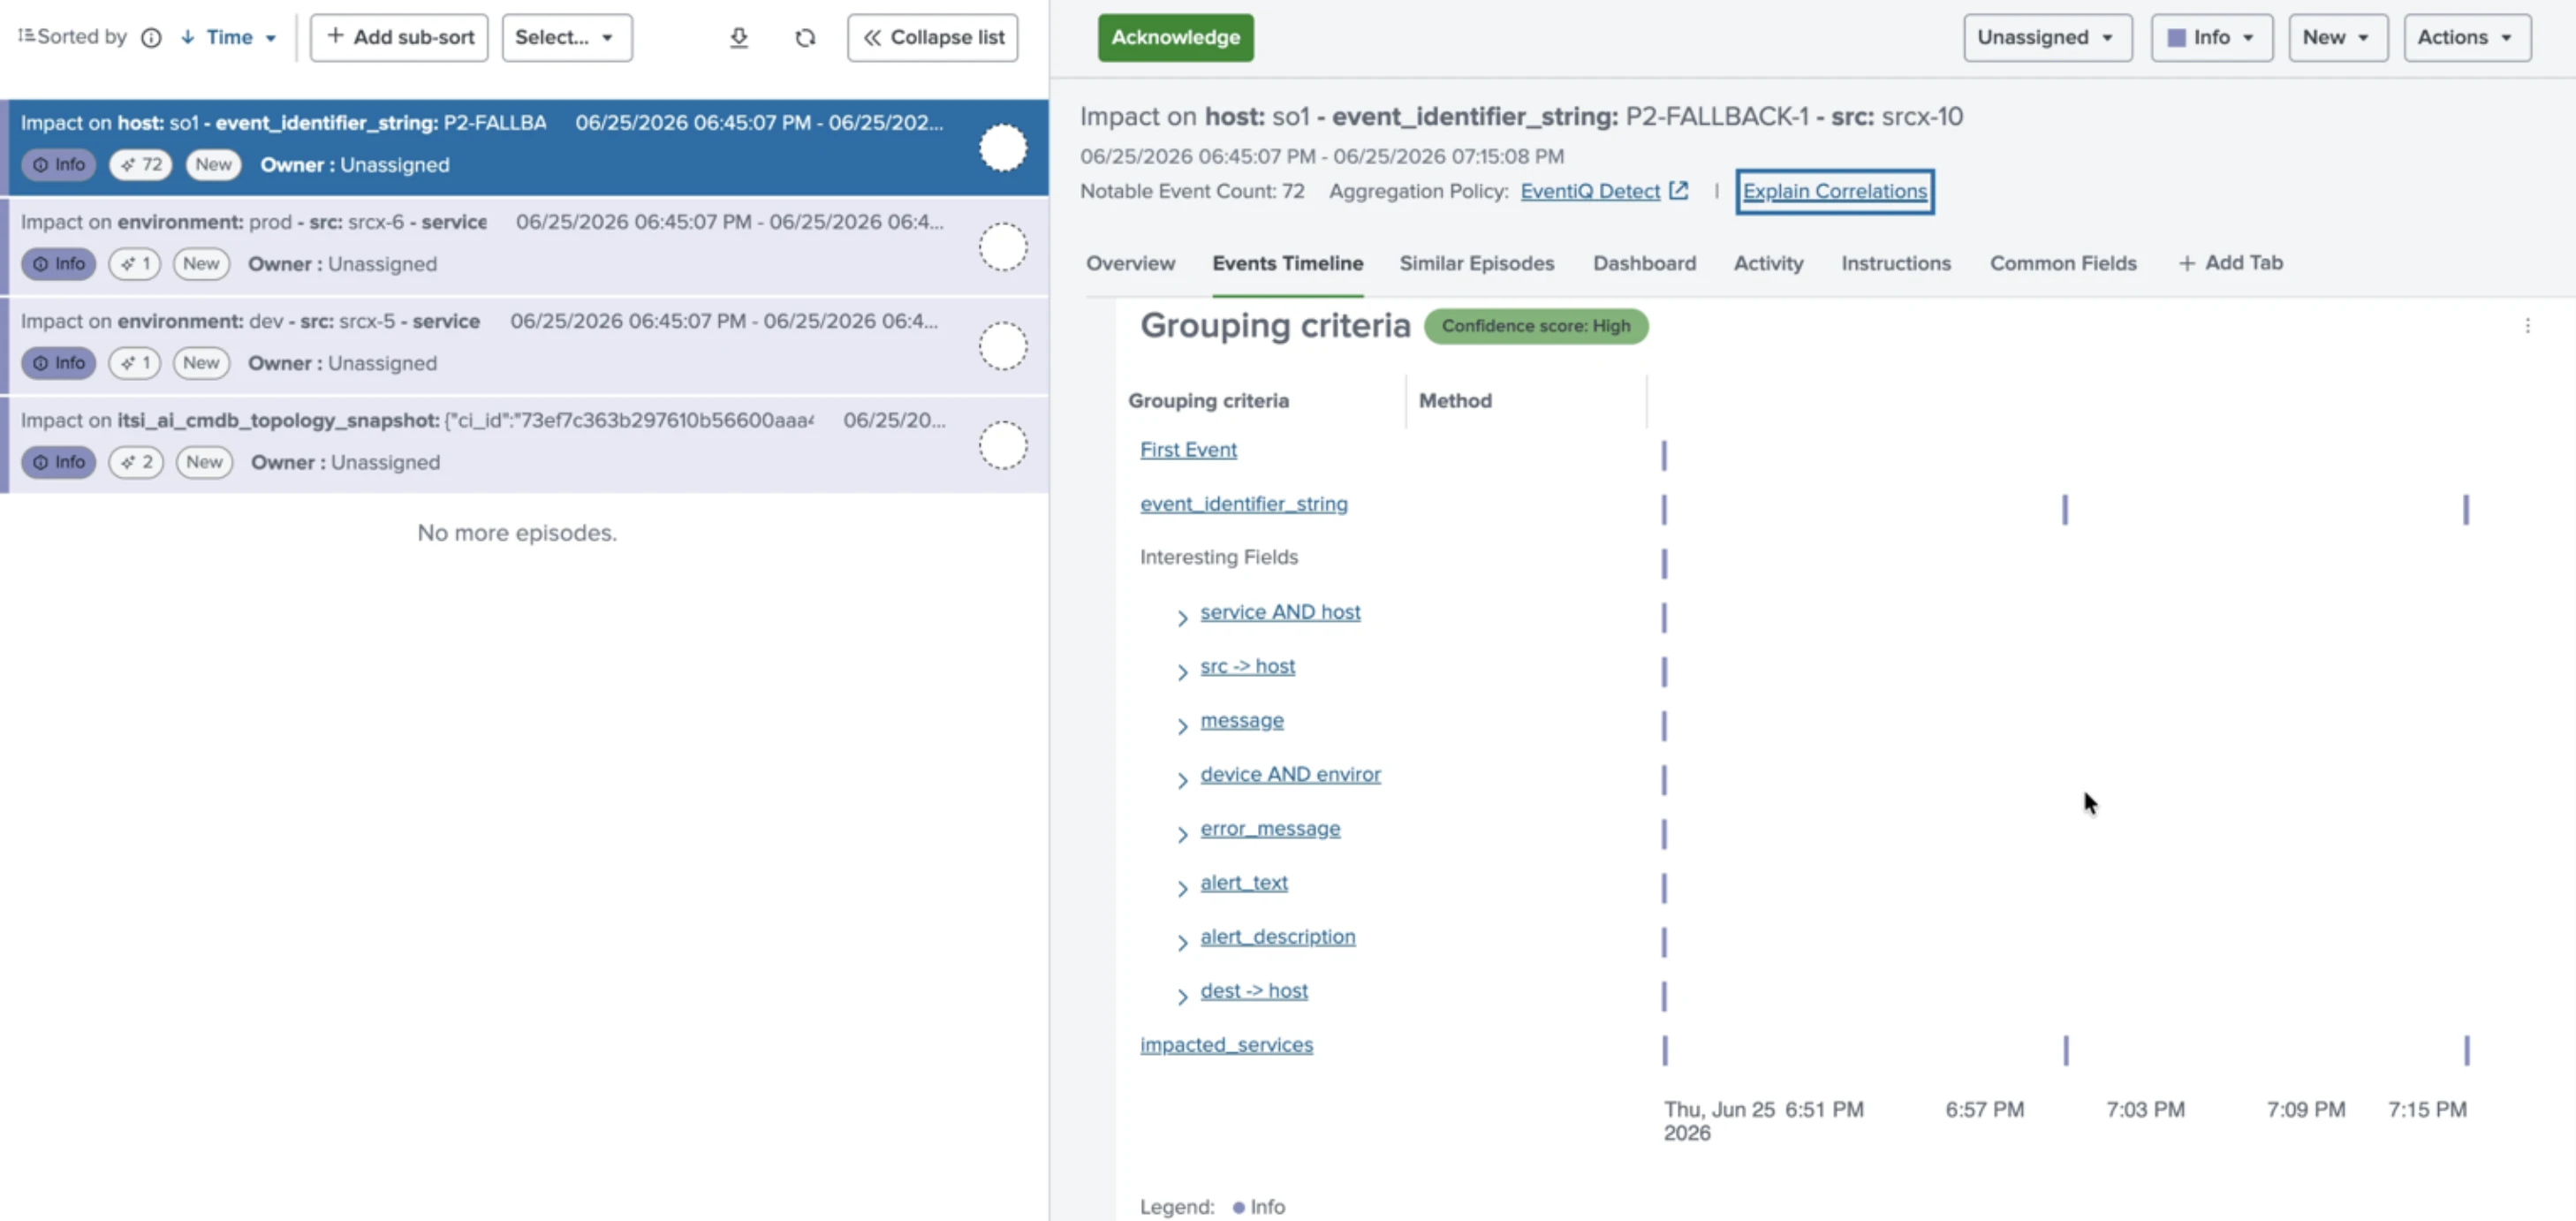
Event iQ Detect analyse l'historique des événements notables pour recommander les champs à utiliser afin de regrouper les alertes en épisodes.
La corrélation actuelle prend en charge la correspondance exacte, la correspondance normalisée, l'extraction de motifs, la correspondance floue, la similarité sémantique, la topologie de services partagée et les relations parent/enfant de la CMDB. La similarité sémantique utilise des seuils de confiance configurables, tandis que les politiques d'agrégation peuvent classer les champs et les combiner avec une logique AND/OR.
Figure 3 : exemple de regroupement d'alertes avec Event iQ Detect dans ITSI.2
Zenoss Cloud
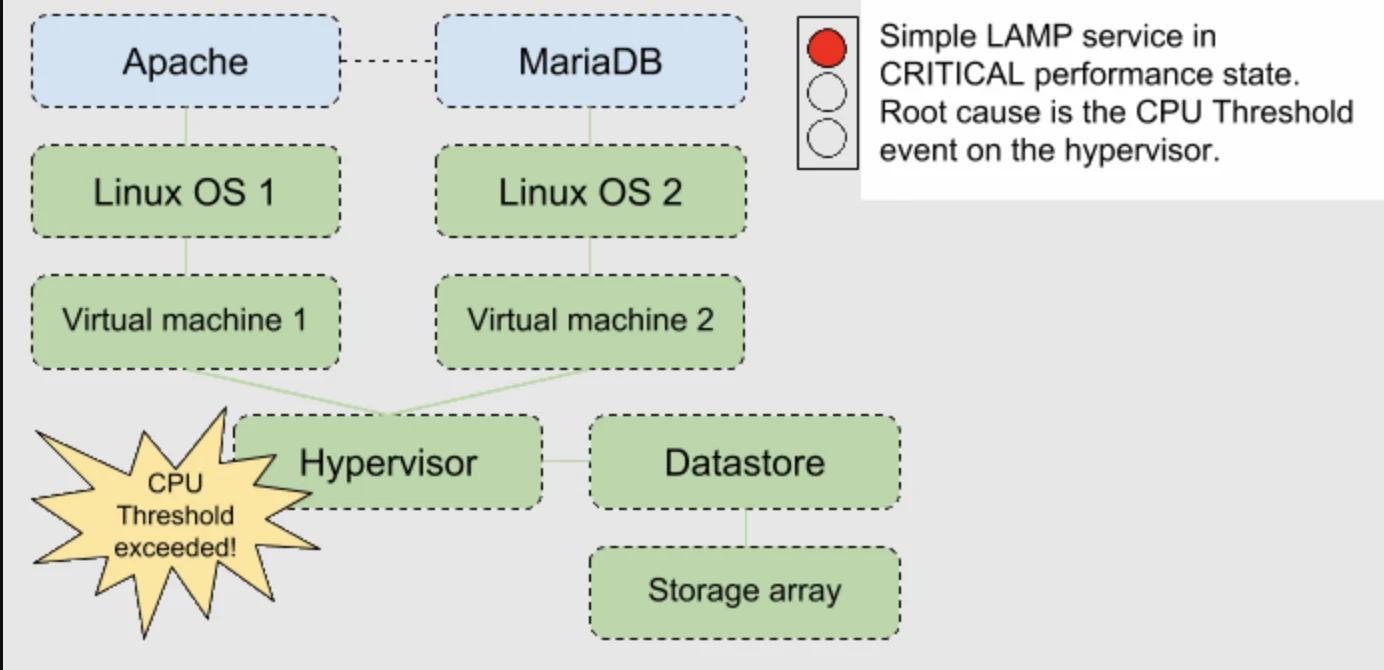
Zenoss Service Impact maintient un modèle de dépendances reliant les services à l'infrastructure dont ils dépendent : par exemple, processus applicatifs → OS → VM → hyperviseur → datastore/stockage. Le modèle est mis à jour lorsque l'infrastructure supervisée se déplace ou change.
Lorsqu'une dépendance génère un événement d'état ou de seuil, Service Impact propage son effet à travers le modèle de dépendances et peut identifier l'événement d'infrastructure sous-jacent responsable de l'état au niveau du service.
Figure 4 : exemple d'événement d'hyperviseur dans Zenoss Service Impact.3
Cas d'usage de l'AIOps avec des exemples concrets
Détection d'Anomaly
La détection d'Anomaly signale les écarts par rapport au comportement normal avant que les pannes ne surviennent. Watchdog de Datadog calcule de manière proactive une base de référence du comportement attendu et détecte les schémas anormaux sans configuration manuelle des alertes, en remontant jusqu'à trois semaines pour tenir compte de la saisonnalité.
Watchdog analyse également les journaux ingérés dès leur réception pour y repérer des schémas anormaux, comme une hausse soudaine des statuts d'avertissement ou d'erreur.4
Analyse automatisée des causes racines
L'analyse automatisée des causes racines remonte d'un incident jusqu'à la défaillance d'origine dans les systèmes distribués. Le moteur de causalité Davis IA de Dynatrace collecte toutes les traces distribuées le long de la pile horizontale lorsqu'un événement se déclenche, et poursuit l'analyse automatiquement lorsqu'un service appelé est lui aussi marqué comme défaillant.5
Réduction du bruit des alertes
La réduction du bruit des alertes regroupe les alertes liées pour limiter la fatigue opérationnelle. Intelligent Alert Grouping de PagerDuty consolide les alertes liées en un seul incident grâce au machine learning.6
BigPanda applique des mécanismes de déduplication exacte, temporelle et fondée sur des motifs pour fusionner les alertes en incidents.7
Surveillance de l'état de l'infrastructure
La surveillance prédictive de l'état de l'infrastructure cible les terminaux et les appareils. NinjaOne offre une visibilité en temps réel sur les métriques au niveau des appareils, notamment la charge CPU, l'utilisation de la mémoire et l'état des disques, avec des alertes à seuil qui se déclenchent avant que les utilisateurs finaux ne signalent des problèmes.
Remédiation assistée par IA
La remédiation automatisée ou assistée par IA passe de la détection à l'action. Dynatrace Davis CoPilot for Workflows intègre l'IA générative pour auto-résumer les problèmes, proposer des étapes de remédiation et modifier de façon autonome les manifestes Kubernetes pour l'auto-scaling via les automatisations GitHub. 8
 Ajouter comme source préférée
Citer cette recherche
Choisissez le format qui correspond à votre lieu de publication. Coller la version avec lien dans votre CMS préserve le lien retour.
@misc{ermut2026,
  author = {Ermut, Sıla},
  title  = {{Comparatif des 10 meilleures plateformes AIOps}},
  year   = {2026},
  month  = oct,
  howpublished    = {\url{https://aimultiple.com/aiops-platforms}},
  note   = {AIMultiple. Consulté le 2 octobre 2026}
}Résultats et horodatages de 30 points de données. Téléchargez les données de synthèse présentées dans les graphiques et les tableaux de cet article sous forme de fichier ZIP contenant 3 fichiers CSV.
Vous voulez les données détaillées derrière ? Rejoindre Premium
Liens de référence
Elle a précédemment travaillé comme recruteuse dans des cabinets de gestion de projet et de conseil. Sıla est titulaire d’un master en psychologie sociale et d’une licence en relations internationales.
À lire ensuite
Créer des agents IA personnels + 18 plateformes et outils d'agents


Top 9 des plateformes CRM agentiques
Comparer plus de 20 plateformes et bibliothèques d'IA responsable



Soyez le premier à commenter
Votre adresse courriel ne sera pas publiée. Tous les champs sont obligatoires. Les commentaires sont laissés dans leur langue d'origine.